• 검색 결과가 없습니다.

Nutrient Balances and Soil Properties Affected by Application of Soybean and Barley Residues

N/A
N/A
Protected

Academic year: 2021

Share "Nutrient Balances and Soil Properties Affected by Application of Soybean and Barley Residues"

Copied!
7
0
0

로드 중.... (전체 텍스트 보기)

전체 글

(1)

Nutrient Balances and Soil Properties Affected by Application of Soybean and Barley Residues

Taek-Keun Oh, Yeon-Kyu Sonn, Dong Sung Lee

1

, Myung-Sook Kim, Seok-Cheol Kim, Hong Bae Yun, Deog-Bae Lee, and Chang-Hoon Lee*

Division of Soil and Fertilizer, NAAS, RDA, Suwon, 441-707, South Korea

1

Department of Agricultural Chemistry, Graduate School, Chungnam National University, Daejon, 305-764, South Korea

(Received: March 28 2014, Accepted: April 15 2014)

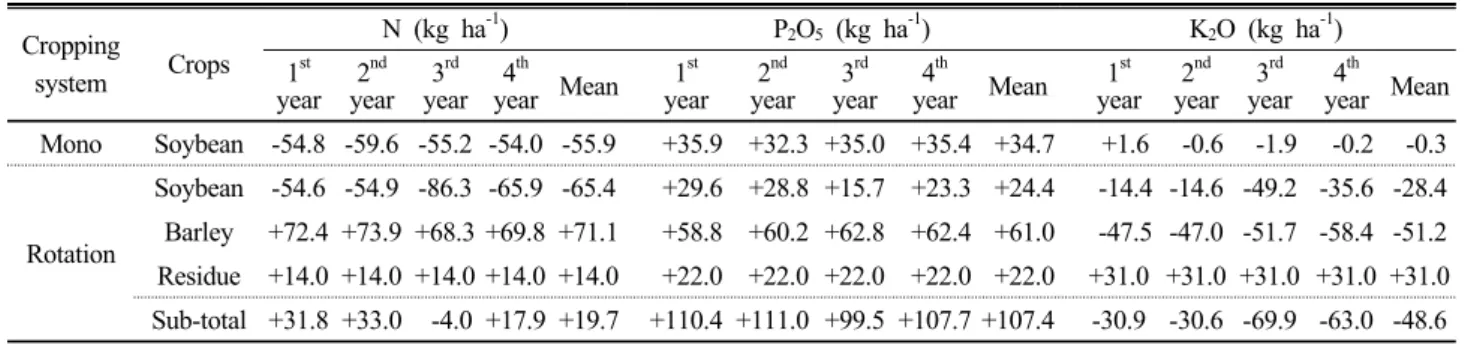
An accurate analysis of nutrient balance in different cropping systems is necessary for improving soil fertilities, causing higher crop yields and quality. This study was carried out to investigate the nutrient balance, changes in soil properties, and their effects on crop yield in long-term field cultivation under mono- and rotation-cropping systems (MCS and RCS, respectively). The analytical results of the soil properties showed that the application of mineral fertilizers alone in the MCS leads the reduction of soil CEC, exchangeable Ca, and microbial biomass C and N. Compared with the MCS of soybean, the RCS of soybean and barley significantly improved the soil properties, which increased crop yield. It might be due to the barley residue added to the RCS soil. Mean nutrient balances for 4 years were −55.9 kg N, +34.7 kg P

2

O

5

, and −0.3 kg K

2

O ha

-1

for the MCS and +19.7 kg N, +107.4 kg P

2

O

5

, and −48.6 kg K

2

O ha

-1

for the RCS, respectively. These nutrient imbalances mean that conventional fertilizer recommendations were inadequate for maintaining soil nutrient balance. From these results, we can conclude that the crop rotation may change comprehensive physical, chemical, and biological soil properties. These changes could affect the nutrient balance and then the crop yield.

Key words: Nutrient balances, Soil properties, Crop residue, Cropping systems

Comprehensive physical, chemical, and biological changes by crop rotation could affect the nutrient balance and then the crop yield.

Cropping system Crops N (kg ha

-1

) P

2

O

5

(kg ha

-1

) K

2

O (kg ha

-1

) Mean for 4 years Mean for 4 years Mean for 4 years

Mono Soybean -55.9 +34.7 -0.3

Rotation

Soybean -65.4 +24.4 -28.4

Barley +71.1 +61.0 -51.2

Residue +14.0 +22.0 +31.0

Sub-total +19.7 +107.4 -48.6

1)

*Corresponding author : Phone: +82312900325, Fax: +82312900208, E-mail: [email protected]

§

Acknowledgement: The authors would cordially thank Prof. Jiro Chikushi for his invaluable guidance, comments, and suggestions to

improve this manuscript. This study was supported by 2014 Postdoctoral Fellowship of National Academy Agricultural Science

(PJ:009348032014), Rural Development Administration, Republic of Korea.

(2)

Table 1. Physical and chemical properties of soil used in experiment.

pH (1:5)

EC (dS m

-1

)

OM (g kg

-1

)

T-N (g kg

-1

)

Av. P

2

O

5

(mg kg

-1

)

Ex. Cations

(cmol

c

kg

-1

) Bulk density (g cm

-3

)

Particle size distribution

(%) Soil

texture

K Ca Mg Clay Silt Sand

5.5 0.2 10.2 0.9 193.3 0.1 1.9 0.7 1.4 15.2 31.1 53.7 Sandy loam

Note: EC: electrical conductivity, OM: organic matter, T-N: Total nitrogen, Av. P2O5: available phosphorus, Ex. Cations: exchangeable cations

Table 2. Mean monthly air temperature (°C) and precipitation (mm) at experimental site.

Year Climate factors Oct. Nov. Dec. Jan. Feb. Mar. Apr. May Jun. Jul. Aug. Sep.

1

st

Air temperature 13.9 7.3 -0.1 -1.1 0.4 0.6 12.8 16.9 22.4 25.5 25.9 22.9 Precipitation 92.3 25.3 18.2 7.3 1.8 54.0 73.6 121.3 76.7 345.0 338.4 402.2 2

nd

Air temperature 14.1 6.1 0.3 -2.0 -2.1 5.6 11.6 17.5 23.3 26.9 25.9 20.1 Precipitation 21.6 27.5 28.4 57.7 1.4 3.1 20.4 43.7 118.2 375.8 448.8 182.2 3

rd

Air temperature 15.4 5.9 -1.1 -4.0 -0.6 4.2 12.1 18.1 21.8 25.5 25.7 21.6 Precipitation 58.1 14.2 14.7 42.2 47.4 15.1 12.9 13.8 222.3 469.7 144.7 12.1 4

th

Air temperature 11.6 2.7 0.4 -0.4 0.4 6.2 12.7 16.4 21.0 24.7 23.7 20.6 Precipitation 73.8 12.2 17.2 31.8 3.2 35.7 152.4 77.0 52.0 257.8 487.3 31.3 Average Air temperature 13.8 5.5 -0.1 -1.9 -0.5 4.2 12.3 17.2 22.1 25.7 25.3 21.3

Precipitation 61.5 19.8 19.6 34.8 13.5 27.0 64.8 64.0 117.3 362.1 354.8 157.0

Introduction

Chemical fertilizer is a very important contributor to the increase in global agricultural productivity over the last three decades. However, the continuous and excessive use of chemical fertilizer has led various problems such as nutrient depletion, soil acidification, and groundwater contamination by nutrient leaching (Herencia et al., 2007; Undurraga et al., 2009). In particular, mono cropping, which is a traditional cropping system of only one crop growth (Zuo and Zhang, 2009), has been known to raise more serious problems with nutrient imbalance by continuous input of the chemical fertilizers, causing the reduction of crop yield and quality. Thus, the oversupply or deficiency of soil nutrient, associated with the misuse of fertilizer in the mono cropping systems, is one of the most important problems in modern agriculture in terms of sustainable and stable crop productivity in many areas throughout the world.

Although there have been many literature on the imbalanced fertilizer in the various conditions, most of the topics were limited only to crop yield and soil property analyses based on a short term and single cropping system. Little information have been published about comprehensive analysis including changes in soil properties, nutrient levels of crop-residual biomass, and crop productivity under the cropping systems in arable land. In particular, an accurate analysis on the periodic nutrient balance in the long-term rotation cropping system is necessary for more efficient and sustainable crop productivity as well as for improving soil quality and health.

In the present study, we compared mono- and rotation-cropping systems for 4 years with respect to nutrient balance, soil physical, chemical and biological properties, and their effects on crop yield. We also examined the possibility of application of crop residue to the soil as a nutrient source comparable to the crop requirement and as a soil amendment to enhance crop growth in rotation-cropping system.

Materials and Methods

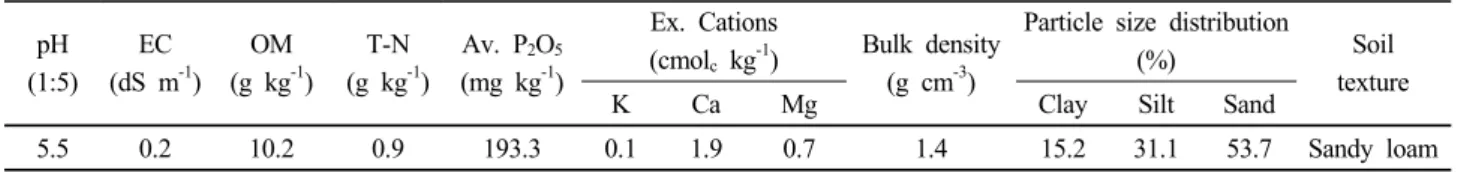
Experimental site Field experiments were conducted in the National Institute of Crop Science (NICS), Rural Development Administration (RDA), Suwon (37° 26’N; 127° 02’E), Republic of Korea. The soil was a well drained Jungdong loam (coarse loamy, mixed, mesic, family of Typic Udifluvents). Resulted physical and chemical properties of the soil are summarized in Table 1. The soil was characterized by pH of 5.5 (soil water ratio 1:5), organic matter (OM) of 10.2 g kg

-1

, available phosphate (Av. P

2

O

5

) of 193.3 mg kg

-1

, and bulk density 1.4 g cm

-3

. During the experimental period, the average annual air-temperature and precipitation at the experimental site were 12.1°C and 108.0 mm, respectively (Table 2). In particular, the annual precipitation in Korea depends largely on the summer rainy season of 30 to 40 days from late June through July, being strongly controlled by the East Asian summer monsoon system. The precipitation in this season amounts to more than 40% of the annual precipitation (Lee et al., 1998).

Experimental design and procedure Soybean (Glycine

(3)

max cv. ‘Sinpaldal 2’) and barley (Saechalssalbori) were selected as the test crops because they were the common and largely cultivated in Korea. In addition, as a rough estimation, about 2.25 × 10

5

ton of barley straw produced yearly in Korea is burned on site after harvesting and it causes air pollution (Kim, 2011). This means the loss of biomass resources expected to become huge nutrient sources in the arable soil.

The experimental design was composed of two cropping systems, these are mono-cropping system of soybean (MCS) and rotation-cropping system of soybean-to-barley (RCS).

Fertilizer for soybean and barley cultivation was yearly applied at the standard rates used in the region. Soybean was manually sown in the middle of June. In the RCS, barley was sown in the same plot in the middle of October after the harvest of the soybean and grown until the next May. After the harvest of the barley grain, the straw (barley residue) was chopped and spread with a chopper mounted on the combine harvester. The chopped barley straw was directly incorporated into the rotation field soil by tillage.

Chemical and biological properties The soil samples were collected randomly from the arable land in 0-15 cm depth after the harvest of the soybean and crushed to pass 2 mm sized sieve. We analyzed pH and electrical conductivity (EC) by the 1:5 water extraction method, OM content by the Walkley- Black method, cation exchange capacity (CEC) by the 1 M ammonium acetate method followed by the Kjeldahl determination of ammonium, Av. P

2

O

5

and exchangeable cations (Ex. Cations) by inductively coupled plasma-optical emission spectrophotometer (ICP, GBC SDS-270), total nitrogen (T-N) by the Kjeldahl method, particle size distribution by the hydrometer method, and bulk density by the soil core method described by Blake and Hartge (1986). To determine the biological effect by the crop rotation, we also measured changes in soil microbial biomass carbon (C

mic

) and microbial biomass nitrogen (N

mic

) for 4 years under the two different cropping systems after the harvest of the soybean. The C

mic

and N

mic

were determined by the chloroform-fumigation extraction method described by Vance et al. (1987) as follows: After the harvesting, the soil samples were collected randomly, passed through 2 mm size sieve, and sorted to remove plant debris. Then, the samples were allowed to stabilize for 7 days at 25°C before the analysis of soil microbial biomass and fumigated with ethanol-free chloroform for 24 hours.

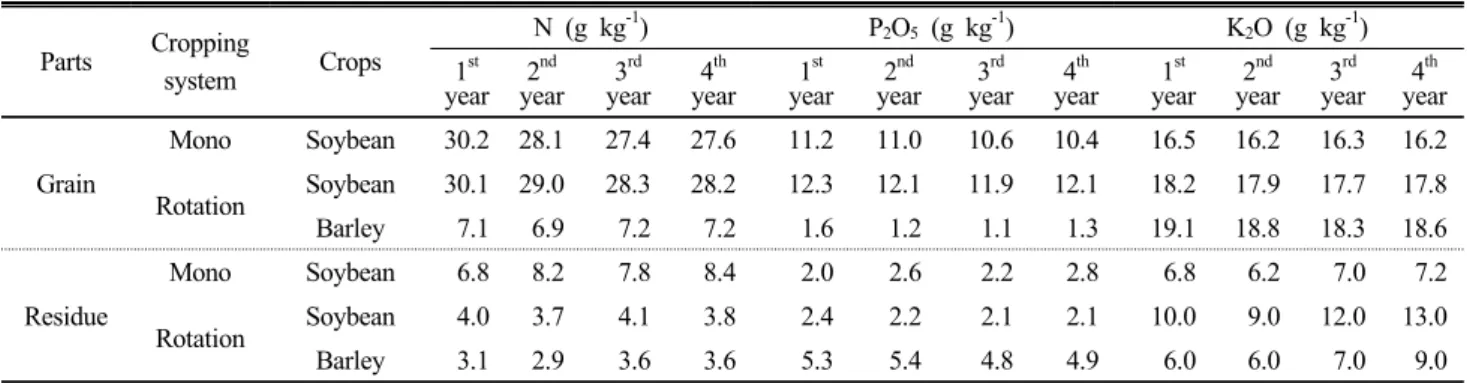
To analyze nutrient content of the crop, the crop samples were also collected randomly after the harvest and were oven-dried at 50°C for 24 hours. Then, the samples were ground in a cutting mill and sieved into less than 1-mm size.

Normal nutrient contents of the crop samples were analyzed using the same methods as those for the soil. Yield of the soybean and barley were measured according to the standard investigation and research on agricultural science technology

(RDA, 1995).

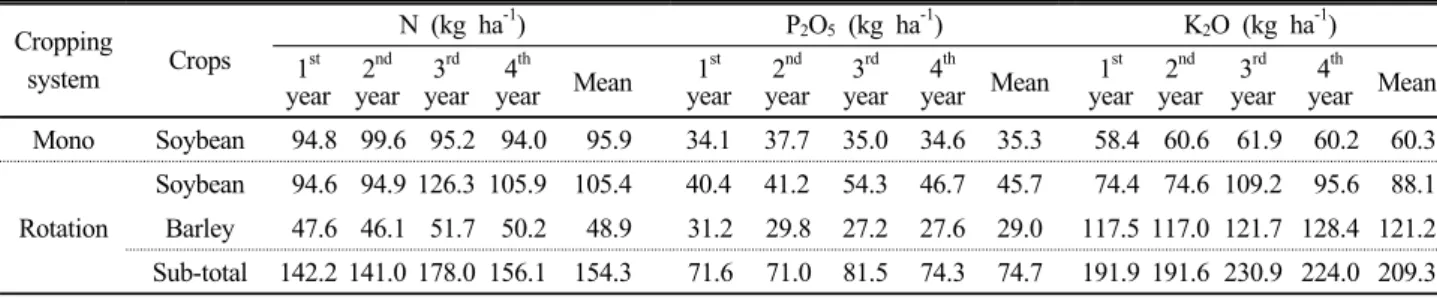
Nutrient balance To understand whether required amounts of nutrients are depleting in an unsustainable way, the nutrient balances of N, P

2

O

5

and K

2

O were determined as the difference between the nutrient inputs by the application of chemical fertilizer and/or barley residue and nutrient outputs by crop uptake. The calculations were made as follows:

ANB

MCS

= (N

add

by chemical fertilizer application) - (N

uptake

by crop uptake) (1) ANB

RCS

= (N

add

by the application of chemical fertilizer and

barley straw) - (N

uptake

by crop uptake) (2)

where ANB

MCS

and ANB

RCS

are apparent nutrient balance in the MCS and the RCS, respectively, N

add

is nutrient addition, and N

uptake

is nutrient uptake. The word of ‘apparent’ is come from that other factors of inputs or outputs such as N fixation, atmospheric deposition, and nutrient losses by leaching, chemical transformation, and erosion were neglected in these equations.

Results and Discussion

Changes in soil properties Soil physical, chemical, and biological properties were evaluated to determine the changes in the cropping systems. As shown in Table 3, most chemical properties except for the soil pH were significantly improved in the RCS compared with the MCS. In the first year the OM content was higher in the MCS than in the RCS, but was higher in the RCS than in the MCS in the following years. In other words, the OM content for the RCS increased nearly 22.1%, while that for the MCS increased about 11.2% during total cultivation periods of the 4 years. This might be due to the barley residue added to the soil in the RCS. In addition, the OM content increased with the Av. P

2

O

5

during the cultivation periods. This agrees with the result reported by Kang et al.

(2009) that OM was significantly correlated with Av. P

2

O

5

, K, Zn, and Cu. The higher Av. P

2

O

5

content for the RCS might be due to the amount of chemical phosphate fertilizer added to the soil in barley cultivation. During the cultivation periods, the CEC for the RCS increased significantly from 6.4 to 7.4 cmol

c

kg

-1

(about 15.6%), while that for the MCS gradually decreased from 6.4 to 5.7 cmol

c

kg

-1

(about 10.9%).

The physical properties for the MCS are not significantly correlated with cultivation periods, but the correlation for the RCS would be improved due to the increasing OM inputed as the barley straw every year. According to Haynes and Naidu (1998), the increase in OM content will certainly improved soil physical conditions with long-term fertilizer additions, i.e.

the increasing OM content characteristically decreased bulk

density and surface crusting and increased water holding capacity,

macroporosity, infiltration capacity, hydraulic conductivity,

(4)

Table 3. Changes of soil properties in different cropping system during the cultivation period.

Cropping

system Crops Year pH (1:5)

OM (g kg

-1

)

Av. P

2

O

5

(mg kg

-1

)

Ex. Cations

(cmol

c

kg

-1

) CEC (cmol

c

kg

-1

)

Bulk density (g cm

-3

)

Porosity (%)

Microbial biomass ( μ g kg

-1

)

K Ca Mg C N

Mono Soybean

1999 6.3 11.6 190.0 0.2 1.9 0.7 6.4 1.43 46.0 115.2 23.7

2000 6.3 11.8 195.0 0.2 1.9 0.5 6.3 1.45 45.3 110.8 22.9

2001 6.1 12.7 206.0 0.2 1.8 0.6 6.2 1.48 44.2 92.2 21.7

2002 6.1 12.9 210.0 0.2 1.7 0.7 5.7 1.36 48.7 79.8 18.7

Rotation

Soybean and Barley

1999 6.5 11.3 212.0 0.2 2.0 0.6 6.4 1.31 50.6 118.5 22.9

2000 6.3 12.7 218.0 0.2 2.1 0.7 6.9 1.31 50.6 129.3 30.2

2001 6.2 13.6 221.0 0.3 2.0 0.8 7.0 1.28 51.7 142.2 34.3

2002 6.2 13.8 225.0 0.3 2.2 0.7 7.4 1.28 51.7 164.1 37.5

※ Soil was sampling after harvesting in every autumn.

Note: OM: organic matter, Av. P

2

O

5

: available phosphorus, Ex. Cations: exchangeable cations, CEC: cation exchange capacity.

Table 4. Fertilization levels in different cropping system.

Cropping system Crops Application rate (kg ha

-1

year

-1

) Total application rate (kg ha

-1

4 year

-1

)

N P

2

O

5

K

2

O N P

2

O

5

K

2

O

Mono Soybean 40 70 60 160 280 240

Rotation

Soybean 40 70 60 160 280 240

Barley 120 90 70 480 360 280

Residue

a

14 22 31 56 88 124

Sub-total 174 182 161 696 728 644

a

Total barley residues were applied with every harvesting of barley in autumn.

Table 5. Nutrient contents of soybean and barley in different cropping system.

Parts Cropping

system Crops

N (g kg

-1

) P

2

O

5

(g kg

-1

) K

2

O (g kg

-1

) 1

st

year 2

nd

year 3

rd

year 4

th

year 1

st

year 2

nd

year 3

rd

year 4

th

year 1

st

year 2

nd

year 3

rd

year 4

th

year

Grain

Mono Soybean 30.2 28.1 27.4 27.6 11.2 11.0 10.6 10.4 16.5 16.2 16.3 16.2 Rotation Soybean 30.1 29.0 28.3 28.2 12.3 12.1 11.9 12.1 18.2 17.9 17.7 17.8 Barley 7.1 6.9 7.2 7.2 1.6 1.2 1.1 1.3 19.1 18.8 18.3 18.6

Residue

Mono Soybean 6.8 8.2 7.8 8.4 2.0 2.6 2.2 2.8 6.8 6.2 7.0 7.2 Rotation Soybean 4.0 3.7 4.1 3.8 2.4 2.2 2.1 2.1 10.0 9.0 12.0 13.0 Barley 3.1 2.9 3.6 3.6 5.3 5.4 4.8 4.9 6.0 6.0 7.0 9.0

and aggregation. Mando et al. (1996) also reported that crop residues increase soil hydraulic conductivity and infiltration capacity by modifying mainly soil structure, proportion of macropores, and aggregate stability.

The soil microbial biomass is an important source or sink of the mineral nutrients available for plants (Insam et al., 1989) and is responsible for transforming OM and nutrients within soil (Gregorich et al., 2000). Thus, the measure of soil microbial biomass can be one of the biological indicators of soil quality (Franzluebbers, 1999). The C

mic

and N

mic

for the RCS gradually increased from 118.5 to 164.1μg kg

-1

(38.5%) and from 22.9 to 37.5μg kg

-1

(63.8%) during the cultivation

periods, respectively, while those for the MCS decreased by 30.7% and 20.1% during the same periods, respectively.

Compared with the MCS, the more positive effect of the microbial biomass for the RCS might be due to the increased OM and the enhanced soil structure by the residue application.

This result is similar to that studied by Moore et al. (2000) using the cropping systems of corn-to-soybean. They also concluded that the C

mic

and N

mic

contents were generally higher in 4-year rotations than in corn or soybean monocultures.

Nutrient inputs Fertilization levels applied to the MCS

and RCS were investigated to establish the nutrient balance of

(5)

Table 6. Comparison of crop productivity in different cropping system.

Cropping

system Crops

Grain (Mg ha

-1

year

-1

) Residue (Mg ha

-1

year

-1

) 1

st

year 2

nd

year 3

rd

year 4

th

year Total 1

st

year 2

nd

Year 3

rd

year 4

th

year Total

Mono Soybean 2.66 2.92 2.83 2.74 11.15 2.13 2.14 2.26 2.19 8.72

Rotation

Soybean 2.84 2.97 4.00 3.39 13.20 2.27 2.38 3.20 2.71 10.56

Barley 4.75 4.80 4.91 4.79 19.25 4.46 4.46 4.55 4.37 17.84

Sub-total 7.59 7.77 8.91 8.18 32.45 6.73 6.84 7.75 7.08 28.40

Table 7. Characteristics of nutrient uptakes of crop plants in different cropping system.

Cropping

system Crops

N (kg ha

-1

) P

2

O

5

(kg ha

-1

) K

2

O (kg ha

-1

) 1

st

year 2

nd

year 3

rd

year 4

th

year Mean 1

st

year 2

nd

year 3

rd

year 4

th

year Mean 1

st

year 2

nd

year 3

rd

year 4

th

year Mean Mono Soybean 94.8 99.6 95.2 94.0 95.9 34.1 37.7 35.0 34.6 35.3 58.4 60.6 61.9 60.2 60.3

Rotation

Soybean 94.6 94.9 126.3 105.9 105.4 40.4 41.2 54.3 46.7 45.7 74.4 74.6 109.2 95.6 88.1 Barley 47.6 46.1 51.7 50.2 48.9 31.2 29.8 27.2 27.6 29.0 117.5 117.0 121.7 128.4 121.2 Sub-total 142.2 141.0 178.0 156.1 154.3 71.6 71.0 81.5 74.3 74.7 191.9 191.6 230.9 224.0 209.3 N, P

2

O

5

, and K

2

O during the growing season. Fertilizer application

rates to the MCS was yearly 40-70-60 kg ha

-1

(N-P

2

O

5

-K

2

O) and those to the RCS were 174-182-161 kg ha

-1

(Table 4) containing the nutrient content of barley residues. The nutrient input in the RCS was about 2.6 to 4.4 times of that in the MCS.

Harvested crops can deprive the nutrients such as N, P

2

O

5

, and K

2

O from agricultural soils. Thus, nutrient contents included in the soybean and barley were also estimated for the nutrient balance in the different cropping system (Table 5). The mean nutrient contents in grain and residue were 28.3-10.8-16.3 and 7.8-2.4-6.8 g kg

-1

for the MCS and 36.0-13.4-36.6 and 7.2-7.3-18.0 g kg

-1

for the RCS, respectively. Yearly changes of nutrient content were not significantly different between the two cropping systems. However, the nutrient contents in soybean grain were higher in the RCS than in the MCS.

Nutrient availability in the RCS rather than MCS might be enhanced because the crop rotation system improves soil physical, chemical, and biological conditions as mentioned above.

Yield Table 6 shows yearly changes of crop productivity for different cropping system. In the MCS, the grain yield of soybean increased temporarily in the second year, but gradually decreased in the third and the forth year cultivation. The grain yield of the soybean and barley increased from 28.4 to 40.0 Mg ha

-1

year

-1

and from 47.5 to 49.1 kg ha

-1

year

-1

, respectively, in the RCS during growth period from first to third year. In the forth year, their values decreased to 33.9 Mg ha

-1

year

-1

in the soybean cultivation and to 47.9 Mg ha

-1

year

-1

in the barley cultivation, respectively. The abrupt decrease of soybean yield in the forth year may be because of the adverse impact of the typhoon ‘Rusa’ occurred from the end of August to the beginning of September, which is the harvest period of soybean. However,

the total grain yield of soybean was higher about 18.4% in the RCS than in the MCS. As shown in Table 3, the soil physical, chemical, and biological properties were improved by the crop rotation and the crop residue return to soil, and consequentially, resulted in the increase of the yield. This result was similar to that of Motomatsu (1990), in which soybean yield decreased by 20% in continuous cultivation during 3 years. Park et al.

(1993) also reported that soybean yield was dropped sharply during continuous cultivation during 4 years in sandy loam soil. Thus, the rotation of soybean and barley could be recommended to obtain higher soybean yield.

Nutrient uptake On the basis of the results of nutrient contents and yields in different cropping systems, annual nutrient uptake by the soybean or barley can be calculated as follow:

Nutrient uptake =

[(Grain P × Grain Nc) + (Residue P × Residue Nc)] (3)

where P and Nc are the productivity (Mg ha

-1

) and the nutrient content (g kg

-1

), respectively.

As shown the Table 7, the mean nutrient uptake (N-P

2

O

5

-K

2

O) by soybean is higher in the RCS (105.4-45.7-88.1 kg ha

-1

) than in the MCS (95.9-35.3-60.3 kg ha

-1

) in the soybean cultivation.

This result may be attributed mainly to the improvements of

soil fertility and nutrient use efficiency by the crop rotation of

soybean-to-barley. The nutrient uptake also increased grain

yield of the soybean. That is, the grain yield and nutrient

uptake were the highest in the second year for the MCS and in

the third year for the RCS, respectively (Table 6). This suggests

that the nutrient uptake of crop is significantly associated with

the crop yield.

(6)

Table 8. Comparison of nutrient balances in different cropping system.

Cropping

system Crops

N (kg ha

-1

) P

2

O

5

(kg ha

-1

) K

2

O (kg ha

-1

) 1

st

year 2

nd

year 3

rd

year 4

th

year Mean 1

st

year 2

nd

year 3

rd

year 4

th

year Mean 1

st

year 2

nd

year 3

rd

year 4

th

year Mean Mono Soybean -54.8 -59.6 -55.2 -54.0 -55.9 +35.9 +32.3 +35.0 +35.4 +34.7 +1.6 -0.6 -1.9 -0.2 -0.3

Rotation

Soybean -54.6 -54.9 -86.3 -65.9 -65.4 +29.6 +28.8 +15.7 +23.3 +24.4 -14.4 -14.6 -49.2 -35.6 -28.4 Barley +72.4 +73.9 +68.3 +69.8 +71.1 +58.8 +60.2 +62.8 +62.4 +61.0 -47.5 -47.0 -51.7 -58.4 -51.2 Residue +14.0 +14.0 +14.0 +14.0 +14.0 +22.0 +22.0 +22.0 +22.0 +22.0 +31.0 +31.0 +31.0 +31.0 +31.0 Sub-total +31.8 +33.0 -4.0 +17.9 +19.7 +110.4 +111.0 +99.5 +107.7 +107.4 -30.9 -30.6 -69.9 -63.0 -48.6

Annual changes of nutrient balance Nutrient balance analysis of the cropping system is an important step for the efficient nutrient management. The nutrient balance can be determined from the difference between the amounts of annual nutrient input and the annual output in the cultivated fields. We estimated the overall nutrient balances in both the cropping systems (Table 8). For the mean N balance, there was significant difference between the both cropping systems. That is, a large negative balance (−55.9 kg ha

-1

) and a positive balance (+1.6 kg 10a

-1

) were shown in the MCS and the RCS, respectively.

This result might be due to the different amount of N applied to cultivation soil. Total N input was only 40 kg ha

-1

for the MCS, while was 174 kg ha

-1

for the RCS including N inputs by the barley residue (14 kg ha

-1

) and the chemical fertilizer (120 kg ha

-1

) from barley growth (Table 4). However, the mean N balance of soybean in the RCS was negative by −65.4 kg ha

-1

and its value was similar to that in the MCS. This means that recommended rate of N fertilizer application (40 kg ha

-1

) was not sufficient for the soybean growth. Thus, about 60.7 kg ha

-1

of additional N fertilizer might need to achieve the N balance in the soybean growth.

The yearly P

2

O

5

input by chemical fertilizer in the MCS was 70 kg ha

-1

(Table 4) and the yearly mean output was 35.3 kg ha

-1

(Table 7). This indicates the yearly mean P

2

O

5

balance was +34.7 kg ha

-1

. The P

2

O

5

balance was positively higher for the RCS (+107.4 kg ha

-1

) than for the MCS. The positive P

2

O

5

balance in both cropping systems was probably due to the much higher P

2

O

5

input through chemical fertilizer than the output through crop harvesting. According to Hooda et al.

(2001), when the input of P

2

O

5

into the soil exceeds the output into the crop, most of the surplus P

2

O

5

accumulated to the soil would be adsorbed by metal oxides such as iron and alumina and might be therefore decreased availability of the P

2

O

5

nutrient for the crop growth.

In contrast, K

2

O balance for both the cropping systems was negative every year except first year in the MCS, which had a slightly positive balance of +1.6 kg ha

-1

. In addition, in spite of the barley residue input, the yearly mean K

2

O depletion was higher in the RCS (−48.6 kg ha

-1

) than in the MCS (−0.3 kg ha

-1

). This means that the application rate of recommended K

2

O fertilizer, which is main input source, was not sufficient to

the nutrient balance in both the cropping systems. According to Rego et al. (2003), K

2

O imbalance has emerged as a common constraint in most cropping systems. Indeed, the negative K

2

O balance has been reported by a number of studies. For examples, Bansal (1992) reported a negative K

2

O balance of 3.3 kg K

2

O 10a

-1

for soybean cultivation in a long-term fertilizer experiment, even in a rotation-cropping system. Dobermann et al., 1996a. A. Dobermann, K.G. Cassman, P.C. Sta Cruz, M.A.A. Advieto and M.F. Pampolino , Fertilizer inputs, nutrient balance and soil nutrient supplying power in intensive irrigated rice systems. II. Effective soil K-supplying capacity. Nutr. Cycl. Agroecosyst. 46 (1996a), pp. 11–21. Full Text via CrossRef | View Record in Scopus | Cited By in Scopus (32)Dobermann et al. (1996) also reported that the K

2

O balance at most experimental sites was negative (−3.4 to

− 6.3 kg 10a

-1

season

-1

) in a long-term fertilizer experiment.

Successive negative K

2

O balance may be due to insufficient K

2

O fertilization and may cause deterioration of soil fertility that leads to a decrease of crop productivity (Magen, 2008).

As the results, continuous harvest of soybean in the same field would lead to depletion of nutrients and/or disturbance of nutrient balance that exist in soils. Although 4 years rotation of the soybean-to-barley indicated high positive balances of N and P

2

O

5

as the mean values of +19.7 kg N ha

-1

and +107.4 kg P

2

O

5

ha

-1

respectively, K

2

O fertilizer requirement needs to be reconsidered to improve its imbalance. Therefore, the more accurate and balanced application of nutrients is required for increasing the productivity of crop and to improve the qualities of soil.

Conclusions

Nutrient balance, determined by the difference between input consisting of fertilizer and crop residue and output consisting of crop uptake, is one of the important factors for soil fertility and crop yield. Nutrient source such as crop residue might mitigate various problems caused by excessive use of chemical fertilizer. In particular, the crop rotation system can improve the soil physical, chemical, and biological properties, sustain crop productivity, and reduce the use of chemical fertilizer.

Indeed, the results obtained indicated that although mean

(7)

nutrient balances for the RCS showed positive N and P

2

O

5

balance and negative K

2

O balance, the RCS contributed significantly to increase organic matter content, CEC, and soil microbial biomass in the soil more than the MCS, and then contributed to increase in crop productivities. Therefore, it can be concluded that the application of crop residues in the rotation cropping may be considered a good agronomic practice, increasing the nutrient balance in the soil and at the same time, improving the soil physical, chemical, and biological properties.

This may therefore result in higher crop yields.

References

Bansal, K.N. 1992. Potassium balance in multiple cropping system in a vertisol at Jabalpur, Journal of Potassium Research.

8(1):52-59.

Blake, G.R., and Hartge, K.H. 1986. Bulk density. Methods of soil analysis, Part 1. Physical and mineralogical methods. (Ed.

A. Klute), Am. Soc. Agron. Madison, 101 USA: 365-375.

Dobermann, A., Sta Cruz, P.C., and Casman, K.G. 1996.

Fertilizer inputs, nutrient balance, and soil nutrientsupplying power in intensive, irrigated rice systems. I. Potassium uptake and K balance, Nutrient Cycling in Agroecosystems. 46:1-10.

Franzluebbers, A.J. 1999. Introduction to symposium-microbial biomass: Measurement and role in soil quality, Can. J. Soil Sci.

79:505-506.

Gregorich, E.G., Liang, B.C., Drury, C.F., Mackenzie, A.F., and McGill, W.B. 2000. Elucidation of the source and turnover of water soluble and microbial biomass carbon in agricultural soils, Soil Biol. Biochem. 32:581-587.

Haynes, R.J., and Naidu, R. 1998. Influence of lime, fertilizer and manure applications on soil organic matter content and soil physical conditions: a review, Nutrient Cycling in Agroecosystems.

51:123-137.

Herencia, J.F., Ruiz-Porras, J.C., Melero, S., Garcia-Galavis, P.A., Morillo, E., and Maqueda, C. 2007. Comparison between organic and mineral fertilization on soil fertility levels, crop macronutrient concentrations, and yield, Agronomy J. 99:

973-983.

Hooda, P.S., Truesdale, V.W., Edwards, A.C., Withers, P.J.A., Aitken, M.N., Miller, A., and Rendell, A.R. 2001. Manuring and fertilization effects on phosphorus accumulation in soils and potential environmental implications, Adv. Environ. Res.

5:13-21.

Insam, H., Parkinson D., and Domsch K. H. 1989. I Influence of macroclimate on soil microbial biomass, Soil Biol. Biochem.

21(2):211-221.

Kang, Y.I., Lee, I.B., Park, J.M., Kang, Y.G., Kim, S.H., Ko, H.S., and Kwon, J.K. 2009. Relationship between Soil Management Methods and Soil Chemical Properties in Protected Cultivation, Korean J. Environ. Agri. 28(4):333-339.

Kim, Y.R. 2011. ‘Ethanosolv pretreatment of barley straw for fuel ethanol production’, PhD thesis, Chonbuk University.

Lee, D.K., Kim, H.R., and Hong, S.Y. 1998. Heavy rainfall over Korea during 1980-1990, Korean J. Atmos. Sci. 1(1):32-50.

Magen, H. 2008. Balanced crop nutrition: Fertilizing for crop and food quality, Turk. J. Agric. For. 32:183-193.

Mando, A., Strosnijder, L., and Brussard, L. 1996. Effects of termites on infiltration into crushed soil, Geoderma. 74:107-113.

Moore, J.M., Klose, S., and Tabatabai, M.A. 2000. Soil microbial biomass carbon and nitrogen as affected by cropping systems. Biol. Fertil. Soils. 31:200-210.

Motomatsu, T. 1990. Research plan to increase the land utility in Japan. In: Han K.H. and Jo I. S., (eds.), Strategic development in future and results of farmland cultivation project. Proceedings of symposium. Suwon (Korea); Rural Development Administration, 161-183.

Park, C.Y., Kang, U.G., Hwang, G.S., and Jung, Y.T. 1993.

Changes of crop yields according to cropping systems and fertilizing levels in paddy-upland rotation soils, J. Agric. Sci.

(S&F). 35(1):281- 288.

RDA 1995. Standard investigation methods for agriculture experiment. RDA (Rural Development Administration, Korea), Suwon (in Korean).

Rego, T.J., Rao, V.N., Seeling, B., Pardhasaradhi, G., and Kumar Rao, J.V.D.K. 2003. Nutrient balances - a guide to improving sorghum and groundnut-based dryland cropping systems in semi-arid tropical India, Field Crops Research. 81(1):53-68.

Undurraga, P., Zagal, R., Sepúlveda, G., and Valderrama, N.

2009. Dissolved organic carbon and nitrogen in Andisol for six crop rotations with different soil management intensity, Chilean J. Agricultural Research. 69:445-454.

Vance, E.D., Brookes, P.C., and Jenkinson, D.S. 1987. An extraction method for measuring soil microbial biomass carbon, Soil Biol. Bio-chem. 19:703-707.

Zuo, Y., and Zhang, F. 2009. Iron and zinc biofortification

strategies in dicot plants by intercropping with gramineous

species. A review, Agron. Sustain. Dev. 29(1):63-71.

수치

Table 1. Physical and chemical properties of soil used in experiment. pH (1:5) EC (dS m -1 ) OM(g kg -1 ) T-N(g kg -1 ) Av
Table 5. Nutrient contents of soybean and barley in different cropping system.
Table 7. Characteristics of nutrient uptakes of crop plants in different cropping system.
Table 8. Comparison of nutrient balances in different cropping system. Cropping  system Crops N (kg ha -1 ) P 2 O 5  (kg ha -1 ) K 2 O (kg ha -1 )1st year 2 nd year 3 rd year 4 th year Mean 1 st year 2 nd year 3 rd year 4 th year Mean 1 st year 2 nd year 3

참조

관련 문서

Life Cycle GWP and Energy Balance for Biomass Gasification / Reforming using Energy Crop Biomass. Net energy ratio = (123 MJ + 80 MJ) / 6

In an effort to develop a new method to remove nitrogen, this study examined the effects of C/N ratio, carbon source and nitrogen concentration on

But, in this case, it cause damage the near by houses, factories, railroads due to the soil disturbance due to soft ground improvement and also cause

The cell growth rate, biomass productivity, oil content and fatty acid composition of T.. oculata, candidates for biodiesel production were measured using

To confirm the characteristics and field application of lightweight air-mixed soil, compressive strength, capillary rise height, permeability coefficient,

In this study, the numeral analysis has been conducted to verify the effect on behavior of abutment and under ground when Lightweight Air-trapped soil(ATS)

Of average biomass of zooplankton, Southern East-Sea having the highest water temperature and salinity, showed the highest biomass, as well as relatively high

Strength of protein gels prepared with microbial transglutaminase as related to reaction conditions.. Gel strength enhancement by addition of