기후변화에 의한 눈잣나무의 서식지 분포 예측
박현철*·이정환**·이관규***
강원대학교 대학원 조경학과*·강원대학교 환경연구소**·강원대학교 조경학과***
Predicting the suitable habitat of the Pinus pumila under climate change
Hyun-Chul Park*·Jung-Hwan Lee**·Gwan-Gyu Lee ***
Department of Landscape Architecture, Graduate School, Kangwon National University*
Institute of Environmental at Kangwon National University**
Department of Landscape Architecture, Kangwon National University***
요 약 : 이 연구는 국립생물자원에서 선정한 기후변화생물지표 중에서 남한의 설악산에 제한적으로 분포 하는 눈잣나무의 기후변화에 의한 잠재 서식지 예측을 위해 시행되었다. 눈잣나무의 잠재서식지 예측을 위해 IPCC(AR5)의 대표농도경로(RCP)를 기후변화 시나리오로 사용하였다. 종 분포 모형은 Maxent를 사용하였고, 환경변수는 고도, 연평균기온 등으로 총 8개이다. 남한이 눈잣나무 분포지역은 설악산이 유 일한 지역으로 지리적 범위는 위도 38° 7’ 8”N~38° 7’ 14”N 경도 128° 28’ 2”E~128° 27’ 38”E 범위에 국 지적으로 분포하며, 고도는 1,586m~1,688m 범위에 분포한다. 종 분포 모형의 모형 정확도는 0.978으로 매우 우수하였고 잠재서식지 예측에 기여도가 높은 환경변수는 고도로 나타났다. LPT를 기준으로 선정된 현재기후의 잠재 서식지는 7,345km2이며 기후변화 시나리오를 적용한 미래의 잠재 서식지 면적은 감소 하였고 감소폭은 RCP 4.5보다 RCP 8.5가 많았다. 설악산의 눈잣나무 개체군 분포 지역은 한반도의 남방 한계선으로 예상되며 기후변화에 의해 개체군의 축소 및 소실이 예상되므로 전략적인 유전자원 확보를 위 한 대책이 필요하다.
주요어 : 기후변화, 잠재 서식지, 기후변화생물지표, 대표농도경로, 종분포모형
Abstract : This study was performed to predict the future climate envelope of Pinus pumila, a subalpine plant and a Climate-sensitive Biological Indicator Species (CBIS) of Korea. P. pumila is distributed at Mt. seorak in South Korea. Suitable habitat were predicted under two alternative RCPscenarios (IPCC AR5). The SDM used for future prediction was a Maxent model, and the total number of environmental variables for Maxent was 8. It was found that the distribution range of P.
pumila in the South Korean was 38° 7’ 8”N~38° 7’ 14”N and 128° 28’ 2”E~128° 27’ 38”E and 1,586m~1,688m in altitude. The variables that contribute the most to define the climate envelope are altitude. Climate envelope simulation accuracy was evaluated using the ROC’s AUC. The P.
Research Paper
Corresponding Author: Gwan-Gyu Lee, Dept. of Landscape Architecture, Kangwon National University. Tel: +82-33-250-8346 Email:
Received : 23 June, 2014. Revised : 7 October, 2014. Accepted : 13 October, 2014.
I. 서 론
2007년 기 후 변 화 에 관 한 정 부 간 협 의 체 (Intergovernmental Panel on Climate Change, IPCC) 4차 보고서에서는 기후변화의 미래예측에 의 한 심각성과 함께 기후변화에 의한 생물다양성의 영 향을 지적하고 있다(IPCC, 2007). 기후변화에 의한 세계 평균기온의 상승으로 생물종의 약 20~30%가 멸종이 예상되며 생물기후(phenology)의 변화로 서 식지의 북상이 관찰되고 있다(Parmesan and Yohe, 2003).
생물기후의 변화에 의한 생물다양성 변화에 관한 연구는 생태학에서 중요한 연구 주제가 되고 있다 (Woodward, 1987). 그러나 기후변화에 의한 생물다 양성의 변화를 연구하기 위해서는 장기간 조사에 의 한 시계열 자료 구축이 필요하며 자료가 충분히 축적 되지 않은 경우 미래 예측이 어렵다(Yoon et al., 2011). 이러한 한계를 극복하기 위해 종의 보전 계획, 종의 생태적 지위를 예측하기 위한 종 분포 모델 (Species distribution models, SDMs)이 적용되고 있다(Austin, 2007). 종 분포 모델을 이용하면 현재 종의 분포위치와 지형자료, 현재 및 미래 기후자료를 변수로 사용하여 미래기후에 의한 잠재적인 종 분포 를 예측할 수 있다. 국외에서는 다양한 종 분포 모형 으로 기후변화에 의한 미래 종 분포 예측이 시도되고
있으나 국내에서는 소규모 지역에서 지형자료를 이 용한 동물 서식처 예측에 국한되어 있고 기후변화에 의한 미래 예측은 미진한 편이다(Kim et al., 2012;
Kwon et al., 2012a; Song and Kim, 2012).
이러한 종 분포 모델을 이용한 미래 분포 예측과 더불어 종 분포 예측의 기초 자료가 될 수 있는 종의 분포자료 수집에 관한 정보들이 일반시민단체에서 활발하게 수집되고 있으며 국제적으로는 GEO- BON(Groups on Earth Observations-Biodiversity Observation Networks)을 통해 이루어지고 있다.
그러나 생물종별로 다른 조사방법, 조사 대상 생물 종이 통일 되지 않아 국가적으로 정보를 축적하는 데 한계가 있다. 이러한 이유로 국립생물자원관 (National Institute of Biological Resources, NIBR)은 기후변화에 의한 생물다양성의 변화를 모니터링하기 위해 기후변화 생물지표(Climate- sensitive Biological Indicator Species, CBIS)를 선 정하였고 국가 차원의 관리를 계획하였다. CBIS의 선정기준은 기후변화에 의한 계절활동, 분포역 및 개체군 크기 변화가 분명하여 지표화 할 수 있고 정 부차원에서 지속적인 조사 및 관리가 필요한 생물종 으로 기후변화로 인한 생물다양성의 변화 및 감소의 영향과 취약성을 평가함에 목적이 있다(Lee et al., 2010).
pumila model’s 5-cv AUC was found to be 0.99966. which showed that model accuracy was very high. Under both the RCP4.5 and RCP8.5 scenarios, the climate envelope for P. pumila is predicted to decrease in South Korea. According to the results of the maxent model has been applied in the current climate, suitable habitat is 790.78㎢. The suitable habitats, are distributed in the region of over 1,400m . Further, in comparison with the suitable habitat of applying RCP4.5 and RCP8.5 suitable habitat current, reduction of area RCP8.5 was greater than RCP4.5. Thus, climate change will affect the distribution of P. pumila. Therefore, governmental measures to conserve this species will be necessary. Additionally, for CBIS vulnerability analysis and studies using sampling techniques to monitor areas based on the outcomes of this study, future study designs should incorporate the use of climatic predictions derived from multiple GCMs, especially GCMs that were not the one used in this study. Furthermore, if environmental variables directly relevant to CBIS distribution other than climate variables, such as the Bioclim parameters, are ever identified, more accurate prediction than in this study will be possible.
Keywords : Climate-sensitive Biological Indicator Species, Predicted Suitable habitat, Maxent, RCPs
CBIS중에서 종 분포 모델을 이용하여 기후변화에 의한 잠재 서식처를 예측한 국내 사례는 Yoon(2011) 의 연구가 있으며 이 연구에서는 상록활엽수인 붉가 시나무(Quercus acuta Thunb.)와 후박나무(Machilus thunbergii Siebold & Zucc.)를 대상으로 기후변화 에 따른 미래 잠재생육지를 분석하였고 상록활엽수 의 생육지 북상을 예상하였다. 이는 활엽상록수 군락 을 서식기반으로 하는 조류, 곤충 등의 서식처도 생 성되는 것으로 생물다양성 측면에서 다양한 서식공 간의 창출 및 다양성의 증가가 예상된다. 또한 기후 변화에 의한 생물종의 서식지 북상은 농업환경에도 변화를 일으켜 아열대 작물의 생산가능 등의 긍정적 인 면도 있다(Kwak et al., 2008). 그러나 아고산대 와 같은 극한 환경에 분포하는 생물은 기후변화에 민 감하게 반응하고 기후변화는 서식지의 축소를 야기 한다. 특히 북방계 식물들의 잔존적 피난처인 아고산 대에 분포하는 식물들은 기후변화에 의한 수목한계 선의 변화, 자생지 변화로 멸종 위기에 직면해 있다 (Chung et al., 2013; Saavedra et al., 2003; Rochefort et al., 1994; Dirnböck et al., 2003; Gonzàlez, 2014). 우리나라는 북한에 비해 아고산대가 상대적
으로 빈약한 편으로 기온상승으로 인한 아고산대의 소 멸은 생물종의 멸종을 야기해 생물다양성 확보차원에 서 불리 할 수 있다(Lee and Kim, 2007).
따라서 본 연구는 CBIS 중에서 기후변화에 의해 분포지역의 축소가 예상되는 아고산식물중에서 남한 에 제한적으로 분포하고 관찰이 용이하며 개체군의 식별이 확실한 아고산 식물을 선정하여 현재 분포의 지리적 분포 범위를 규명하고 종 분포 모델과 IPCC 5차 평가 보고서의 대표농도경도(Representative Concentration Pathways, RCPs)를 적용한 기후변 화 시나리오를 이용해 현재 및 미래의 잠재 분포 지 역을 예측함에 목적이 있다. 또한 본 연구는 기후변 화에 의한 취약지역 분석, CBIS 모니터링 지역 선정 을 위한 기초연구가 될 것으로 기대한다.
II. 연구방법
1. 연구대상 종의 선정
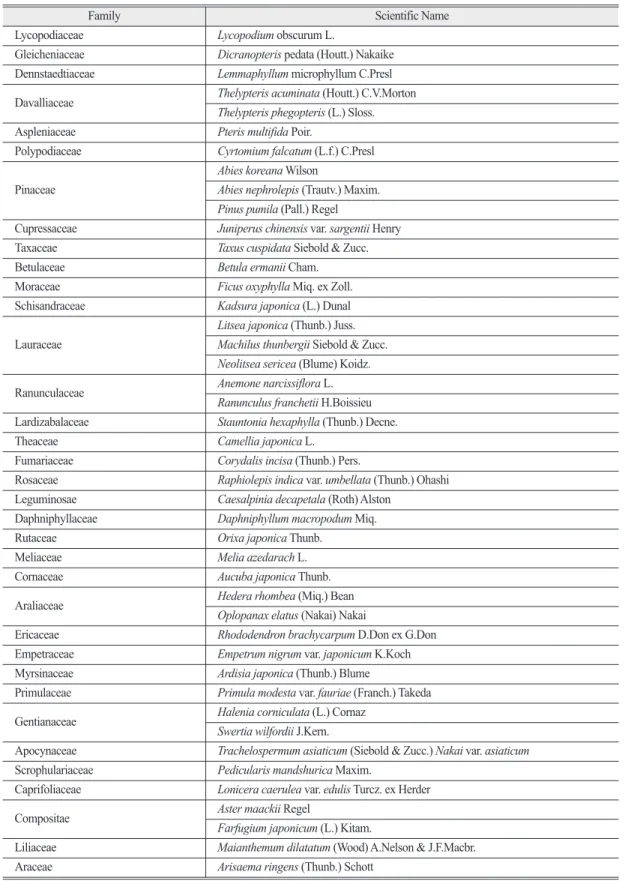
국립생물자원관에서 선정한 기후변화생물지표는 100종이다. 기후변화생물지표 100종의 생물 중 관속 식물은 44종이며(Table 1), 이중 본 연구에서 선정한
Figure 1. P. pumila populations distributed in Mt. Seorak of South Korea
Table 1. The vascular plants in CBIS that was selected in the NIBR of Korea
Family Scientific Name
Lycopodiaceae Lycopodium obscurum L.
Gleicheniaceae Dicranopteris pedata (Houtt.) Nakaike Dennstaedtiaceae Lemmaphyllum microphyllum C.Presl Davalliaceae Thelypteris acuminata (Houtt.) C.V.Morton
Thelypteris phegopteris (L.) Sloss.
Aspleniaceae Pteris multifida Poir.
Polypodiaceae Cyrtomium falcatum (L.f.) C.Presl Pinaceae
Abies koreana Wilson
Abies nephrolepis (Trautv.) Maxim.
Pinus pumila (Pall.) Regel
Cupressaceae Juniperus chinensis var. sargentii Henry Taxaceae Taxus cuspidata Siebold & Zucc.
Betulaceae Betula ermanii Cham.
Moraceae Ficus oxyphylla Miq. ex Zoll.
Schisandraceae Kadsura japonica (L.) Dunal Lauraceae
Litsea japonica (Thunb.) Juss.
Machilus thunbergii Siebold & Zucc.
Neolitsea sericea (Blume) Koidz.
Ranunculaceae Anemone narcissiflora L.
Ranunculus franchetii H.Boissieu Lardizabalaceae Stauntonia hexaphylla (Thunb.) Decne.
Theaceae Camellia japonica L.
Fumariaceae Corydalis incisa (Thunb.) Pers.
Rosaceae Raphiolepis indica var. umbellata (Thunb.) Ohashi Leguminosae Caesalpinia decapetala (Roth) Alston
Daphniphyllaceae Daphniphyllum macropodum Miq.
Rutaceae Orixa japonica Thunb.
Meliaceae Melia azedarach L.
Cornaceae Aucuba japonica Thunb.
Araliaceae Hedera rhombea (Miq.) Bean
Oplopanax elatus (Nakai) Nakai
Ericaceae Rhododendron brachycarpum D.Don ex G.Don
Empetraceae Empetrum nigrum var. japonicum K.Koch Myrsinaceae Ardisia japonica (Thunb.) Blume
Primulaceae Primula modesta var. fauriae (Franch.) Takeda Gentianaceae Halenia corniculata (L.) Cornaz
Swertia wilfordii J.Kern.
Apocynaceae Trachelospermum asiaticum (Siebold & Zucc.) Nakai var. asiaticum Scrophulariaceae Pedicularis mandshurica Maxim.
Caprifoliaceae Lonicera caerulea var. edulis Turcz. ex Herder
Compositae Aster maackii Regel
Farfugium japonicum (L.) Kitam.
Liliaceae Maianthemum dilatatum (Wood) A.Nelson & J.F.Macbr.
Araceae Arisaema ringens (Thunb.) Schott
식물은 북방계식물이며 아고산 식물인 눈잣나무 (Pinus pumila (Pall.) Regel)이다(Figure 1). 눈잣 나무는 소나무과(Pinaceae), 소나무속(Pinus) 에 속 하며 동북아시아 원산으로 아고산대에 분포하고 시 베리아소나무, 잣나무와 분포지역은 겹치나, 잣나무 에 비해 고지대에 분포한다(Kong, 2006). 우리나라 에서는 설악산 중청과 대청봉을 연결하는 능선에 분 포하며 유일한 서식지로 알려져 있다(Kong, 2000).
또한 IUCN Red list 카테고리에 약관심종(Least Concern)으로 기재되어 있다(Farjon, 2013).
눈잣나무의 출현 자료(presence data)는 현장조 사를 이용하여 수집하였다. 현장 조사는 2012년 5월
4일, 5월 15일, 7월 26일에 시행하였고, 출현위치의 좌표와 고도 기록은 GPS(Ascen GPS 742)를 이용하 였다. 눈잣나무는 설악산이 유일한 남한내 분포지역 으로 중청에서 대청봉을 연결하는 능선에 분포 하고 있어 현장 답사를 통해 눈잣나무의 개체가 분포하는 지역의 좌표를 WGS84기준으로 기록하였다. 그리고 기존에 알려지지 않은 대청봉과 관모봉을 연결하는 관모능선에서 눈잣나무 개체군을 확인하여 좌표를 기록하였다.
2. 연구지역
본 연구는 기후변화에 따른 CBIS의 잠재서식지 분 Figure 2. The local range for analysis of suitable habitat of P. pumila and the mark(●, ○) is P. pumila’s presence location
포 및 IPCC 기후변화 시나리오(AR5)에 따른 서식지 변화 예측에 목적이 있다. 연구 대상 식물종인 눈잣 나무는 북방계 아고산식물로 한반도의 분포지역 강 원도 설악산 및 북한에 국한되어 있다(Kong, 2006).
따라서 한반도 전역을 잠재 서식지 예측 지역으로 선 정하였다.
3. 종분포 모형(SDMs)
본 연구와 같이 종 분포 자료를 이용하여 잠재서식 지 예측, 생물다양성 보전 계획, 서식지 적합성 평가 에는 종 분포 모델이 필요하며 다양한 종 분포 모형 (SDMs)이 개발되었다. 대표적인 종 분포 모형에는 종의 출현/비출현(presence-absence)자료를 이용 하고 선형회귀분석기반의 GLM (Generalized Linear Model), GLM을 변형한 GAM (Generalized Additive Model), ANN (Artificial Neural Network) 등이 활 용 되고 있다(Scott et al., 2002). 그러나 본 연구와 같이 비출현 정보를 확보할 수 없고 출현정보에 의존 해야 할 경우 Maxent (Maximum Entropy Model) 가 많이 사용되고 있다(Pearson, 2007). Maxent는 기계학습(machine learning)기반의 모델이며, 연구 자가 설정한 변수와 제한요소를 이용하여 종 분포 확 률을 예측하는 모형으로 종의 출현과 변수의 선형, 비모수적인 관계들을 나타내어준다(Phillips et al., 2006). 따라서 본 연구에서 사용한 종 분포 모형은 종 출현자료(only presence data)만으로 서식지 분 포 예측이 가능한 Maxent version 3.3.3k (Phillips et al., 2006)를 사용하였다.
4. 환경변수
모델에 사용된 종속변수는 종이 출현한 위치의 경 위도 좌표(WGS84 datum) 이며 북한에 분포하는 눈 잣나무의 위치는 Kong(2006)을 참조 하고, 남한에 눈잣나무 위치는 현장 조사를 수집한 자료를 이용하 였다. 남한의 위치자료는 표집편향(sampling bias) 를 고려해 개체군의 중심지역 좌표 1개를 사용하여 총 12개의 위치자료를 사용하였다.
독립변수는 한반도 전체의 수치표고 모델(DEM)과
IPCC 5차 평가보고서(AR5)의 대표농도경도 RCPs 를 적용한 Bioclim(http://www.worldclim.org) 기 후자료를 사용하였다(Table 2). Bioclim의 기후자료 는 총 19개 변수를 제공하며 19개 변수는 다중공선성 (Multicollinearity)이 발생 할 수 있다. 따라서 PCA 분석을 통해 대표성을 가지고 있는 7개의 변수 (Bio01, Bio04, Bio10, Bio11, Bio12, Bio16, Bio17) 를 선 정 하 였 다 (Seo et al, 2009, Kwon et al., 2012b). 본 연구의 범위는 한반도 전역으로 공간 분 포 범위를 고려하여 독립변수의 공간해상도는 1km 로 설정하였다. RCPs에는 다양한 기후변화예측모델 (GCM:Global climate model)이 있으며 본 연구에 서는 한국의 CCIC(Climate Chnage Information Center)가 선정한 HadGEM2-AO를 적용하였다.
RCPs 시나리오는 온실가스저감 정책이 상당히 실현 되는 경우인 RCP 4.5, 현재 추세로 온실가스가 배출 되는 경우인 RCP 8.5를 적용하였고 예측 범위는 2050년(2041년~2060년 평균)과 2070년(2061년
~2080년 평균)으로 설정하였다. 독립 변수 및 수집 된 눈잣나무의 위치자료는 ESRI사의 Arcgis(ver 9.3.1)와 Diva-gis를 이용하여 Maxent에 입력할 수 있도록 ASCII, CVS 포멧으로 변환하였다.
5. Maxent 모형의 정확도 및 잠재서식지 예측 본 연구에 사용된 환경변수는 생물기후(bioclim) 7개와 수치표고 모델로 총 8개의 변수를 사용하였 다. 잠재서식지의 모의 정확도는 ROC(Receiver Table 2. Environment variables used for the prediction of
suitable habitat
Variables code Description bio01 Annual Mean Temperature bio04 Temperature Seasonality
(standard deviation *100) bio10 Mean Temperature of Warmest Quarter bio11 Mean Temperature of Coldest Quarter bio12 Annual Precipitation bio16 Precipitation of Wettest Quarter bio17 Precipitation of Driest Quarter Altitude Digital Elevation Model
operating characteristic)의 AUC(Area Under Cover)값을 이용해 측정하였다. AUC를 이용한 모의 정확도는 기준값에 독립적인 장점을 가지고 있으며 다양한 모형의 정확도 비교에 많이 이용된다. AUC 값은 최소 0.5를 기준으로 모형이 완벽할 경우 1.0의 값을 나타내며 일반적으로 0.8이상이면 모형 예측력 이 우수하다고 판단한다(Thuiller, 2003; Franklin, 2009). 본 연구에서는 모형을 교차검증(5-folder cross-validation)하여 정확도를 향상시켰다. 눈잣 나무 잠재서식지 예측은 Maxent 의해 예측된 확률 분포에서 LPT(Lowest Presence Threshold)를 선 정하고 LPT 이상인 지역을 잠재적인 서식지로 선정 하였다(Pearsonet al., 2007). 잠재서식지 분포도 는 종의 분포 확률이 LPT 이상 지역을 잠재서식지, LPT 이하 지역을 비잠재식지로 구분되는 binary 형 태로 재배열(Recalss)하여 작성하였다.
III. 결 과
1. 눈잣나무의 분포
Kong(2006)에 의하면 북한지역의 눈잣나무 분포 지역은 로봉, 비로봉, 백두산, 만탑산, 오갈봉, 낭림 산, 숭적산, 차일봉 등으로 수직 분포역은 900~
2,540m로 보고 하고 있다. 남한의 눈잣나무 분포지 역은 설악산국립공원의 중청대피소와 대청봉을 연결 하는 능선에 군락으로 분포하였고, 대청봉과 관모봉
을 연결하는 관모능선에서는 중청에 분포하는 군락 에 비해 소규모의 군락 또는 단독개체로 분포하였다 (Figure 2). 현장조사를 통해 획득한 눈잣나무의 출 현 좌표는 17개 지점이이며 위도 38° 7 ‘ 8”N~38° 7’
14”N, 경도 128° 28’ 2“E~128° 27’ 38”E, 고도 1,586m
~1,688m 범위에 분포하였다(Table 3). 남한의 눈잣 나무 분포지역의 기후 특성은 연평균기온 2.5~3.2℃, 최고기온 19.7~20.4℃, 최저기온 -16.7~-17.4℃, Table 3. Altitude and coordinates of P. pumila distribution
areas in South Korea
Latitude(N) Longitude(E) Altitude(m) 38°7’14.85”N 128°27’38.54”E 1,586 38°7’13.65”N 128°27’41.12”E 1,586 38°7’13.14”N 128°27’42.45”E 1,593 38°7’13.56”N 128°27’43.50”E 1,597 38°7’13.14”N 128°27’42.45”E 1,598 38°7’11.73”N 128°27’44.39”E 1,602 38°7’11.97”N 128°27’43.80”E 1,602 38°7’12.69”N 128°27’44.85”E 1,606 38°7’11.53”N 128°27’45.44”E 1,616 38°7’10.77”N 128°27’47.09”E 1,623 38°7’9.97”N 128°27’47.46”E 1,628 38°7’9.65”N 128°27’49.00”E 1,634 38°7’9.48”N 128°27’59.03”E 1,639 38°7’8.44”N 128°27’58.84”E 1,682 38°7’8.60”N 128°27’59.89”E 1,683 38°7’8.28”N 128°28’0.82”E 1,686 38°7’9.13”N 128°28’2.69”E 1,688
Figure 3. Environmental attributes of P. pumila distribution area in South Korea
연강수량 1,641~1,665mm로 나타났다(Figure 3).
2. Maxent 모델링
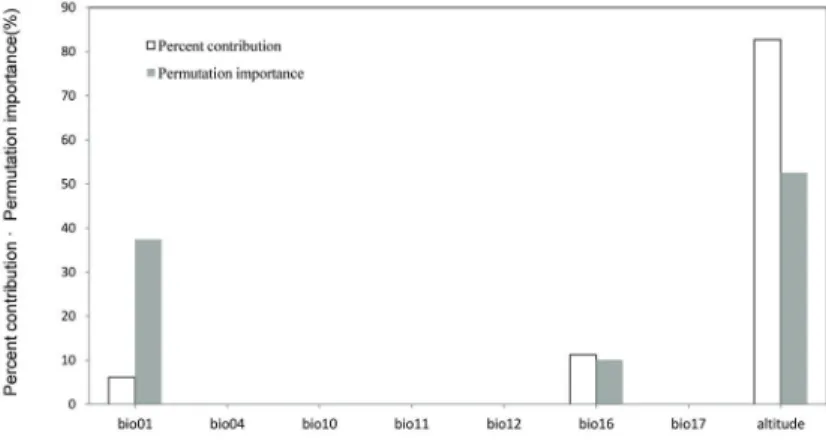
눈잣나무의 현재 분포에 관여하는 환경 변수는 Maxent 모델의 기여도 평가에 의해서 측정하였다.
눈잣나무의 기여도 평가에서는 고도가 82.7%를 차 지하여 기여가 가장 높았으며, 강우관련 변수인 bio16(Precipitation of Wettest Quarter) 기온변수 인 bio10(Mean Temperature of Warmest Quarter) 는 각각 11.2%, 6.1%로 측정되었다. bio04, bio10, bio11, bio12, bio17은 기여도가 없었다. Maxent 모 형의 무작위 샘플링에 의한 Permutation importance 는 고도가 52.5%로 중요도가 가장 높았고 bio01은 37.4%, bio16은 10.1%로 측 정 되 었 으 며 bio04, bio10, bio11, bio12, bio17은 기여도가 측정되지 않
았다(Figure 4, 5). 잠재서식지 모의 정확도 평가는 ROC의 AUC(5-folder cross-validation)를 통하여 분석하였다. 눈잣나무의 5-cv AUC는 0.978으로 모 형의 정확도는 매우 우수한 것으로 나타났다.
3. 잠재서식지 예측
눈잣나무의 미래기후에 의한 잠재서식지 예측은 IPCC 5차 평가보고서(AR5)의 대표농도경도 RCPs 를 Maxent에 적용하여 예측하였다. RCPs 시나리오 는 온실가스저감 정책이 상당히 실현되는 경우인 RCP 4.5, 현재 추세로 온실가스가 배출되는 경우인 RCP 8.5를 적용하였고 예측 범위는 2050년(2041 년~2060년 평균)과 2070년(2061년~2080년 평균) 이다.
잠재서식지 선정의 기준이 되는 LPT(Low Presence
Figure 4. Contribution of environment variables in the estimation of the distribution of suitable habitat by Maxent model
Figure 5. Response curves for the variables related to presence of P. pumila. Red lines are mean values for the Maxent 5 runs and blue bars represent ±1 standard deviation .
Threshold)는 Maxent training 결과인 눈잣나무 출 현 지역의 MTSP(Maximum test sensitivity plus) 을 기준으로 하였고 교차검증에 의한 MTSP 평균은 0.4348로 나타났다. 따라서 Maxent 모형에서 예측 한 눈잣나무의 잠재서식지중 분포 확률 0.4348이상 지역을 잠재서식지, 0.4348이하 지역을 비잠재서식 지로 하는 binary map 형태로 분포도를 작성하였다 (Figure 6).
현재 기후 상태에서 눈잣나무의 잠재서식지는 7,345km2로 예측되었고 주로 해발 1,400이상 지역 에 분포하였다. RCPs 4.5를 적용한 2050년의 잠재 서식지는 7,341km2로 현재 보다 5km2감소, 2070 년의 잠재서식지는 5,695km2로 현재보다 1,650km2 감소하는 것으로 예측되었다. RCPs 8.5를 적용한
2050년의 잠재서식지는 7,188km2로 현재보다 157km2감소, 2070년의 잠재 서식지는 3,535km2로 현재보다 3,810km2감소하는 것으로 예측되었다. 미 래의 눈잣나무 잠재서식지는 현재보다 고도가 높아 지는 것으로 예측되었고, 감소 면적은 RCPs 4.5 보 다 RCPs 8.5가 더 많았다(Table 4). 이는 잠재 서식 지 예측에서 지형변수를 제외한 생물기후 변수에서 기여도가 높았던 기온(bio10: Mean Temperature of Warmest Quarter)이 RCPs 4.5보다 RCPs 8.5 가 더 높았기 때문이다. 따라서 눈잣나무 서식처는 기온 상승에 의해 축소 될 수 있다.
IV. 결 론
본 연구는 종 출현정보(only presence data)만을 이용해 종 분포 예측을 할 수 있는 Maxent 모델을 사용하고 8개 환경 변수를 이용하여 현재 잠재서식지 예측, RCPs를 적용한 미래 기후의 잠재서식지 예측 을 시도 하였다. 본 연구에 의한 결과는 다음과 같다.
1) 남한에서 눈잣나무의 분포 범위는 위도 38° 7’
8”N~38° 7’ 14”N, 경도 128° 28’ 2”E~128° 27’
Figure 6. Prediction of suitable habitat under climate change scenarios(RCPs) of P. pumila Table 4. Area of the suitable habitat of P. pumila by
Maxent model applying the RCPs
current RCPs 4.5 RCPs 8.5
2050 2070 2050 2070
7,345 7,341 5,695 7,188 3,535
Note: The area of suitable habitat’s unit is square kilometer
38”E, 고도 1,586m~1,688m 범위에 분포하였 다. 특히 설악산 중청과 관모능선 부근에 제한 적으로 분포하였고 한반도의 남방한계선으로 판단된다.
2) 눈잣나무 분포지역의 기후 특성은 연평균기온 2.5~3.2℃, 최고기온 19.7~20.4℃, 최저기온 -16.7~-17.4℃, 연강수량 1,641~1,665mm로 나타났다.
3) 눈잣나무 분포에 기여하는 평가에서는 고도 (Altitude)가 82.7%로 독립변수중 기여도가 가 장 높았다.
4) 잠재 서식지의 모의 정확도인 5-cv AUC는 0.978으로 모의 정확도는 매우 높은 것으로 나 타났다.
5) Maxent에 의해 예측된 잠재 서식지의 선정기 준은 5-cv MTSP=0.4348이며 현재 기후 상태 에서 눈잣나무의 잠재서식지는 7,345km2로 예 측되었고 주로 해발 1,400m이상 지역에 분포 하였다.
6) RCPs를 적용한 미래의 잠재서식지는 감소하는 것으로 예측되었고, 감소 면적은 RCPs 4.5 보 다 RCPs 8.5를 적용하였을 경우가 많았다.
7) 결론적으로 기후변화 시나리오와 종 분포 모형 에 의하면 국내 설악산에 국지적으로 분포하는 눈잣나무의 개체군은 축소하거나 소멸될 것으 로 예상되었다. 또한 눈잣나무는 유성번식과 무 성번식을 겸하는 식물로 개체군내에 근친교배 의 영향으로 유전 변이가 낮을 수 있고 유전 변 이가 낮은 개체군 집단은 절멸의 가능성이 높다 (Sydes and Peakall, 1998). 설악산의 눈잣나 무 집단은 유전 다양양성이 비교적 높으나 집단 의 크기가 작기 때문에 유전적 영향을 받을 가 능성이 있으며 눈잣나무의 종자는 성숙단계 이 전인 7~8월에 잣까마귀와 설치류의 먹이로 소 실되기 때문에 전략적인 유전자원 확보 대책이 필요하다(Song et al., 2012)
8) 현장 조사를 통해 수집된 눈잣나무 위치 좌표는 설악산에 집중되어있다. 따라서 설악산의 눈잣 나무 개체군 분포지역은 한반도 남방한계선으
로 예상된다.
본 연구를 통해 남한 지역에 제한적으로 분포하는 아고산식물인 눈잣나무의 지리적 분포 범위와 분포 에 관여하는 지형 및 생물기후변수를 규명하였다. 미 래기후에 의한 종 분포 예측과 관련된 기존의 연구가 2000년 IPCC SRES (Special Report on Emissions Scenario)를 이용하였다면 본 연구는 2013년 IPCC AR5의 RCPs를 적용하였음에 의의가 있다. 그러나 RCPs를 이용한 종 분포 예측의 아직은 미진하여 다 양한 연구 결과의 축적이 필요할 것으로 판단된다.
또한 본 연구 결과는 CBIS에 해당하는 분비나무, 주목, 구상나무 등의 대표적인 아고산식물의 기후변 화 취약지역 선정 연구에 활용될 것으로 예상되며 이 는 CBIS의 선정 목적인 모니터링 지역 선정에도 도 움이 될 것으로 예상된다.
본 연구는 기후 및 고도를 독립변수로 하여 기후변 화에 의한 종 분포를 예측하였다. 그러나 식물의 분 포에는 기후, 고도 외에 토양, 지질 등이 관여한다.
특히 초본식물의 경우에는 상관식생 또한 중요한 변 수이다. 초본식물을 대상으로 한 종 분포 모형은 기 후변화에 의한 상관식생의 변화도 함께 고려되어야 한다. 따라서 기후변화에 의한 식물의 분포를 예측하 기 위해서는 본 연구에서 적용한 GCM외에 다양한 GCM 적용 및 식물 개체군 이동에 변수로 작용할 다 양한 요인들의 규명이 먼저 확립되어야 할 것으로 판 단된다. 또한 본 연구 결과와 같이 아고산 지역에 분 포하는 식물들은 기후변화에 취약하여 개체군의 축 소 및 멸종이 예상되므로 생물다양성 확보를 위한 전 략적 대책이 필요하다.
감사의 글
본 연구는 2013년도 강원대학교 학술연구조성비 (과제번호 C1009896-01-01)로 수행되었습니다.
인용문헌
공우석. 2000. 설악산 아고산대 식생과 경관의 지 생태, 대한지리학회지, 35(2), 77-87.
공우석. 2006. 한반도에 자생하는 소나무과 나무의 생물지리, 대한지리학회, 41(1), 73-93.
곽태식, 기정훈, 김영은, 전해민, 김시진. 2008. 지 구 온난화에 따른 국내 과수작물 재배지 변 화에 대한 GIS 예측 모형 연구-여섯 가지 열대 및 아열대 과수를 중심으로, 한국공간 정보시스템학회 논문지, 10(3), 93-106.
권혁수, 류지은, 서창완, 김지연, 도재화, 서민환, 박종화. 2012b. 국지적으로 분포하는 식물 에 대한 기후 및 환경변수 영향, 한국환경복 원녹화기술학회지, 15(6), 17-27.
권혁수, 서창환, 박종화. 2012a. 지리산 지역의 생 물종 분포모형 구축 및 종풍부도 평가, 한국 지형공간정보학회지, 20(3), 11-18.
김지연, 서창환, 권혁수, 류지은, 김명진. 2012. 전 국자연환경조사 자료를 이용한 종분포모형 연구, 환경영향평가, 21(4), 593-607.
송원경, 김은영. 2012. 고라니 서식지 분석을 위한 기계학습식 종분포모형 비교, 대한원격탐사 학회지, 28(1), 171-181.
송정호, 임효인, 홍경락, 장경환, 홍용표. 2012. 설 악산 대청봉 눈잣나무(Pinus pumila (Pall.) Regel) 집단의 유전다양성과 공간적 유전구 조, 한국자원식물학회지, 25(4), 407-415.
윤종학, Katsuhiro Nakao, 박찬호, 이병윤, 오경 희. 2011. 기후변화에 따른 한반도 난온대 상록활엽수의 잠재 생육지 변화 예측, 한국 환경생태학회, 25(4). 590-600.
이동근, 김재욱. 2007. 한반도 지역의 기후변화에 의한 고산, 아고산 식생 취약성 평가, 한국 환경복원녹화기술학회지, 10(6), 110-119.
정재민, 손성원, 김상용, 박광우, 김성식. 2013. 한 반도 아고산대 특산, 희귀식물 설앵초의 유 전적 다양성과 지리적 분화, 식물분류학회 지, 43(3), 236-243.
Austin, M.. 2007. Species distribution models and ecological theory: a critical assessment and some possible new approaches, Ecological modeling, 200(1),
1-19.
Dirnböck, T., S. Dullinger and G. Grabherr.
2003. A regional impact assessment of climate and land use change on alpine vegetation, Journal of Biogeography, 30(3), 401-417.
Farjon, A.. 2013. The IUCN Red List of Threatened Species, Version 2014. 2.
Franklin, J.. 2009. Mapping species distributions:
spatial inference and prediction, Cambridge University Press.
Gonzàlez, C., A. Paz and C. Ferro. 2014.
Predicted altitudinal shifts and reduced spatial distribution of Leishmania infantum vector species under climate change scenarios in Colombia, Actatropica, 129, 83-90.
IPCC. 2007. Climate Change 2007: the Physical Science Basis, Contribution of Working Group I to the Fourth Assessment Report of the Intergovernmental Panel on Climate change, Cambridge University Press.
Lee, B. Y., G. H. Nam, J. H. Yun, G. Y. Cho, J.
S. Lee, J. H. Kim and K. H. Oh. 2010.
Biological indicators to monitor responses against climate change in Korea, Korean Journal of Plant Taxonomy, 40(4), 202- 207.
Parmesan, C. and G. Yohe. 2003. A globally coherent fingerprint of climate change impacts across natural systems, Nature, 421(6918), 37-42.
Pearson, R. G., C. J. Raxworthy, M. Nakamura, A. T. Peterson. 2007. Predicting species distributions from small numbers of occurrence records: a test case using cryptic geckos in Madagascar, Journal of Biogeography, 34(1), 102-117.
Phillips, S. J., R. P. Anderson and R. E.
Schapire. 2006. Maximum entropy modeling of species geographic distributions, Ecological modelling, 190(3), 231-259.
Rochefort, R. M., R. L. Little, A. Woodward and D. L. Peterson. 1994. Changes in sub-alpine tree distribution in western North America: a review of climatic and other causal factors, The Holocene, 4(1), 89-100.
Saavedra, F., D. W. Inouye, M. V. Price and J.
Harte. 2003. Changes in flowering and abundance of Delphinium nuttallianum (Ranunculaceae) in response to a subalpine climate warming experiment, Global Change Biology, 9(6), 885-894.
Scott, J. M., P. J. Heglund, M. L. Morrison, J.
B. Haufler, M. G. Raphael, W. A. Wall and F. B. Samson. 2002. Predicting Species Occurrences: Issues of Accuracy and Scale, Island Press, Washington, DC.
Seo, C. H., J. H. Thorn, H. N. Lee and W.
Thuiller. 2009. Scale effects in species distribution models: implications for conservation planning under climate change, Biology Letters, 5(1), 39-43.
Sydes, M. A. and R. Peakall. 1998. Extensive clonality in the endangered shrub Haloragodendron lucasii (Haloragaceae) revealed by allozymes and RAPDs, Molecular Ecology, 7(1), 87-93.
Thuiller, W.. 2003. BIOMOD-optimizing predictions of species distributions and projecting potential future shifts under global change, Global Change Biology, 9(10), 1353-1362.
Woodward, F. I.. 1987. Climate and plant distribution, Cambridge University Press.
References
Austin, M.. 2007. Species distribution models and ecological theory: a critical assessment and some possible new approaches, Ecological modeling, 200(1), 1-19.
Chung, J. M., S. W. Son, S. Y. Kim, G. W. Park and S. S. Kim. 2013. Genetic diversity and geographic differentiation in the endangered Primula farinosa subsp.
modesta, a subalpine endemic to Korea, Korean Journal of Plant Taxonomy, 43(3), 236-243.
Dirnböck, T., S. Dullinger and G. Grabherr.
2003. A regional impact assessment of climate and land use change on alpine vegetation, Journal of Biogeography, 30(3), 401-417.
Farjon, A. 2013. The IUCN Red List of Threatened Species, Version 2014. 2.
Franklin, J.. 2009. Mapping species distributions:
spatial inference and prediction, Cambridge University Press.
Gonzàlez, C., A. Paz and C. Ferro. 2014.
Predicted altitudinal shifts and reduced spatial distribution of Leishmania infantum vector species under climate change scenarios in Colombia, Actatropica, 129, 83-90.
IPCC. 2007. Climate Change 2007: the Physical Science Basis, Contribution of Working Group I to the Fourth Assessment Report of the Intergovernmental Panel on Climate change, Cambridge University Press.
Kim, J. H., C. W. Seo, H. S. Kwon, J. E. Ryu and M. J. Kim. 2012. A Study on the Species Distribution Modeling using National Ecosystem Survey Data, Journal
of Environmental Impact Assessment, 21(4), 593-607.
Kong, W. S.. 2000. Geoecology on the Subalpine Vegetation and Landscape of Mt. Sorak, Journal of the Korean Geographical Society, 35(2), 177-187.
Kong, W. S.. 2006. Biogeography of Native Korean Pinaceae, Journal of the Korean Geographical Society, 41(1), 73-93.
Kwak, T. S., J. H. Ki, Y. E. Kim, H. M. Jeon and S. J. Kim. 2008. Study of GIS Prediction Model of Domestic Fruit Cultivation Location Changes by the Global Warming, Journal of the Korean Society for Geo-Spatial Information System, 10(3), 93-106.
Kwon, H. S., C. H. Seo, and J. H. Park. 2012a.
Development of Species Distribution Models and Evaluation of Species Richness in Jirisan region, The Korea Society For Geospatial Information System, 20(3), 11-18.
Kwon, H. S., J. E. Rue, C. H. Seo, J. Y. Kim, J.
H. Tho, M. H. Suh and C. H. Park. 2012b.
Climatic and Environmental Effects on Distribution of Narrow Range Plants, J.
Korean Env. Res. Tech., 15(6), 17-27.
Lee, B. Y., G. H. Nam, J. H. Yun, G. Y. Cho, J.
S. Lee, J. H. Kim and K. H. Oh. 2010.
Biological indicators to monitor responses against climate change in Korea, Korean Journal of Plant Taxonomy, 40(4), 202-207.
Lee, D. G. and J. W. Kim. 2007. Vulnerability Assessment of Sub-Alpine Vegetations by Climate Change in Korea, J. Korean Env.
Res. & Reveg. Tech, 10(6), 110-119.
Parmesan, C. and G. Yohe. 2003. A globally coherent fingerprint of climate change impacts across natural systems, Nature,
421(6918), 37-42.
Pearson, R. G., C. J. Raxworthy, M. Nakamura, A. T. Peterson. 2007. Predicting species distributions from small numbers of occurrence records: a test case using cryptic geckos in Madagascar, Journal of Biogeography, 34(1), 102-117.
Phillips, S. J., R. P. Anderson and R. E. Schapire.
2006. Maximum entropy modeling of species geographic distributions, Ecological modelling, 190(3), 231-259.
Rochefort, R. M., R. L. Little, A. Woodward and D. L. Peterson. 1994. Changes in sub-alpine tree distribution in western North America: a review of climatic and other causal factors, The Holocene, 4(1), 89-100.
Saavedra, F., D. W. Inouye, M. V. Price and J.
Harte. 2003. Changes in flowering and abundance of Delphinium nuttallianum (Ranunculaceae) in response to a subalpine climate warming experiment, Global Change Biology, 9(6), 885-894.
Scott, J. M., P. J. Heglund, M. L. Morrison, J.
B. Haufler, M. G. Raphael, W. A. Wall and F. B. Samson. 2002. Predicting Species Occurrences: Issues of Accuracy and Scale, Island Press, Washington, DC.
Seo, C. H., J. H. Thorn, H. N. Lee and W.
Thuiller. 2009. Scale effects in species distribution models: implications for conservation planning under climate change, Biology Letters, 5(1), 39-43.
Song, W. K. and E. Y. Kim. 2012. A Comparison of Machine Learning Species Distribution Methods for Habitat Analysis of the Korea Water Deer (Hydropotes inermis argyropus), Korean Journal of Remote Sensing, 28(1), 171-180.
Song, J. H., H. I. Lim, K. N. Hong, K. H. Jang and Y. P. Hong. 2012. Genetic Diversity and Spatial Genetic Structure of Dwarf Stone Pine in Daecheongbong Area, Mt.
Seorak, Korean J. Plant Res. 25(4), 407- 415.
Sydes, M. A. and R. Peakall. 1998. Extensive clonality in the endangered shrub Haloragodendron lucasii (Haloragaceae) revealed by allozymes and RAPDs, Molecular Ecology, 7(1), 87-93.
Thuiller, W.. 2003. BIOMOD-optimizing
predictions of species distributions and projecting potential future shifts under global change, Global Change Biology, 9(10), 1353-1362.
Woodward, F. I.. 1987. Climate and plant distribution, Cambridge University Press.
Yoon, J. H., K. Nakao, C. H. Park, B. Y. Lee and K. H. Oh. 2011. Change Prediction for Potential Habitats of Warm-temperate Evergreen Broad-Leaved Trees in Korea by Climate Change, Kor. J. Env. Eco., 25(4), 590-600.