Print ISSN: 2288-4637 / Online ISSN 2288-4645 doi:10.13106/jafeb.2020.vol7.no10.095
1
First Author. Professor, Department of Business Administration, Dong-A University, Republic of Korea. Email: [email protected]
2
Corresponding Author. Professor, Department of Business Administration, Mokwon University, Republic of Korea. [Postal Address: Doanbuk-ro 88, Seo-gu, Deajeon, 34520, Korea]
Email: [email protected]
3
Professor, Department of Business Administration, Seoul Digital University, Republic of Korea. Email: [email protected]
© Copyright: The Author(s)
This is an Open Access article distributed under the terms of the Creative Commons Attribution Non-Commercial License (https://creativecommons.org/licenses/by-nc/4.0/) which permits unrestricted non-commercial use, distribution, and reproduction in any medium, provided the original work is properly cited.
The Effect of Corporate Social Responsibility Activities on Investors’
Heterogeneous Beliefs: A Study of Korea’s Data Set
Hyun-Uk JUNG
1, Tae-Hyoung MUN
2, Young Ei KIM
3Received: July 18, 2020 Revised: August 23, 2020 Accepted: August 28, 2020
Abstract
This study analyzes the effect of corporate social responsibility (CSR) activity on investors’ heterogeneous beliefs. The hypothesis of this study is based on the conflicting effects of CSR activities on firm value and earning’s quality. Investors’ heterogeneous beliefs used in the empirical analysis of this study are trading volume, and CSR activity is measured by the KEJI Index (Korea Economic Justice Institute Index). This study performs an empirical analysis using regression analysis including control variables. CSR activities are found to have a positive relationship with trading volume. This is consistent regardless of the low and high accounting information (earning’s quality).
It can be interpreted that Korea’s CSR activity acts as an incentive to increase investors’ heterogeneous beliefs about target companies.
In other words, it implies that the investor judges CSR activities negatively when evaluating firm value. This study could have a policy implication in that it analyzes how CSR activities affect investors’ decision-making. In other words, this study analyzed CSR activities from the perspective of shareholders. Therefore, this study is expected to provide useful information for policymaking by regulatory agencies. In particular, its contribution is to presents data that CSR activities can be a negative factor in evaluating firm values.
Keywords: CSR Activities, Trading Volume, Investors’ Heterogeneous Beliefs, Firm Value, Earning’s Quality JEL Classification Code: F13, G32, M49
activities are positively related to stock price and management performance. Cheng et al. (2006) report that CSR activities can reduce agent costs. Kim et al. (2012) report that CSR activities enhance the transparency and reliability of net income. These studies show that CSR activity is a positive factor in increasing firm value or decreasing earnings management (Moser & Martin, 2012).
If a company uses limited resources for CSR activities with cost characteristics, it may not be able to make profitable investment decisions (Harrison & Freeman, 1999;
Pava & Krausz, 1996). In this regard, they report that CSR activity has a negative relationship with firm value. Barnea and Rubin (2010) and Harjoto and Jo (2011) report that CSR activities can be used as a means to increase the private benefits of managers in companies with high information asymmetries between shareholders and managers. In particular, Prior et al. (2008) report that managers performing earnings management use CSR to deal with stakeholder activism and vigilance. Therefore, Prior et al. (2008) report that there is a positive relationship between CSR activity and earnings management. This indicates that CSR activity can be a negative factor for firm value and earnings’ quality
1. Introduction
The purpose of this study is to analyze the relationship
between Corporate Social Responsibility (hereinafter
referred to as ‘CSR’) activities and investors’ heterogeneous
beliefs. Specifically, this study aims to empirically analyze
the effect of CSR activities on investors’ heterogeneous
beliefs about target companies. Moskowitz (1972), Waddock
and Graves (1997), and Tsoutsoura (2004) report that CSR
(Brammer & Millington, 2005; Goldreyer & Diltz, 1999;
Orlitzy et al., 2003).
Prior studies related to investors’ heterogeneous beliefs have reported that a high earning’s quality and a low level of information asymmetry reduce an investor’s heterogeneous beliefs for target companies (Ajinkya et al., 1991; Jung &
Moon, 2017; Ziebart, 1990). In addition, prior studies related to investors’ heterogeneous beliefs analyzed the relationship between various firm-specific variables and investors’
heterogeneous beliefs. However, no studies have analyzed the effects of CSR activities on investors’ decision-making.
Therefore, this study analyzes the relationship between CSR activities and investors’ heterogeneous beliefs.
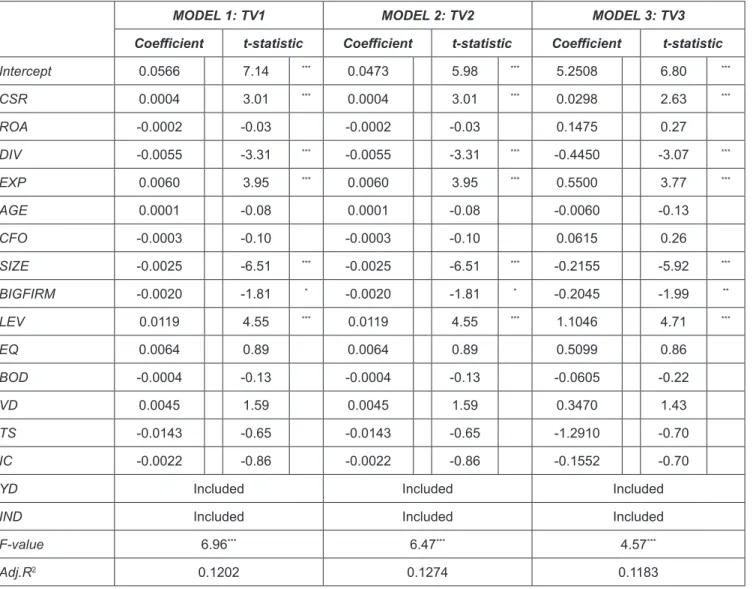
Investors’ heterogeneous beliefs are measured as trading volume. And CSR activity is measured by the KEJI Index (Korea Economic Justice Institute Index). As a result of the analysis, we find that CSR activities have a positive relationship with trading volume. This indicates that high CSR activities in Korea are increasing investors’
heterogeneous beliefs about the target companies. In other words, it implies that investors judge CSR activities as a negative factor in evaluating firm value.
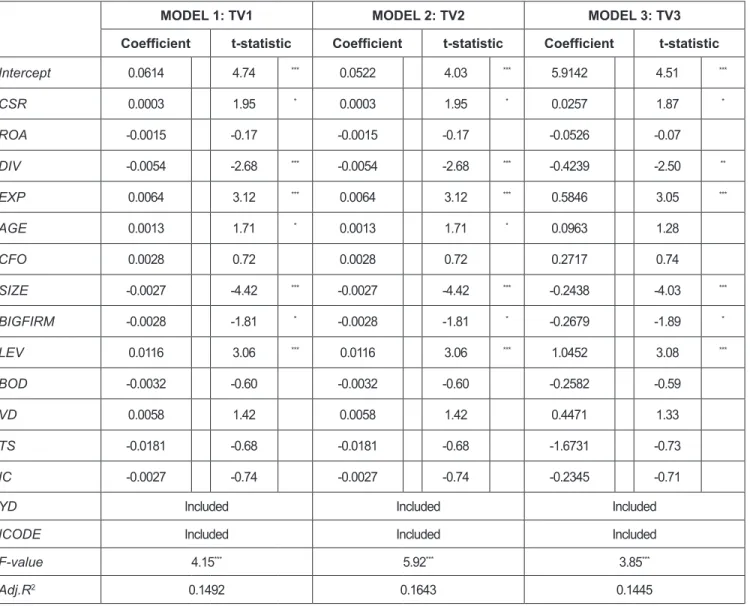
We additionally analyze how CSR activity relates to the trading volume after dividing the sample into a group with- low earnings’ quality and a group with high-earnings’ quality.
As a result of the analysis, we find that CSR activities have a positive relationship with trading volume regardless of the group having low or high earnings’ quality. This suggests that direct investors judge CSR activity as a negative factor for firm value.
This study analyzes the information effect of CSR activities from the perspective of investors. In other words, this study is expected to provide useful information for the establishment of policy by regulators in that it analyzes CSR activities from the perspective of shareholders. This study has a policy implication in that it analyzes how CSR activities affect investors’ decision-making. This study is contributing in that it suggests that CSR activities among negative studies related to CSR activities can be a negative factor in firm value evaluation.
The composition of this study is as follows. In Chapter 2, previous research and research hypothesis is presented. Chapter 3 presents the research model, variable measurement, and sample selection, and Chapter 4 presents the empirical analysis results. Finally, Chapter 5 presents the results of this study.
2. Preliminary Research and Hypothesis Setting
2.1. Research Related to CSR Activities
Moskowitz (1972) begins investigating the relationship between CSR activity and financial performance through
stock price changes, revealing a study that companies with high levels of CSR activity would increase the Dow-Jones Index for six months. Waddock and Graves (1997) analyze the relationship between CSR activities and financial performance using the Time-Lag Model. As a result of the analysis, we find that CSR activities have a positive relationship with financial performance.
Nelling et al. (2009) show a direct relationship between CSR and financial performance, and prove the circular relationship using assets and dividend income and stock price growth. Tsoutsoura (2004) analyzes the relationship between CSR activity and profitability using the Domini 400 Social Index as a proxy for CSR activity. As a result of the analysis, CSR activities are found to have a direct causal relationship with the profitability of the company. Becchetti et al. (2007) report that companies included in the Domini 400 Social Index continue to show abnormal returns after the date of disclosure, but the stock price of companies that fall out of the Domini 400 Social Index decreases. Kim et al. (2012) report that companies with high performance on CSR activities show a low level of earnings adjustment.
In particular, Kim et al. (2012) report that CSR activities enhance the transparency and reliability of net income. In this context, Cheng et al. (2006) report that CSR can reduce agency costs.
Transparency and reliability of net income are factors that lower information risk (Bhattacharya et al., 2012).
Expanding this logic, it is suggested that CSR activities contribute to reducing information asymmetry (Ghoul et al., 2011). Harrison and Freeman (1999) and Pava and Krausz (1996) explain that excessive concentration of CSR activity can negatively affect firm value. They say that CSR activities are undesirable in terms of maximizing shareholder value. Barnea and Rubin (2010) and Harjoto and Jo (2011) report that managers of companies with high information asymmetries between shareholders and managers use CSR activities to increase their private benefits.
Prior et al. (2008) empirically analyze the relationship
between earnings management and CSR activities in 593
firms in 26 countries. As a result of the analysis, it is
reported that CSR activities have a positive relationship
with earnings management. Regarding these results, Prior
et al. (2008) report that managers performing earnings
management use CSR activities to deal with stakeholder
activism and vigilance. However, Chih et al. (2007)
analyze 1,653 corporations in 46 countries and find that
the effect of CSR activities on earnings management
does not provide consistent results for each measure of
earnings management. Summarizing these results, it can
be interpreted that the effect of CSR activities on earning’s
quality or accounting information is not consistent across
countries.
2.2. Setting Factors Affecting Investors’ Heteroge- neous Beliefs (Trading Volume) and Hypotheses Beaver (1968) defines the information effect as the change in expectations that occurs as a result of an event. In this regard, Beaver (1968) explains that information effects can be analyzed through price changes in the stock market and trading volume changes. As prices reflect the expectations of many investors, price changes reflect changes in market expectations, and trading volume changes reflect changes in individual investors’ expectations (Beaver, 1968; Ziebart, 1990). Therefore, Beaver (1968) explains that price changes and trading volume changes can occur in different directions.
According to economics, when new information reaches the market, transactions continue to occur until a new equilibrium price is formed. In economics, if there is a disagreement among investors regarding the intrinsic value of a company, it means that the trading volume increases, but when a consensus on the intrinsic value of a company is formed among investors, the trading volume decreases.
In this context, previous studies related to investors
‘heterogeneous beliefs use the trading volume as a proxy for investors’ heterogeneous beliefs for investment target companies (Ajinkya et al., 1991; Bamber, 1987; Beaver, 1968; Karpoff, 1986; Morse, 1981; Ziebart, 1990). Morse (1981) explains that the trading volume before disclosure is caused by different beliefs in the signals of the disclosure, and this difference in belief is caused by an asymmetric distribution of information. In addition, Morse (1981) explains that the trading volume after disclosure occurs due to differences in interpretations of signals of disclosure.
Heterogeneity of beliefs among investors allows various interpretations of new information provided by companies, and various interpretations by investors result in increasing trading volume (Ajinkya et al., 1991; Bamber, 1987; Karpoff, 1986). This suggests that if the information asymmetry level of the target company is high, the investor’s heterogeneous belief may increase. Ajinkya et al. (1991) analyze the relationship between the trading volume and the variance of analysts’
earnings forecasts by measuring the variance of analysts’
earnings forecasts as a proxy variable representing different levels of belief in a company’s future stock returns (prospects).
As a result of the analysis, the variance of analysts’ earnings forecasts is found to be positively related to trading volume.
Similar results, Ziebart (1990) report that changes in the variance of analysts’ earnings forecasts and revisions in analysts’ earnings forecasts increase changes in abnormal trading volume. These results suggest that heterogeneity in investors’ beliefs can be a decisive factor in trading volume (Ajinkya et al., 1991). Meanwhile, Bhattacharya et al. (2012) explain that high earning’s quality acts as a factor to reduce information asymmetry (information risk). This suggests that high earning’s quality can be a factor in reducing investors’
heterogeneous beliefs. In this regard, Jung and Moon (2017) explain that high matching increases earning’s quality and decreases investors’ heterogeneous beliefs.
Kim et al. (2012) report that CSR activities contribute to enhancing transparency and reliability of net income. This suggests that high CSR activity will act as an incentive to reduce investors’ heterogeneous beliefs. In this case, CSR activity is expected to be negatively related to investors’
heterogeneous beliefs. However, Barnea and Rubin (2010) and Harjoto and Jo (2011) report that managers of companies with high information asymmetries between shareholders and managers use CSR to increase their private benefits.
A high level of information asymmetry can be a requirement for earnings management (Dye, 1988; Trueman & Titman, 1988). And Richardson (2000) suggests that a high level of information asymmetry leads to earnings management.
In this context, Prior et al. (2008) report that there is a positive relationship between CSR and earnings management.
This suggests that CSR activities can act as an incentive to increase investors’ heterogeneous beliefs about target companies. In other words, these results indicate that CSR activity can be positively related to investors’ heterogeneous beliefs. Based on the different results related to CSR activities, the following null hypothesis is established in this study.
Hypothesis: CSR activity is not related to investors’
heterogeneous beliefs.
3. Research Methodology 3.1. Research Model
In this study, to analyze the effect of CSR on investors’
heterogeneous beliefs, a model such as equation (A. 1) is established.
If β
1in Eq. (A. 1) gives a significant positive value, high CSR activity can be interpreted as increasing investors’
heterogeneous beliefs for the target company. However, if β
1provides a significant negative value, high CSR activity can be interpreted as reducing investors’ heterogeneous beliefs about the target company.
We include the following control variables in the model.
Beaver (1968) explains that high profitability is a factor in increasing trading volume. We include ROA to control the effect of profitability on trading volume, and ROA is expected to have a positive relationship with trading volume.
A study verifying the signal effect of dividends explains that
dividends affect stock price (Ambarish et al., 1987; Baker
et al., 1985; Benartzi et al,. 1997; Nissim & Ziv, 2001;). The
stock price is determined by the trading volume. In this case,
dividends are expected to affect the trading volume, and DIV
is included in the model. DIV is expected to have a negative
relationship with the trading volume.
EXP is included in the model to control the effect of the export ratio on the trading volume. If exports account for a high proportion of total sales, information asymmetry is likely to be high. Therefore, EXP is expected to have a positive relationship with trading volume.
AGE is included in the model to control the effect of the history of a company on trading volume. Companies with a long history are expected to have a lot of information known in the capital markets. We expect to have a negative relationship between AGE and trading volume. Jensen (1986) explains that high free cash flows can increase managerial discretion and cause agency problems.
We include CFO in the model to control the effect of operating activity cash flow on the trading volume, and the regression sign of the CFO is expected to be a positive value. Bhushan (1989) reports that the size and the number
of financial analysts (Analyst following) are positively related. This suggests that the information environment can be excellent for large companies. Therefore, we expect that the regression coefficient of SIZE will present a negative value. Becker et al. (1998) report that big six auditors provide higher audit quality than non-big six auditors. Therefore, in this study, BIGFIRM is included in the model to control the effect of audit quality on trading volume.
LEV is included in the model to control the effect of the company’s financial risk on the trading volume, and the regression sign of LEV is expected to present a positive value. We include BOD in the model to control the effect of corporate governance on trading volume, and BOD is expected to have a positive relationship with trading volume.
The quality of accruals is measured as a proxy for earning’s Equation (A. 1)
TV
i,t= β
0+ β
1CSR
i,t+ β
2ROA
i,t+ β
3DIV
i,t+ β
4EXP
i,t+ β
5AGE
i,t+ β
6CFO
i,t+ β
7SIZE
i,t+ β
8BIGFIRM
i,t+ β
9LEV
i,t+ β
10BOD
i,t+ β
11EQ
i,t+ β
12VD
i,t+ β
13TS
i,t+ β
14IC
i,t+ β
15YD
i,t+ β
16IND
i,t+ ε
TV : Trading Volume (TV1, TV2 and TV3)
CSR : KEJI Index (Korea Economic Justice Institute Index)
ROA : Return On Asset (Income Before Income Taxes/Total Assets)
DIV : Cash Dividends (1 if there is a cash dividend or 0 otherwise)
EXP : Export Ratio
AGE : ln (listed months)
CFO : Cash Flow from Operating Activities (cash flow from operating activities at the end of the year (t)/sales during the one (t) year)
SIZE : ln (total assets at the beginning of the year(t)) BIGFIRM : Big-Firm (1 if the auditor is big-firm 4, 0 for others)
LEV : Debt Ratio (total debt at end of the year (t)/total assets at end of the year (t)) BOD : Ratio of Outside Directors (number of outside directors/number of registered
directors)
EQ : Earning’s Quality (quality of accruals (based on Dechow and Dichev (2002) methodology) × (-1)
VD : Voluntary Disclosure Level (total number of voluntary disclosures during the one (t) year/total assets at end of the year (t))
TS : Tax Benefits
IC : Product Market Competition (Huffindal-Hirschman Index (HHI) × (-1))
YD : Year Dummy
IND : Industry Dummy
quality (EQ) and included in the model. We expect earning’s quality (EQ) to have a negative relationship with trading volume. Diamond and Verrecchia (1991) report that stock liquidity increases as the disclosure level increases. In this context, Jung and Moon (2017) report that there is a positive relationship between the amount of information disclosed and the trading volume. We measure the disclosure level of each company as a voluntary disclosure level (VD) to control the effect of the disclosure level of each company on the trading volume.
TS is included in the model to control the effects of corporate tax policies on trading volume. If there are tax benefits, net income will increase. In this case, TS is expected to have a positive relationship with the trading volume.
According to previous studies related to the degree of competition in the product market, it is reported that the competition in the product market acts as a mechanism of external corporate governance and weakens the risks of management (Hart, 1983). Therefore, in this study, IC is included in the model to control the effect of the external governance on trading volume. IC is expected to have a negative relationship with trading volume. And, YD and IND are included in the model to control the year and industry effects.
3.2. Variable Measurement
3.2.1. Proxies of Investors’ Heterogeneous Beliefs
In this study, investors’ heterogeneous beliefs are measured by trading volume. The trading volume is measured as in the following equations (A. 2), (A. 3) and (A. 4) (Bamber, 1987; Beaver, 1968; Jung & Moon, 2017;
Morse, 1981; Ziebart, 1990). First, trading volume1 (TV1) is as shown in equation (A. 2).
Although trading volume1 (TV1) in Equation (A. 2) represents average daily trading volume, it does not indicate whether an individual company’s (i) trading volume on a specific (t) day is a positive or a negative trading volume. In order to solve these limitations, in this study, additional trading volumes are measured as shown in equations (A. 3) and (A. 4).
The trading volume2 (TV2) in Eq. (A. 3) is measured by dividing the difference between the stock trading volume and the market’s trading volume by the number of days the trading volume existed. In this case, if trading volume2 (TV2) is greater than ‘0 (zero)’, it can be interpreted that a positive abnormal trading volume has occurred. Conversely, if trading volume2 (TV2) is less than ‘0 (zero)’, it can be interpreted that a negative abnormal trading volume has occurred.
Equation (A. 2)
, 1 ,
1
i NF= ∑nt= i t × 1
NF
TV V
T
TV1 : Trading Volume1 (Average Daily Trading Volume)
V : Amount of Trading Volume of i Firm for t-day/Number of Stocks of Company (i) as of the t-day
T
NF: The Number of Trading Days for 1-year
Equation (A. 3), (A. 4)
, ,
1
2 ( ) 1
=
= − ×
∑n
i t m t
t NF
TV V V
T
, ,
1 , ,
3 ( /
/
=
=
∑n i t m t
t i t m t
TV V V
V V
TV2 : Trading Volume2
TV3 : Trading Volume3
V
mt: Total Trading Volume in Market for t-day/The Number of Listed Stocks in the Market as of t-day
,
/
,i t m t