1 for Marine Environment and Energy
Vol. 16, No. 1. pp. 1-8, February 2013
FMCW Radar를 이용한 선박 탐지 및 추적 기법 구현
홍단비1,2·양찬수1,2,†
1과학기술연합대학원대학교 해양환경시스템과학과
2한국해양과학기술원 해양위성센터
Algorithm Implementation for Detection and Tracking of Ships Using FMCW Radar
Dan-Bee Hong1,2 and Chan-Su Yang1,2,†
1Department of Marine Environmental System Science, University of Science & Technology
2Korea Ocean Satellite Center, Korea Institute of Ocean Science & Technology
요 약
본 연구에서는 FMCW 레이더를 이용해 수평적인 해상 감시를 위한 선박 탐지 및 추적 기법을 개발하였다. FMCW 레이더는 일반적으로 웜업(warm-up) 시간이 짧고 날씨나 대기상태에 영향을 받지 않으며 가볍고 사용 편의성이 높 기 때문에 해상 감시 분야에서 중요한 역할을 할 수 있다. 본 논문에서는 X-밴드 FMCW 레이더의 데이터 처리 기 법과 선박 탐지 및 추적 알고리듬 구현 결과를 소개한다. 선박 탐지는 원시자료(spoke)에서 합성된 프레임 데이터를 사용하여 육지부분을 제거한 후 형태학적 처리 기법을 이용한 임계치가 적용되었다. 선박의 추적은, 선박의 예상 최 대선속(19 kn)과 프레임간의 시간간격(5 sec)을 고려하여 다음 프레임에서의 선박의 위치를 예상하는 탐색창(search- window)을 사용하였다. 평택항에서 실시된 실험에서 실제 운항중인 다섯 척의 선박이 사용되었으며, 이중 25 m 이 상인 선박의 경우 완벽하게 탐지되었고, 소형 어선의 경우 평균적으로 85.38%의 탐지율을 보였다. 어선의 낮은 탐 지율은 부이 주변을 항해할 때 주로 발생하였으며, 재질이 유리섬유강화플라스틱(FRP)이며 선박 높이가 낮은 것이 원인으로 판단된다. 추적기법에 의한 결과와 선박자동식별장치(Automatic Identification System) 비교를 통해 각 선 박의 추적은 잘 이루어진 것으로 확인되었으며, 추적률은 평균적으로 95.12%이었으며, 길이 25 m 이상 선박의 추 적률은 100%이었다. 향후 소형어선에 대한 탐지와 추적기법 향상을 위한 알고리듬 개선이 요구된다.
Abstract − This study focuses on a ship detection and tracking method using Frequency Modulated Continuous Wave (FMCW) radar used for horizontal surveillance. In general, FMCW radar can play an important role in maritime surveillance, because it has many advantages such as low warm-up time, low power consumption, and its all weather performance. In this paper, we introduce an effective method for data and signal processing of ship’s detecting and tracking using the X-band radar. Ships information was extracted using an image-based processing method such as the land masking and morphological filtering with a threshold for a cycle data merged from raw data (spoke data). After that, ships was tracked using search-window that is ship’s expected rectangle area in the next frame considering expected maximum speed (19 kts) and interval time (5 sec). By using this method, the tracking results for most of the moving object tracking was successful and those results were compared with AIS (Automatic Identification System) for ships position. Therefore, it can be said that the practical application of this detection and tracking method using FMCW radar improve the maritime safety as well as expand the surveillance coverage cost-effectively. Algorithm improvements are required for an enhance- ment of small ship detection and tracking technique in the future.
Keywords: FMCW radar (FMCW 레이더), Ship detection(선박 탐지), Ship tracking(선박 추적), AIS(선 박자동식별장치)
†
Corresponding author: [email protected]
According to the increasing maritime trades and develop- ment of marine transportation, marine surveillance must come into action for prevention of accident and guarantee of safety and security sailing. As a part of surveillance, tracking system may integrate with heterogeneous data in order to overcome the limitations of each sensor. In the maritime domain, sensor assets may include Automatic Identification System (AIS) tracks, contacts from coastal radar, video, IR, and Synthetic Aperture Radar (SAR) (Guerriero et al. [2008]). In the coastal water, sat- ellite and radar are mostly used for object detection and track- ing (EMSA [2011]). But each of the equipment has limited performance. In case of SAR, it covers a large area with fine spatial resolution under all weather conditions (Chaturvedi et al.
[2012]) but limited temporal coverage, while radar has a limited spatial coverage, resolution decrease according to the distance and long warm-up time. Therefore, if we use both satellite and radar to marine surveillance, it will be useful for real time mon- itoring of the wide ocean. In this study, we obtain information of targets position and track before integrating satellite and radar data. FMCW radar has a wide variety advantage: simple solid-state transmitters, resistance to interception, good range resolution (Stove [1992]). It can improve maritime safety and security as well as possibility to expand compacter surveillance coverage system from cost-cutting. There are many types of ship-mounted FMCW radar for smaller ships and ship detec- tion algorithm has been developed.
Currently, object detection and tracking technology in a complex environment has been studied: e.g. human, aircraft and ship tracking for surveillance, medical image processing, hand, face and eye tracking for human-computer interaction etc. (Yang [2008]). There are many studies that developed detection and tracking algorithm using radar for maritime sur- veillance system. Mecocci et al. [1995] studied a new experi- mental an automatic target recognition (ATR) system for ship traffic control in the access area of a sea-port using real aper- ture X-band radar. Each of targets is extracted from three steps that are segmentation, contour extraction, and feature extrac- tion and then tracked. Lee [2008] used ARPA radar for consol- idation of AIS and radar positions by comparing the AIS and radar information for the tracked ship targets using PC-based ECDIS in Korea. Khan et al. [1994] showed Doppler process- ing for the horizon detection and tracking of a variety of tar- gets including vessels, aircraft, and icebergs using shore-based ground real time frequency modulated interrupted continuous
tem stays on the level of individual development and depends on overseas. For this reason, this study focuses on algorithm design using FMCW radar for the horizon detection and track- ing of ships. It is intended to develop easy and effective ships detection and tracking algorithm using X-band FMCW radar.
The ships are detection through the image processing and detected ships are tracked by easy and effective methods using search- window.
In section 2, experimental design such as site and radar spec- ification, and conversion method from data to an image are described. In section 3, object detection and tracking algorithm is introduced. Section 4 shows the experimental detection and tracking results using the proposed algorithm. The tracked results of ships which equipped AIS are compared with AIS informa- tion. Through the comparison, the detection and tracking rates are calculated. Finally, conclusions are presented in section 5.
2. DATA ACQUISITION 2.1 Experiment Design
To detecting and tracking ships, system was installed with main equipment which is radar and AIS. Figure 1 shows con- figuration of image acquisition system. The radar provides raw data (spoke data) containing the sampling of a particular angle.
It contains all the information for reconstructing the exact posi- tion where data were sampled. Also we obtained ship’s posi- tion information using AIS.
The generator provides power (12V) to radar interface box, AIS receiver, heading sensor and SimNet converter. Then the device is working and sending information into PC simulta- neously. In proposed system, image sequences formed by marine radar (Broadband 3G radar) whose main characteristics are summarized in Table 1.
We installed FMCW radar and AIS in the Pyeong-Taek port where is suitable to monitor incoming and outgoing ships (36.9764°N, 126.7788°E) as shown in Figure 2. Environment of the exper- iment are summarized in Table 2. The wind blew slightly and wave was calm. Radar range was configured as 3/4 nm (
≒1,389 m)
but the actual measured distances of radar is 2,496 m. So we use actual measured distance for exact distance data. When we set this range, radar covers the ship’s route because the distance that between radar and opposite land is 2,252 m. Rotation was 24 rpm but interval of image is 5 sec because it creates an image by twice rotation of radar antenna.Ship’s dimensions which have been observed during the
Fig. 1. Configuration of image acquisition system using FMCW radar and AIS. The raw data (spoke data) from radar can be delivered to PC through radar interface box. Ship’s position information can be obtained through the AIS receiver.
Table 1. Main characteristics of the FMCW radar
Power consumption (with 10 m cable) Operating: 18 W Standby: 2 W
DC input 9 V to 32.1Vdc
Transmitter source (pre-heating time) No magnetron
Range 50 m to 24 nm
Rotation 24/36 rpm
Sweep time 1.3 ms +/- 10%
Sweep bandwidth 75MHz max
Horizontal beam width 5.2° +/-10% (-3dB width) Vertical beam width 25° +/-10% (-3dB width)
Fig. 2. Research area and installation site (36.9764°N, 126.7788°E). The Port of Pyeong-Taek is closest to the east China in Korean ports.
Pyeong-Taek port is suitable to monitor incoming and outgoing ships.
Table 2. Experimental conditions
Temperature 1.6 °C
Water temperature 1.5 °C
Wind speed 4.3 m/s
Wave height (average) 0.1 m
Radar system
Range (set/measured) 1,389/2,469 [m]
Rotation 24 rpm
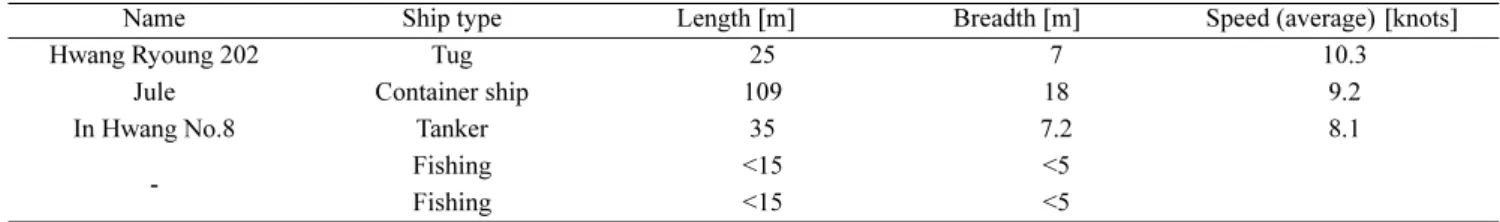
experiment time are summarized in Table 3. These were result of the experiment during ten minutes from 10:05 to 10:15. The five ships were detected, three ships of total ships are equipped AIS and the rest two ships are fishing ships. Therefore, AIS equipped ships are able to get information of ships name, type and dimensions. The three ships which equipped AIS (Hwang Ryong 202, Jule, and In Hwang No.8) are tracked and then they are compared with position information of AIS. In gen- eral, fishing boat length is less than 15 m, breadth is less than 5 m, and material is Fiber Reinforced Plastics (FRP).
2.2 Spoke Data Processing
A radar image is composed of spokes (radar image data) in Figure 1. That is ordered by increasing azimuth in a clockwise direction (Corda and Bell [2009]). When the FMCW antenna rotates, 4096 data were saved as spokes. 1 spoke has 512 sam- ple data (8 byte×512=4096 byte). Each of target strength nor- mally varies in the range 0-128. The azimuth value “0” means a radar direction that was corrected heading north with consid- eration of spokes compass value. Each of samples is calculated to making image data using their information such as radar range, degree and order. All of the degree convert to radian value and then it transforms in to matrix that was arranged 2048×2048.
As a result, when spoke were changed to 4096 matrix image,
one pixel of image data of the radar was changed from 8bit to 4bit.
3. METHODS
Our approach is to estimate the motion of target. In order to do so, we should select the target under the irregularly appeared errors unlike video camera that extracts moving objects from the fixed background. The most important thing in this algo- rithm is self-identification between the targets and errors before tracking the targets. First, targets are extracted through the image filtering. Image filtering process was focused to eliminate the device noise in order to distinguish the ships. A noise was removed using morphology and difference image that is con- gruent with that used for image filtering processing. And then the selected target will be tracked through the proposed methods.
3.1. Image Filtering for Detection
Target can be extracted after filtering and noise suppression process of the received radar image. In radar image, no signal that corresponds to sample value of 0 appears as dark area, while object and noise is bright region (Figure 3). Image received from the radar has useless noise information. Thus, irregular noise of image data should be removed because it
Name Ship type Length [m] Breadth [m] Speed (average) [knots]
Hwang Ryoung 202 Tug 25 7 10.3
Jule Container ship 109 18 9.2
In Hwang No.8 Tanker 35 7.2 8.1
- Fishing <15 <5
Fishing <15 <5
Fig. 3. Sample of the filtering steps: (a) initial image of 3th frame at 10:05, (b) separation of ocean and land, (c)~(e) morphology processing,
(f) axis & area filtering, (g) difference image.
affects to the result in the processing steps.
Figure 3 shows the steps of image filtering to remove the noise. First of all, we can remove the land area. It is possible to know with the naked eye where the land is, because we already have information about experiment area. And then ocean part is marked by creating the boundaries of the ocean and land (b).
Second, the objects region and holes are filled (c). In this pro- cess, only values over the threshold are extracted and fill the voids between extracted values. Third, morphological transfor- mations such as dilating and eroding are used for noise reduc- tion, component combined or separation (d)~(e). Both long axis is much longer than short axis and small area are filtered for eliminate the errors caused in the morphology processing (f).
And then finally, only duplicated objects are extracted by com- pare to next image. This process plays an important role to delete mechanical error.
Once a ship is detected, all of position information in pixel are converted to a geographic coordinate. The center point of all the values is calculated after converted into the coordinate.
That calculated value is used for tracking ships.
3.2. Tracking Methods
For estimate the motion between two consecutive frames, search-window algorithm was used. Tracking method was devel- oped and Figure 4 shows the example. This simple algorithm has an advantage of being easy implementation. And it is good at real-time tracking because it does not need a large amount of computation. In this experiment, the interval time is very short
as 5 seconds, so this simple method is possible to use to track.
It estimates the motion by creating a search-window that is ship’s expected rectangle area in the next frame. The r1 and r2 are 1.5 times of the value that was calculated considering expected maximum speed (19 kts) and interval time (5 sec) in experi- ment area. The frame in the time tn configures the search-win- dow and the target in next frame at tn+1 are compared. If the target which at tn+1 exists in search-window which made at tn, that recognized such as the same target at tn.
In the first frame, tracking begins after all of center points
Fig. 4. The example of a search-window tracking. The goal here is to find the same target on the next frame (t
n+1) as the target on the current frame (t
n). We define a search-window size as r1 and r2 from a center of target in the current frame. The target which is entering a search-win- dow in the next frame is recognized as the matched target.
Fig. 5. The display of tracking performance results. Buoys were drawn as a triangle symbol. White dots and 5 different circles represent the detected
and tracked ships for each target, respectively. This data was collected for a ten-minute from 10:05:00 to 10:15:55 on February 14, 2012.
the radar range, tracking is impossible. Therefore, it should be considered about ships as an instance. In case of this radar sys- tem, a ship cannot suddenly appear in the inside of radar net- work. A ship was detected newly around the maximum radar range. In this way, the tracking method for the new ship was applied automatically. When this tracking method applied to the ship when it moves at a constant speed with a directional, tar- gets are simply tracked.
4. RESULTS
The following section details results of horizontal radar image detection and tracks. First of all, the ships and buoys were detected and tracked during the ten-minutes using the proposed algorithm.
Figure 5 shows the display of tracking performance results. In this figure, ships and buoys which shown as a white dot obtained through the detection algorithm. The five different cir- cles represent the tracked ships for each target and all of ships tracked.
To validate result of the ship tracking, trajectory of ships was compared with position information of AIS data as shown in Figure 6. There are three ships (Hwang Ryong 202, Jule, and In Hwang No.8) which equipped AIS during the experiment time.
Each of ships displayed by the square symbols while position information of AIS displayed by solid line. AIS operation time was ten-minute (10:05-10:15) and solid line is a trajectory. The data of Hwang Ryong 202, Jule, and In Hwang No.8 were obtained during 6 minute and 35 seconds (81 frames), 30 seconds (30 frames), and 4 minute and 40 seconds (56 frames) respectively.
The reason of the difference between AIS and tracking results is that a position of tracked ship represents the ship centroid, while AIS means the AIS position. Information represent the center of ships, while AIS position information do not shows the center of ships.
Table 4 shows detection and tracking rate which are calcu- lated after making sure tracking results was stable. The frame number was defined as the number of frames that each ship exists.
The detection rate was defined as the number of appeared objects over the total number of frames. And the tracking rate was defined as the number of tracked objects over the number of detected objects. In case of Hwang Ryong 202, Jule, and In Hwang No.8 were detected and tracked perfectly. These three ships are large vessels which equipped AIS, and they never overlap each other, so it was easier to use this algorithm. Ship 3 and 4 are small fishing boat. In case of ship 3, initial tracking
(~77th frame) was very well but failed nearing the light-house because it did not separated between ship and light-house. So the detection rate was 73.84% and the tracking rate was
Fig. 6. Comparison of AIS data and trajectory of ships which equipped
AIS. Solid line and square represent the ship’s trajectory of AIS and
tracking result, respectively. Hwang Ryong 202 is obtained during 6 minute
and 35 seconds (81 frames), Jule for 2 minute and 30 seconds (30 frames),
and In Hwang No.8 for 4 minute and 40 seconds (56 frames).
80.20%. The low detection rate for fishing vessels mainly occurred when the ships are close to a mooring buoy. Other reasons are that the ship is made of FRP and its height is low.
In case of ship 4, each of rates is 96.92%, 95.38%. Light-house and buoys are also detected. But the nature of this radar, buoy behind the other buoy detection rate was lower because fore- most buoy impede a transmission of radio waves. So the detec- tion rate of behind buoy (buoy 1) is low. However all of ships tracked very accurately. It can be seen that the fishing boat can also be tracked very well, except separation between boat and light-house.
5. CONCLUSIONS
We presented target detection and tracking algorithm applied to FMCW radar image. This simple algorithm is developed for image filtering and tracking. The objects are extracted through clearing the error using proposed filtering algorithm. This algo- rithm can efficiently extract objects. The moving objects are first identified on the first frame. For estimate the motion between two consecutive frames, search-window algorithm was used. If the target at the next frame exists in the search-window, the tar- get are recognized such as the same target with previous target.
To validate the ship tracking algorithm, trajectory of ships was compared with position information of AIS data.
The proposed detection and tracking algorithm can be pro- cessed simply and quickly. Our tracking method is most useful when the targets do not overlap each other. AIS and tracking results are slightly different. Because AIS means the AIS posi- tion, while tracked ship represents the ship centroid. So posi- tion of ships is not perfect but all of ships tracked. So it can be usefully applied in other research areas.
ACKNOWLEDGMENTS
This work was supported in part by a grant from the Project
“Development of Korea Operational Oceanographic System (PM57041)” funded by the Ministry of Land, Transport and Mari-
time Affairs of Korean Government and the Research Projects (PE98911, PG47770 and PNS184C) of the Korea Institute Ocean Science and Technology.
REFERENCES