1.5T MR 기기를 이용한 확산강조영상에서 b Value의 증가에 따른 요추압박골절 환자의 신호대 잡음비와 현성 확산 계수의 변화
*순천향대학교 부천병원 영상의학과, †한림성심대학 방사선과, ‡강릉아산병원 응급센터
조재환*ㆍ박철수†ㆍ이선엽†ㆍ김보희‡
요추 압박 골절이 있는 환자를 대상으로 1.5 T MR 기기에서 b value의 변화를 이용한 확산강조영상에서 압박 골절이 있 는 요추의 신호대 잡음비와 현성 확산 계수가 어떤 변화를 나타내는지 알아보고자 하였다. 2008년 1월부터 2009년 11월 까지 요추 MRI를 촬영한 환자 중에서 만성 골다공증으로 척추 압박 골절을 보였던 환자 30명을 대상으로 1.5T MR scanner를 이용하여 b value를 400, 600, 800, 1000, 1200 s/mm2으로 점차 증가시켜가면서 확산강조영상을 각각 획득하였 다. 각각의 b value로 획득한 확산강조영상에서 1∼5번의 요추체중 척추 압박 골절이 있는 부위와 골절이 있는 부위의 위, 아래 추간판등 세 부위에서 신호대 잡음비를 측정하였고 각각의 b value로 획득한 ADC map 영상에서는 세 부위의 신호대 잡음비와 현성 확산 계수를 측정 하였다. 정량적 분석방법으로 b value 400 s/mm2으로 획득한 확산강조영상과 ADC map영상을 기준으로 각각의 b value로 획득한 영상과 비교하였다. 정성적인 분석방법은 b value 400 s/mm2 확산강 조영상과 ADC map영상의 1∼5번의 요추체중 척추 압박 골절이 있는 부위의의 신호강도를 분석하여 이를 기준으로 각 각의 b value를 증가시켰을 때의 확산강조영상과 ADC map영상에서 신호강도가 상대적으로 어떻게 변화하는지 알아보 았다. 영상의 정량적 분석에서는 확산강조영상에서 b value가 증가함에 따라 척추 압박 골절이 있는 부위와 골절이 있는 부위의 위, 아래 추간판등 세 부위 모두 신호대 잡음비가 상대적으로 감소했다. ADC map영상에서는 b value가 증가함에 따라 척추 압박 골절이 있는 부위와 골절이 있는 부위의 위, 아래 추간판등 세 부위 모두 신호대 잡음비가 상대적으로 감소했다. ADC map영상에서 b value에 따른 관심영역의 현성 확산 계수는 b value가 증가함에 따라 척추 압박 골절이 있는 부위와 골절이 있는 부위의 위, 아래 추간판등 세 부위 모두 현성 확산 계수가 상대적으로 감소했다. 영상의 정성 적 분석에서 b value를 400 s/mm2 이상으로 증가시킴에 따라 척추 압박 골절이 있는 부위와 골절이 있는 부위의 위, 아 래 추간판등 세 부위 모두 신호강도가 점차 감소하였고 b value를 1,000 s/mm2 이상으로 했을 때에는 세 부위 모두 영상 의 잡음이 매우 심했다. 또한 척추 압박 골절이 있는 부위는 상대적으로 위, 아래 추간판 보다 높은 신호강도를 보였다.
확산강조영상에서 b value를 증가시킴에 따라 척추 압박 골절이 있는 부위와 골절이 있는 부위의 위, 아래 추간판 등 세 부위 모두 신호대 잡음비와 현성확산계수가 점차 감소하는 결과를 얻었고 향후 확산강조영상 검사 시 Multi b value를 사용하여 신호의 변화를 인지함으로서 여러 가지 척추질환으로의 적용에 도움을 줄 것이라 사료된다.
중심단어: 확산강조영상, 척추 압박 골절, b value, 신호대 잡음비, 현성확산계수
이 논문은 2010년 1월 3일 접수하여 2010년 1월 15일 채택되었음.
책임저자:박철수, (200-711) 강원도 춘천시 동면 장학리 790번지 한림성심대학 방사선과
Tel: 033)240-9350, Fax: 033)240-9354 E-mail: [email protected]
서 론
척추 골절은 골다공증 환자에서 가장 흔히 발생하는 골 절로 미국의 경우 여성의 40%, 남성의 13%에서 발생한다 고 한다.1,2) 척추 골절은 연령 증가에 따라 발병률이 증가하
여 50세 여성의 경우 5%, 85세 여성의 경우 50%에 달한 다.3) 척추 골절 환자에서 통증을 동반하는 경우가 약 50%
이고, 실제 임상적으로 진단되는 경우는 33%에 불과하며 나머지는 우연히 발견된다고 한다.4) 그러나 척추 골절은 급성 및 만성 통증 척추 후만증(kyphosis), 신장 감소, 기능 적 장애 등을 초래하며 골절 후 사망률이 증가 한다는 보 고도 있다.4-6) 척추 골절이 발생하게 되면 다른 부위의 척 추 골절이 3년 이내에 발생할 확률이 증가되어 척추 골절 의 과거력은 그 자체가 새로운 골절 발생의 위험요인으로 알려져 있다.7) 따라서 골다공증에 따른 척추 골절은 조기 진단과 치료가 중요하다. 한편 골다공증 환자에서 척추 통
Fig. 1. An MR image for a patient with vertebral compression fracture due to osteoporosis. The study was conducted on a sample of 30 patients with chronic pathologies of compression fractures due to oste- oporosis who underwent vertebral MRI and their mean age was 65.3.
(a) Sagital T2 weighted image, (b) Sagital T1 weighted image.
증은 골절 외에도 다양한 원인에 의해서 발생하며 척추 골 절이 있는 경우에도 골절이 통증의 단독 원인인 경우보다 는 다른 원인 질환과 동반된 경우가 더 많기 때문에 골절 뿐 아니라 동반된 질환을 정확히 진단하여 치료하는 것이 중요하다.8) 척추 골절의 진단에는 단순 골 사진이 주로 이 용되는데 중등도 이상의 척추 골절 환자에서도 진단율이 50% 정도에 불과할 뿐 아니라9) 골절이 진단되더라도 임상 증상과의 연관성이 낮다고 알려져 있다.10)
자기공명영상(MRI)은 골다공증의 합병증으로 나타나는 척추압박 골절이나 부전골절(insufficiency fracture) 등의 진 단에 있어 MRI는 이들을 민감하게 발견할 수 있다고 보고 되고 있다.11) 자기공명영상 기법 중 확산강조영상(diffusion weighted image)은 세포 내외 공간에서 수분의 이동을 영상 화하는 기법으로 골격근 손상이 있을 때 근육의 신호 강도 변화를 조기에 모두 알 수 있었으며 특히 상대적으로 미약 한 손상을 받은 경우 T2강조영상 보다 유의하게 민감하였 고12) 양성과 악성 척추 압박 골절의 감별 진단에 유용 하다 고 보고되고 있다.13) 확산강조영상을 얻기 위해서는 보통 영상을 얻기 위해 필수적으로 사용하는 경사자장 외에 매 우 강한 한 쌍의 경사자장, 즉 확산강조 경사자장을 추가로 사용한다. 확산강조 경사자장의 강도와 시간을 적분한 것 을 경사계수(gradient factor) 또는 b value라 하며, 경사계수 가 클수록 확산이 강조된 영상을 얻을 수 있고14) 이런 수분 의 확산 정도를 수치로 나타낸 것이 현성 확산계수(apparent diffusion coefficient; ADC)라 한다.15)
척추 검사 시 확산강조영상에서 사용하는 확산강조 경사 자장의 세기정도인 b value는 현재까지 400 s/mm2으로 널 리 사용되고 있다. 그러나 저자가 조사한바 척추 검사의 확
산강조영상에서 b Value의 변화에 따른 확산강조영상에 대 한 연구보고는 없었고, 또한 척추 압박골절 환자를 대상으 로 일반적으로 시행되는 확산 강조 영상에서도 b value의 변화에 따른 척추압박골절 환자의 확산강조영상에 대한 연 구보고도 없었다. 이에 저자는 요추 압박 골절이 있는 환자 를 대상으로 1.5 T MR 기기에서 b value의 변화를 이용한 확산강조영상에서 압박 골절이 있는 요추의 신호대 잡음비 와 현성 확산 계수가 어떤 변화를 나타내는지 알아보고자 하였다.
대상 및 방법
1. 연구 대상
2008년 1월부터 2009년 11월까지 요추 MRI를 촬영한 환 자 중에서 골다공증에 의해 만성으로 척추에 압박 골절을 보였던 환자 30명을 대상으로 하였으며, 환자 병력상 추락 이나 사고 등 분명한 외상의 병력이 있는 경우, 또한 원발 성 및 전이성 골 종양에 의한 병적 골절(pathologic fracture) 이 있는 경우는 조사 대상에서 제외하였다. 대상 환자의 연 령은 50에서 82세(평균65.3세)이었다(Fig. 1).
2. 데이터 획득
MR영상의 획득은 1.5T MR scanner (Signa 1.5T HDx. GE Healthcare. Milwaukee. WI)와 HD T/R 8ch spine array coil (In vivo Corp. Gainesville. FL)을 이용하였다.
확산강조영상을 시행하기 전 척추 압박 골절 정도를 관 찰하기 위하여 fast spin-echo (FSE) 영상법을 이용하여 T2 강조 영상(TR=3500 sec, TE=100 msec, NEX=2)과 T1강조
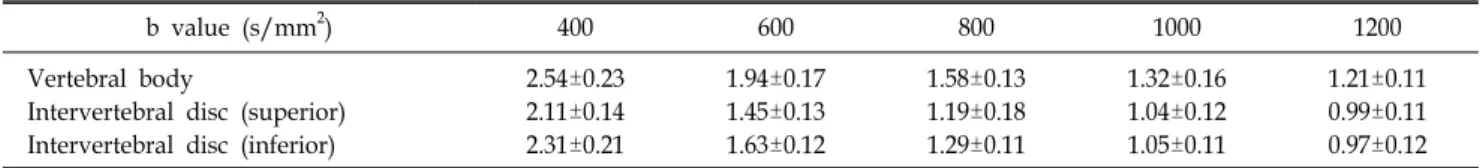
Table 1. The signal-to-noise ratio (SNR) at concerned portions at different b values on diffusion-weighted MR images.
b value (s/mm2) 400 600 800 1000 1200
Vertebral body
Intervertebral disc (superior) Intervertebral disc (inferior)
2.54±0.23 2.11±0.14 2.31±0.21
1.94±0.17 1.45±0.13 1.63±0.12
1.58±0.13 1.19±0.18 1.29±0.11
1.32±0.16 1.04±0.12 1.05±0.11
1.21±0.11 0.99±0.11 0.97±0.12 Notes: Numbers are expressed as mean±standard deviation. Vertebral body: a portion where vertebral compression fractures has occurred. Intervertebral disc (superior): the upper disc of a portion where vertebral compression fractures are localized.
Intervertebral disc (inferior): the lower disc of a portion where vertebral compression fractures are localized. The quantitative analysis found that for diffusion-weighted MR images, as the b values increased, the S/N ratios were relatively lowered at all the three sites, compared to the base b value (400 s/mm2)(p<0.05).
Fig. 2. ROI set of diffusion weighted image and ADC map image. (A) A portion where vertebral compression fractures has occurred. (B) The upper disc of a portion where vertebral compression fractures are localized. (C) The lower disc of a portion where vertebral compression fractures are localized. For diffusion- weighted MR images with each different b value obtained, the signal intensity was assessed at three sites: the site of compression fracture of L-spine vertebral body at L1 to L5, and both the upper and lower intervertebral discs of the said fracture site, while for ADC map images with each different b value obtained, the signal intensity and ADC were respectively measured at those three sites. (a) Diffusion weighted image, (b) ADC map image.
영상(TR=600 sec, TE=10 msec, NEX=2)인 시상면(Sagittal plane)영상과 축상면(Axial plane)영상을 각각 획득하였다.
확산강조영상은 b value를 400, 600, 800, 1,000, 1,200 s/mm2으로 점차 증가시켜가면서 spin-echo EPI 기법을 이용 하여 3쌍의 확산 강조 시상면 영상을 획득 하였으며 영상 변수는 다음과 같다.
TR (time of repetition): 6,000 ms, TE (time of echo): 60 ms, Matrix: 128×192, NEX (average): 4, Slice thickness: 4.5
mm, FOV (field of view): 280 mm, Scan Time: 1:42 ms 획득한 확산강조영상은 Advantage Workstation (Ver 4.3, Revision 4. GE healthcare. Milwaukee. WI)으로 보내져 ADC (apparent diffusion coefficient)map영상을 획득하였다. 각각 의 b value로 획득한 확산강조영상에서 1∼5번의 요추체 (L-spine vertebral body)중 척추 압박 골절이 있는 부위와 골 절이 있는 부위의 위, 아래 추간판(intervertebral disc)등 세 부위에서 신호 강도(signal intensity)측정을 하였고 각각의 b value로 획득한 ADC map 영상에서는 세 부위의 신호 강도 와 현성 확산 계수를 측정 하였다. 이때 관심영역(ROI)은 측정하고자 하는 해부학적 구조물을 최대한 많이 포함하도 록 하였다(Fig. 2).
실험에 대한 정량적 분석방법으로 관심영역의 신호대 잡 음비(signal to noise ratio)와 현성 확산 계수(apparent dif- fusion coefficient; ADC)를 구하고 평균화 하여 b value 400 s/mm2으로 획득한 확산 강조 영상과 ADC map영상을 기준 으로 각각의 b value로 획득한 영상과 비교하였다. 신호대 잡음비는 1∼5번의 요추체중 척추 압박 골절이 있는 부위 와 골절이 있는 부위의 위, 아래 추간판등 세 부위에서의 신호 강도 값을 백그라운드 표준편차(background standard deviation)의 신호강도 값으로 나누어 계산하였다. 백그라운 드 표준편차는 신호대 잡음비 효과를 정확하게 하기 위하 여 좌상단과 우하단 두 곳에서 측정하여 평균값과 표준 편 차로 나타냈다.
이 실험에 적용된 신호대 잡음비(Signal to noise ratio)를 구하는 식은 다음과 같다.
여기서, SDN: The standard deviation of noise in back-
Table 2. Relative signal-to-noise ratios (SNR) in three ana- tomic regions at varying high b values (normalized to SNR at b=400 s/mm2, diffusion-weighted images).
b value (s/mm2) 400 600 800 1,000 1,200 vertebral body
intervertebral disc (superior) intervertebral disc (inferior)
1 1 1
0.76 0.71 0.70
0.62 0.68 0.55
0.51 0.56 0.45
0.47 0.47 0.41 Notes: The average SNR at each different b value when considering the signal-to-noise ratio with the b value being 400 s/mm2 as one (1) on the diffusion-weighted MR images.
Vertebral body: a portion where vertebral compression fractures has occurred. intervertebral disc (superior): the upper disc of a portion where vertebral compression fractures are localized.
Intervertebral disc (inferior): the lower disc of a portion where Vertebral compression fractures are localized. The corresponding average values of the S/N ratio at each different b value when considering the signal-to-noise ratio with the b value being 400 s/mm2 as 1, were found to be 0.76, 0.62, 0.51, and 0.47, showing a gradual decrease, at the site of vertebral compression fracture. For the upper disc of the said site, the corresponding figures were 0.71, 0.68, 0.56, and 0.47, showing a gradual decrease, while for the lower disc of the said site, they were 0.70, 0.55, 0.45, and 0.41.
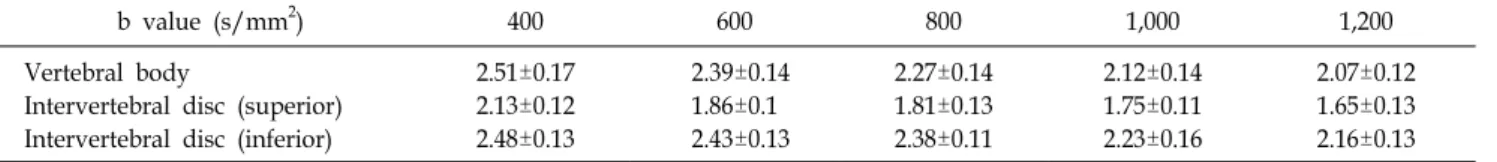
Table 3. The signal-to-noise ratio (SNR) at concerned portions at different b values on apparent diffusion coefficient (ADC) map images.
b value (s/mm2) 400 600 800 1,000 1,200
Vertebral body
Intervertebral disc (superior) Intervertebral disc (inferior)
2.51±0.17 2.13±0.12 2.48±0.13
2.39±0.14 1.86±0.1 2.43±0.13
2.27±0.14 1.81±0.13 2.38±0.11
2.12±0.14 1.75±0.11 2.23±0.16
2.07±0.12 1.65±0.13 2.16±0.13 Notes: Numbers are expressed as mean± standard deviation. Vertebral body: a portion where vertebral compression fractures has occurred. Intervertebral disc (superior): the upper disc of a portion where vertebral compression fractures are localized.
Intervertebral disc (inferior): the lower disc of a portion where vertebral compression fractures are localized. The quantitative analysis found that for ADC map images, as the b values increased, the S/N ratios were relatively lowered at all the three sites, compared to the base b value (400 s/mm2)(p<0.05).
Fig. 3. The variation in signal intensity at the vertebral com- pression fracture site according to the varying b values on diffusion weighted images. Findings showed that with the b value being increased, the signal-to-noise ratio gradually decreased at all the sites of the lumbar vertebral compression fracture and both the upper and lower discs of the fracture site.
ground
SI: signal intensity
각각의 b value로 획득한 신호대 잡음비와 현성 확산 계 수의 평균값 차이는 ANOVA 검증(ANOVA, SPSS win 12.0) 을 이용하였고, 좀 더 정확한 차이를 알기 위하여 사후검증 (post-hoc analysis)을 하였다(p<0.05).
정성적인 분석방법은 2명의 방사선와 1명의 전문의가 육 안적으로 먼저 b value 400 s/mm2 확산강조영상과 ADC map영상의 1∼5번의 요추체중 척추 압박 골절이 있는 부 위의의 신호강도를 분석하여 이를 기준으로 400∼1,200 s/mm2까지 b value를 증가시켰을 때의 확산 강조 영상과 ADC map영상에서 신호강도가 상대적으로 어떻게 변화하 는지 알아보았다.
결 과
영상의 정량적 분석에서는 확산 강조 영상에서 b value에 따른 관심영역의 신호대 잡음비는 Table 1과 같이 b value 가 증가함에 따라 척추 압박 골절이 있는 부위와 골절이 있는 부위의 위, 아래 추간판등 세 부위 모두 신호대 잡음 비가 상대적으로 감소했다(p<0.05)(Fig. 3).
b value가 400 s/mm2일 때의 신호대 잡음비를 1로 하였을 때, 각각의 b value 600, 800, 1,000, 1,200 s/mm2에서의 평균 신호대 잡음비는 척추 압박 골절이 있는 부위에서는 0.76,
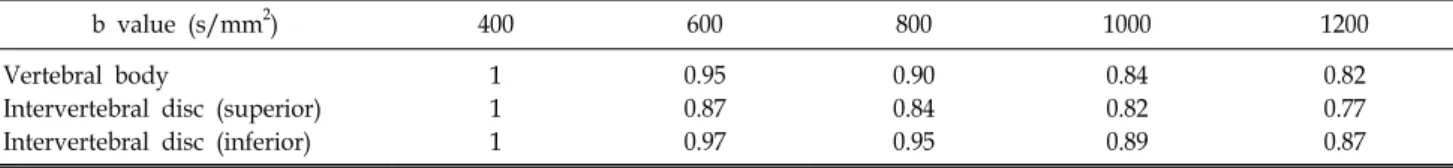
Table 4. Relative signal-to-noise ratios (SNR) in three anatomic regions at varying high b values (normalized to SNR at b=400 s/mm2, ADC map images).
b value (s/mm2) 400 600 800 1000 1200
Vertebral body
Intervertebral disc (superior) Intervertebral disc (inferior)
1 1 1
0.95 0.87 0.97
0.90 0.84 0.95
0.84 0.82 0.89
0.82 0.77 0.87 Notes: The average SNR at each different b value when considering the signal-to-noise ratio with the b value being 400 s/mm2 as one (1) on the diffusion-weighted MR images. Vertebral body: a portion where vertebral compression fractures has occurred.
Intervertebral disc (superior): the upper disc of a portion where vertebral compression fractures are localized. Intervertebral disc (inferior): the lower disc of a portion where vertebral compression fractures are localized. The corresponding average values of the S/N ratio at each different b value when considering the signal-to-noise ratio with the b value being 400 s/mm2 as 1, were found to be 0.95, 0.90, 0.84, and 0.82, showing a gradual decrease, at the site of vertebral compression fracture. For the upper disc of the said site, the corresponding figures were 0.87, 0.84, 0.82, and 0.77, showing a gradual decrease, while for the lower disc of the said site, they were 0.97, 0.95, 0.89, and 0.87.
Table 5. The apparent diffusion coefficient (ADC) value at concerned portions for different b values on ADC map images.
b value (s/mm2) 400 600 800 1,000 1,200
Vertebral body
Intervertebral disc (superior) Intervertebral disc (inferior)
0.170±0.033 0.168±0.039 0.181±0.048
0.150±0.035 0.152±0.036 0.170±0.048
0.131±0.023 0.133±0.034 0.160±0.038
0.115±0.020 0.116±0.032 0.135±0.042
0.102±0.016 0.956±0.029 0.112±0.037 Notes: Numbers are expressed as mean± standard deviation. The ADC values are reported in units×10−2 mm2/s. Vertebral body:
a portion where vertebral compression fractures has occurred. Intervertebral disc (superior): the upper disc of a portion where vertebral compression fractures are localized. Intervertebral disc (inferior): the lower disc of a portion where vertebral compression fractures are localized. The quantitative analysis found that for ADC map images, as the b values increased, the ADC values were relatively lowered at all the three sites, compared to the base b value (400 s/mm2)(p<0.05).
Fig. 4. The variation in signal intensity at the vertebral compression fracture site according to the varying b values on ADC map images. Findings showed that with the b value being increased, the signal-to-noise ratio gradually decreased at all the sites of the lumbar vertebral compression fracture and both the upper and lower discs of the fracture site.
0.62, 0.51, 0.47으로 감소되어 나타났다. 골절이 있는 부위 의 위측 추간판에서는 0.71, 0.68, 0.56, 0.47으로 감소되어 나타났다. 골절이 있는 부위의 아래측 추간판에서는 0.70, 0.55, 0.45, 0.41으로 감소되어 나타났다(Table 2).
ADC map영상에서 b value에 따른 관심영역의 신호대 잡 음비가 Table 3과 같이 b value가 증가함에 따라 척추 압박 골절이 있는 부위와 골절이 있는 부위의 위, 아래 추간판 등 세 부위 모두 신호대 잡음비가 상대적으로 감소했다(p<
0.05)(Fig. 4).
ADC map영상에서 b value가 400 s/mm2일 때의 신호대잡 음비를 1로 하였을 때, 각각의 b value 600, 800, 1,000, 1,200 s/mm2에서의 평균 신호대잡음비는 척추 압박 골절이 있는 부위에서는 0.95, 0.90, 0.84, 0.82으로 감소되어 나타 났다. 골절이 있는 부위의 위측 추간판에서는 0.87, 0.84, 0.82, 0.77으로 감소되어 나타났다. 골절이 있는 부위의 아 래측 추간판에서는 0.97, 0.95, 0.89, 0.87으로 감소되어 나 타났다(Table 4).
Fig. 6. Diffusion weighted images for different b values. The values of diffusion gradient strength (b values) being higher than 400 s/mm2, the signal intensity gradually decreased at all the sites: the site of lumbar vertebral compression fracture, and both the upper and lower discs of the said fracture site, while at the levels of more than 1,000 s/mm2, severe image noises appeared at all of the three sites. In addition, higher signal intensity was found at the site of compression fracture of the (lumbar) vertebral body than at the discs. (a) b value: 400 s/mm2, (b) b value: 400 s/mm2, (c) b value: 800 s/mm2, (d) b value: 1,000 s/mm2, (e) b value:
1,200 s/mm2.
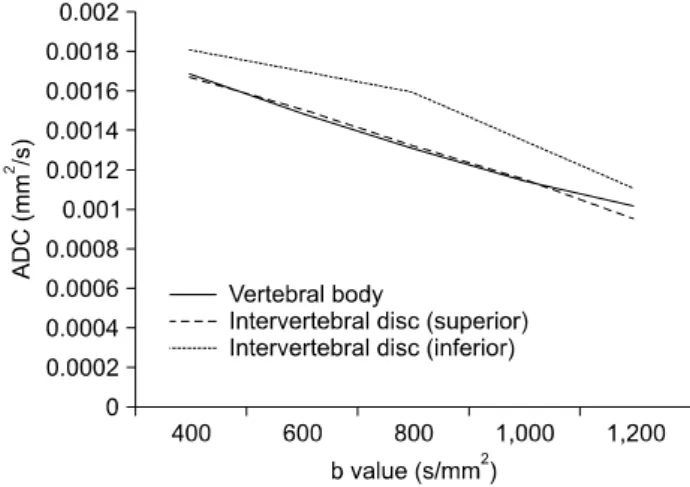
Fig. 5. The variation in ADC values at the lumbar vertebral compression fracture site according to the varying b values on ADC map images. Findings showed that with the b value being increased, ADC values gradually decreased at all the sites of the lumbar vertebral compression fracture and both the upper and lower discs of the fracture site.
ADC map영상에서 b value에 따른 관심영역의 현성 확산 계수(mm2/s)가 Table 5와 같이 b value가 증가함에 따라 척 추 압박 골절이 있는 부위와 골절이 있는 부위의 위, 아래 추간판등 세 부위 모두 현성 확산 계수(mm2/s)가 상대적으 로 감소했다(p<0.05)(Fig. 5). 영상의 정성적 분석에서 b value를 400 s/mm2 이상으로 증가시킴에 따라 척추 압박 골 절이 있는 부위와 골절이 있는 부위의 위, 아래 추간판등 세 부위 모두 신호강도가 점차 감소하였고 b value를 1,000
s/mm2 이상으로 했을 때에는 세 부위 모두 영상의 잡음이 매우 심했다. 또한 척추 압박 골절이 있는 부위는 상대적으 로 위, 아래 추간판보다 높은 신호강도를 보였다(Fig. 6).
고찰 및 결론
확산강조영상을 얻기 위해서는 보통 영상을 얻기 위해 필수적으로 사용하는 경사자장 외에 매우 강한 한 쌍의 경 사자장, 즉 확산강조 경사자장을 추가로 사용한다. 확산강 조 경사자장의 강도와 시간을 적분한 것을 경사계수(gradi- ent factor) 또는 b value라 하며, 경사계수가 클수록 확산이 강조된 영상을 얻을 수 있다. 즉, 조직의 확산계수가 클수 록, 또 사용하는 경사계수가 클수록 확산에 의한 신호감소 는 크게 나타난다.16,17) 척추 검사시 일반적으로 약 400 s/
mm2 정도의 b value를 걸면 확산에 의한 신호감소를 영상 화할 수 있다. Rho 등18)은 척추 골절 환자를 대상으로 b value 150 s/mm2을 사용하여 급성 골다공증성, 전이성, 만 성 골다공증성, 척추염등 네 부류로 분류하여 확산강조영 상에서의 신호 강도를 측정 하였고 확산강조 자기공명영상 에서 전이성 압박골절과 척추염은 고신호강도를 보이고 급 성 골다공증성 압박골절은 저신호강도를 보이며, 만성 골 다공증성 압박골절은 다양한 신호강도를 보여 준다고 보고 하였다. 하지만 b value의 변화에 따른 확산강조영상에서 신호강도 차이를 언급하지는 않았다. 본 연구에서는 b val- ue 400 s/mm2을 기준으로 만성 골다공증성 골절 환자 중 고신호강도를 보이는 환자를 대상으로 하였으며 b value의
변화에 따른 신호대 잡음비의 차이와 더 나아가 ADC map 에서의 신호대 잡음비와 현성확산계수 차이를 연구 하였 다. DeLano 등16)은 정상 뇌를 대상으로 b value가 증가함에 따라 백질과 회질에서 신호강도가 감소한다고 보고 하였 다. 본 연구 결과에서는 b value가 증가함에 따라 척추 압 박 골절이 있는 부위와 골절이 있는 부위의 위, 아래 추간 판등 세 부위 모두 신호대 잡음비가 감소했고 척추 압박 골절이 있는 부위는 상대적으로 위, 아래 추간판보다 높은 신호대 잡음비를 보였다. ADC map에서도 마찬가지로 세 부위 모두 신호대 잡음비가 상대적으로 감소했고 척추 압 박 골절이 있는 부위는 상대적으로 위, 아래 추간판보다 높 은 신호대 잡음비를 보였다. Chris 등19)은 정상 뇌를 대상으 로 b value가 증가함에 따라 백질과 회질에서 현성확산계수 가 감소한다고 보고 하였고 본 연구에서는 b value가 증가 함에 따라 척추 압박 골절이 있는 부위와 골절이 있는 부 위의 위, 아래 추간판등 세 부위 모두 현성확산계수가 감소 했다. 확산강조영상에서 b value 1,000 s/mm2 이상을 증가시 키면 영상의 신호가 크게 감소하여 잡음이 매우 심해 척추 구조물을 잘 구별하기 힘들었다. 이는 정량적 분석에서도 마찬가지의 결과를 보여, b value 1,200 s/mm2에서 영상의 신호대 잡음비가 b value 400 s/mm2에서의 영상에 비해 척 추 압박 골절이 있는 부위에서는 47%, 골절이 있는 부위의 위측 추간판에서는 47%, 골절이 있는 부위의 아래측 추간 판에서는 41% 정도 밖에 되지 않았다. 이는 b value 1,200 s/mm2 영상에서 b value 400 s/mm2 영상과 유사한 신호대 잡음비를 가지기 위해서는 acquisition을 약 2.5배로 해야 한 다는 의미를 가지며, 따라서 영상 획득 시간이 길어지는 단 점이 생긴다.
본 연구에는 몇 가지 문제점을 가지고 있는데, 첫째로 연 구 대상에서 만성 골다공증성 골절 환자중 고신호강도를 보이는 환자만을 대상으로 하였기 때문에 전체적인 만성 골다공증성 골절 환자에서 b value의 변화에 따른 신호강도 변화를 비교하는데는 어려움이 있다. 둘째로는 측정 부위 를 척추 압박 골절이 있는 부위로 제한을 두었기 때문에 해부학적으로 동일한 부위를 측정하지 않은 문제점을 가지 고 있다.
결론적으로 확산강조영상에서 b value를 증가시킴에 따 라 척추 압박 골절이 있는 부위와 골절이 있는 부위의 위, 아래 추간판등 세 부위 모두 신호대 잡음비와 현성확산계 수가 점차 감소하는 결과를 얻었지만 신호 비교를 통해 임 상적으로 b value 값의 적절성을 비교하기는 어려웠다.
하지만 척추 압박 골절 환자를 대상으로 확산강조영상
검사시 Multi b value를 사용하여 신호의 변화를 인지하는 것은 여러 가지 척추질환으로의 적용을 위해 매우 중요하 다고 생각된다.
참 고 문 헌
1. Melton LJ, Lane AW, Cooper C, et al: Prevalence and in- cidence of vertebral deformities. Osteoporos Int 3:113-119 (1993) 2. Cummings SR, Black DM, Rubin SM: Lifetime risks of hip, Colles, or vertebral fracture and coronary heart disease among white postmenopausal women. Arch Intern Med 149:2445-2448 (1989)
3. Melton LJ III, Kan SH, Frye MA, et al: Epidemiology of vertebral fractures in women. Am J Epidemiol 129:1000-1011 (1989)
4. Ross PD: Clinical consequences of vertebral fractures. Am J Med 103:30-43 (1997)
5. Cortet B, Houvenagel E, Puisieux F, et al: Spinal curva- tures and quality of life in women with vertebral fractures secon- dary to osteoporosis. Spine 24:1921-1925 (1999)
6. Pluijm SMF, Tromp AM, Smit JH, et al: Consequences of vertebral deformities in older men and women. J Bone Miner Res 15:1564-1572 (2000)
7. Cortet B, Roches E, Logier R, et al: Evaluation of spinal curvatures after a recent osteoporotic vertebral fracture. Joint Bone Spine 69:201-208 (2002)
8. Cook GJR, Hannaford E, See M, et al: The value of bone Scintigraphy in the evaluation of osteoporotic patients with back pain. Scand J Rheumatol 31:245-248 (2002)
9. Gehlbach SH, Bigelow C, Heimisdottir M, et al:
Recognition of vertebral fracture in a clinical setting. Osteoporos Int 11:577-582 (2000)
10. Grey C, Young R, Bearcroft PW, et al: Vertebral deformity in the thoracic spine in post-menopausal women: value of lum- bar spine bone density. Br J Radiol 69:137-142 (1996) 11. Moon JS, Won KC: The diagnosis and treatment of
osteoporosis. Yeungnam Univ J Med 25:19-30 (2008)
12. Kim KJ: 토끼 골격근 손상의 자기공명영상: 확산강조영상과 T2강조영상의 비교. 대한방사선의학회지 42:175-179 (2000) 13. Bauer A, Stabler A, Bruning R, et al: Diffusion-weighted
MR imaging of bone marrow: differentiation of benign versus pathologic compression fractures. Radiology 207:349-356 (1998) 14. Lee JH: 3.0T MR 기기를 이용한 확산강조영상에서 b Value의
증가에 따른 정상 뇌의 신호강도의 변화. 대한방사선의학회지 49:455-460 (2003)
15. Chien D, Kwong KK, Gress DR, et al: MR diffusion imag- ing of cerebral infarction in humans. AJNR 13:1097-1102 (1992) 16. DeLano MC, Cooper TG, Siebert JE, et al: High-b-value diffusion-weighted MR imaging of adult brain: image contrast and apparent diffusion coefficient map features. AJNR 21:1830-1836 (2000)
17. Burdette JH, Durden DD, Elster AD, et al: High b-value diffusion-weighted MRI of normal brain. J Comput Assist Tomogr
SNR and ADC Changes at Increasing b Values among Patients with Lumbar Vertebral Compression Fracture on 1.5T MR Diffusion
Weighted Images
Jae-Hwan Cho*, Cheol-Soo Park†, Sun-Yeob Lee†, Bo-Hui Kim‡
*Department of Radiology, Soonchunhyang University, Bucheon Hospital, Bucheon,
†Department of Diagnostic Radiological Technology, Hanlym College, Chuncheon,
‡Department of Emergency Center, Gangneung Asan Hospital, Gangneung, Korea
To examine among patients with vertebral compression fracture the extent to which signal-to-noise ratio (SNR) and Apparent Diffusion Coefficient (ADC) values at the lumbar vertebral compression fracture site vary on diffusion-weighted MR images according to varying b values on the 1.5T MR device. Diffusion-weighted MR images of 30 patients with compression fracture due to chronic osteoporosis who underwent vertebral MRI from Jan. 2008 to Nov. 2009 were respectively obtained using a 1.5-T MR scanner with the b values increased from 400, 600, 800, 1,000 to 1,200 s/mm2. For diffusion-weighted MR images with different b values, the signal-to-noise ratio (SNR) was assessed at three sites: the site of compression fracture of the lumbar vertebral body at L1 to L5, and both the upper and lower discs of the said fracture site, while for ADC map images with different b values, the SNR and ADC were respectively assessed at those three sites. As a quantitative analysis, diffusion-weighted MR images and ADC map images with b value of 400 s/mm2 (the base b values) were respectively compared with the corresponding images with each different b value. As far as qualitative analysis is concerned, for both diffusion-weighted MR and ADC map images with b value of 400 s/mm2, the extent to which signal intensity values obtained at the site of compression fracture of the lumbar vertebral body at L1 to L5 vary according to the increasing b values were examined. The quantitative analysis found that for both diffusion-weighted MR and ADC map images, as the b values increased, the SNR were relatively lowered at all the three sites, compared to the base b value. Also, it was found that as the b values increased, ADC values were relatively lowered at all the three sites on ADC map images. On the other hand, the qualitative analysis found that as the b values increased to more than 400 s/mm2, the signal intensity gradually decreased at all the sites, while at the levels of more than 1,000 s/mm2, severe image noises appeared at all of the three sites.
In addition, higher signal intensity was found at the site of compression fracture of the lumbar vertebral body than at the discs. Findings showed that with the b value being increased, both the signal-to-noise ratio (SNR) and Apparent Diffusion Coefficient (ADC) values gradually decreased at all the sites of the lumbar vertebral compression fracture and both the upper and lower discs of the fracture site, suggesting that there is a possibility of a wider range of applications to assessment of various vertebral pathologies by utilizing multi b values in the diffusion-weighted MRI examination.
Key Words: Diffusion-weighted image, Vertebral compression fracture, b value, Signal to noise ratio (SNR), Apparent diffusion coefficient (ADC)
25:515-519 (2001)
18. Rho BH: Diffusion-weighted MR imaging of bone marrow in the spine: differentiations of metastatic compression fracture, benign compression fracture & spondylitis. 대한방사선의학회지
43:349-355 (2000)
19. Chris A. Clark, Denis LB: Diffusion compartmentation and anisotropy at high b values in the human brain. Magnetic Resonance in Medicine 44:852–859 (2000)