IoT 응용을 위한 RF 에너지 전송 테스트베드 구현 및 실험
Arif Abdul Aziz
, Dimas Tribudi
*, Lorenz Ginting
*, Phisca Aditya Rosyady
*, Dedi Setiawan
*, 최 계 원
°RF Energy Transfer Testbed
Based on Off-the-shelf Components for IoT Application
Arif Abdul Aziz
, Dimas Tribudi
*, Lorenz Ginting
*, Phisca Aditya Rosyady
*, Dedi Setiawan
*, Kae Won Choi
°요 약
본 논문에서는 IoT 환경에서의 RF 무선 에너지 전송을 실험할 수 있는 테스트베드 구현 방안에 대해 설명하고 이를 이용한 실험 결과를 소개한다. 본 논문에서 고려하는 IoT 환경은 마이크로파를 통해 무선으로 에너지를 전송 할 수 있는 전력 비콘(power beacon)과 이로부터 에너지를 수신 받아 동작하는 다수의 센서 노드로 구성되어 있 다. 이러한 IoT 환경에서 RF 에너지 전송을 실험하기 위한 테스트베드를 구현하였으며 주로 상용 제품으로 테스 트베드를 구성하고 소프트웨어를 통한 제어를 가능하게 함으로써 다양한 에너지 및 데이터 전송 프로토콜 실험을 수행할 수 있는 환경을 쉽게 구축할 수 있도록 하였다. 또한 테스트베드를 통한 실험 결과를 소개하고 향후 테스 트베드 활용 방안에 대해 논의한다.
Key Words : RF energy transfer, testbed, Internet of Things (IoT), energy harvesting, sensor network
ABSTRACT
In this paper, we introduce a testbed for testing the RF energy transfer technology in the Internet of Things (IoT) environment, and provide experimental results obtained by using the testbed. The IoT environment considered in this paper consists of a power beacon, which is able to wirelessly transfers energy via microwave, and multiple sensor nodes, which makes use of the energy received from the power beacon. We have implemented the testbed to experiment the RF energy transfer in such IoT environment. We have used off-the-shelf hardware components to build the testbed and have made the tesbed controlled by software so that various energy and data transmission protocol experiments can easily be conducted. We also provide experimental results and discuss the future research direction.
http://dx.doi.org/10.7840/kics.2015.40.10.1912
※ 본 논문은 2015년도 정부(미래창조과학부)의 재원으로 한국연구재단의 지원을 받아 수행된 기초연구사업입니다 (2014R1A5A1011478).
First Author : Seoul National University of Science and Technology, Department of Computer Science and Engineering, [email protected], 학생회원
° Corresponding Author : Seoul National University of Science and Technology, Department of Computer Science and Engineering, [email protected], 종신회원
* Seoul National University of Science and Technology, Department of Computer Science and Engineering, [email protected], [email protected], [email protected], [email protected]
논문번호:KICS2015-08-273, Received August 31, 2015; Revised October 20, 2015; Accepted October 20, 2015
Ⅰ. Introduction
The wireless power transfer has been considered as a promising technology for supplying stable energy to untethered electronic devices. Among the wireless power transfer technologies, we consider the radio frequency (RF) energy transfer technique that makes use of microwave as a medium to convey energy. There are other wireless power transfer techniques, namely, magnetic resonant and inductive coupling, which promise higher energy transfer efficiency than the RF energy transfer does.
However, the magnetic resonant and inductive coupling can only be used in a short-range case, while the RF energy transfer can realize far-field energy transfer.
The long range and low energy transfer efficiency characteristics make the RF energy transfer a suitable charging technique for the Internet of Things (IoT) environment[1]. Usually, low power wireless sensor and actuator nodes are deployed in a wide area in the IoT environment. The RF energy transfer can help extend the lifetime of sensor nodes in such IoT environment especially when the battery charging is inconvenient or infeasible.
Recently, the development of the RF energy harvesting technology has attracted great attention among the wireless communication researchers[2]. One of the research directions is the simultaneous wireless information and power transfer (SWIPT) (e.g., [3]). In SWIPT, the transmitter sends data and energy via the same microwave signal possibly by using the multiple-input and multiple-output (MIMO) technique (e.g., [3]). The other research direction is the wireless powered communication network (WPCN) that refers to the network powered by the RF energy transfer[4]. Although a large body of research papers have been published, most of them are purely theoretic, which lacks the consideration on many practical aspects of the RF energy transfer, e.g., rectifier efficiency and circuit power consumption.
To conduct a practical research, we require to build the testbed of the RF energy transfer for the following reasons. First, the testbed can prove the
feasibility of the RF energy transfer in the IoT application and can reveal the potential and the limitation of the RF energy transfer. Second, by using the testbed, we can set up a realistic model of the RF energy transfer system, which can be used for mathematical analysis as well as computer simulations. Third, realtime control and communication algorithms can be implemented and evaluated in the testbed.
In this paper, we introduce a testbed for testing the RF energy transfer technology in the IoT environment. This testbed consists of a power beacon, which is able to wirelessly transfer energy via microwave, and multiple sensor nodes, which makes use of the energy received from the power beacon. We have used off-the-shelf commercially available hardware components to build the testbed and have made the tesbed controlled by software so that various energy and data transmission protocol experiments can easily be conducted.
In the power beacon, we use a laptop connected to the universal software radio peripheral (USRP)[5]
and power amplifier[6], instead of using a static power transmitter with a fixed signal and power.
Thereby, we can dynamically adjust the waveform and the power on the transmitter side. In a sensor node, a sensor board[7] draws current from a supercapacitor that stores energy charged by an energy harvesting board[8]. The energy harvesting board converts the received RF signal to a DC current.
While there are a number of existing works on the RF energy harvesting circuit design, only a few experimental researches have been done about the RF energy transfer from the point of view of wireless communication and IoT sensor networks (e.g., [9-11]). In [9], the authors propose an adaptive duty cycle control scheme optimized for RF energy harvesting. The charging equation for replenishing an energy storage element by the RF energy transfer is studied by [10]. In [11], the authors have designed RF-MAC that optimizes RF energy delivered to sensor nodes, while minimizing disruption to data communication.
The rest of the paper is organized as follow. In
Fig. 1. Testbed architecture Section II, we will explain our RF energy harvesting
testbed including the power beacon, the energy harvesting board, the energy storage, and the sensor board. Section III will explain experimental tests and measurement results. Finally, in Section IV, we conclude the work and share our future plan for this testbed.
Ⅱ. RF Energy Transfer Testbed
2.1 Overall Testbed Architecture
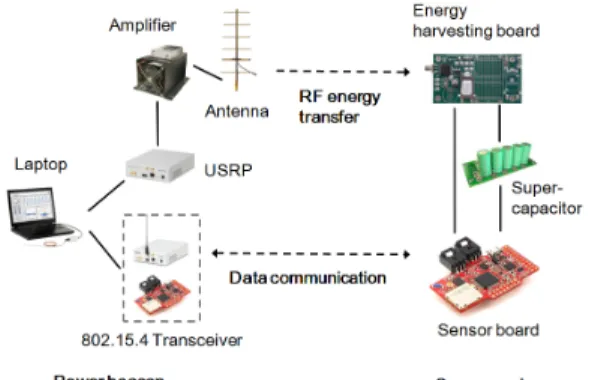
We build a testbed consisting of the power beacon and the sensor node as shown in Fig. 1. The core idea of this testbed is described as follows. In the power beacon, the power of the RF signal generated by the USRP is enhanced by the amplifier, and the antenna thereby yields a powerful RF signal. This high-power RF signal is received by the energy harvesting board in the sensor node. The energy of the received RF signal is stored in the supercapacitor by the energy harvesting board. The sensor board consumes the energy stored in the supercapacitor for its operation. The power beacon and the sensor node can communicate with each other by means of the 802.15.4 transceiver.
The energy transmission part of the power beacon consists of a USRP, an amplifier, and an antenna.
As described above, the USRP works as an RF signal generator, but this signal is too weak to convey energy to the energy harvesting board. The required received power range of the energy harvesting board (i.e., Powercast P2110) is 0.5 mW - 10 mW, whereas, based on our observation, the received power of the RF signal generated by USRP cannot surpass 1 mW on the receiver side even in a very short distance between the USRP and the energy harvesting board. Due to a phenomenon called fading, a high power RF signal is certainly necessary to be able to yield the received power that can match the required received power range. In order to accomplish this goal, we use the amplifier and the directional antenna to increase the received power at the energy harvesting board. The received power on the energy harvesting board is eventually used to charge the supercapacitor.
The sensor board in the sensor node uses the energy stored in the supercapacitor. The sensor board, which is also connected to the energy harvesting board, can acquire the received signal strength indicator (RSSI) value from the energy harvesting board. The sensor board can also measure the voltage level of the supercapacitor, which indicates the amount of the energy stored in the supercapacitor.
The power beacon and the sensor node exchange information by means of the IEEE 802.15.4 transceiver. In the sensor node, the 802.15.4 chip (i.e., TI CC2420) in the sensor board is used for communication. On the other hand, in the power beacon, we can use either another USRP or another sensor board attached to the laptop via serial connection. By using this communication link, the sensor node can report the RSSI value or the voltage level of the supercapacitor to the power beacon. The power beacon can send a command to the sensor node via this communication link, too.
2.2 Power Beacon
The USRP, the amplifier, and the Yagi antenna take important roles in the RF energy transfer of the power beacon. To provide a better understanding about the RF energy transmission of this testbed, the functions of all the instruments used will be explained in this section.
We use NI USRP-2922[5] as an RF signal generator. This USRP operates in 400 MHz - 4.4 GHz carrier frequency. Based on its specification, this device is able to generate the maximum power
of 100 mW. The signal transmission power and the waveform is controlled by the Labview software in the labtop computer. The Labview software generates a baseband signal, which is delivered to the USRP via an Ethernet link. Then, the USRP converts the basedband signal to the RF signal.
The amplifier used in this testbed is Mini-Circuit ZHL-5W-422+[6]. This amplifier works in the range of 500 MHz to 4200 MHz. The maximum input power of this amplifier is up to 100 mW, that matches the maximum output power of the USRP.
The maximum output power of this amplifier is 5 W and the maximum gain is 25 dB. In the power beacon, we use directional PC 904 Yagi Antenna.
This directional antenna works in the range frequency of 896 MHz - 980 MHz and has a gain of 8.15 dBi.
For communication with the sensor node, we can use either the USRP-based software-defined radio (SDR) or the Zolertia Z1 sensor mote[7] in the power beacon. For the USRP-based SDR, we have implemented a baseband processing algorithm compliant to IEEE 802.15.4 specification by using the Labview software. We have implemented a Labview code for preamble detection, phase and frequency synchnonization, modulation and demodulation for the IEEE 802.15.4 communication.
Alternatively, we can use the Z1 sensor mote connected to the laptop via serial communication. In this case, the TI CC2420 chip embedded in the Z1 sensor mote is used as the 802.15.4 transceiver.
The overall operation of the power beacon is controlled by the Labview code that runs on the laptop. From this code, some of parameters of the USRP for the energy transmission can be adjusted manually, for instance, an operating frequency and a gain of the USRP, as well as the magnitude and the phase of the baseband signal. We can process the report from the sensor node, which includes the RSSI value and the voltage level of the supercapacitor, by using the Labview code. We can also implement an algorithm that autonomously controls the parameters for the energy transmission based on the RSSI and the voltage level.
2.3 Energy Harvesting Board
In the sensor node, the energy harvesting board receives an RF signal and converts it to a DC signal. We use the Powercast P2110 evaluation board[8] as the energy harvesting board. A directional antenna with a 6 dBi gain is used with the energy harvesting board. The P2110 has been optimized for operation in the 902 MHz - 928 MHz band but operates outside this band with reduced efficiency.
The efficiency is the ratio of the output power to the input power. The efficiency is a non-linear function of the input power due to the RF-to-DC conversion.
The efficiency graph of P2110 can be found in [8].
The P2110 board has the RSSI functionality that allows the sampling of the received signal to provide an indication of the amount of energy being harvested. When the RSSI functionality is activated, the harvested DC power is directed to an internal sense resistor and the corresponding voltage is provided to an output pin. The sensor board can read the RSSI from the P2110 board to predict the amount of harvested energy.
2.4 Supercapacitor
We use a supercapacitor for storing the energy harvested from the energy harvesting board. The benefit of using a supercapacitor compared to a chemical battery is that we can charge the supercapacitor unlimited times.
The most important characteristic of a capacitor is its capacitance C. It describes the property of a capacitor’s capability to store electrical energy if a given voltage V is applied. The energy stored in a capacitor, denoted by W, can be expressed as
W=(1/2)CV
2.Other important characteristics of capacitor is capacitor leakage characteristics. The energy in capacitor discharges even though there is no load applied to the capacitor.
2.5 Sensor Board
We use the Zolertia Z1 mote[7] as a sensor board.
The Z1 mote is a low power wireless module compliant with IEEE 802.15.4 protocol. Its core architecture is based upon the MSP430
Fig. 2. Current draw of the sensor board over time microcontroller unit (MCU) and the CC2420 radio transceivers. The MSP430 is an MCU that incorporates a 16-bit RISC CPU, peripherals, and a clock system. The CC2420 is a single-chip 2.4 GHz IEEE 802.15.4 compliant RF transceiver designed for low-power and low-voltage wireless applications.
The MSP430 and the CC2420 chips have multiple operating modes to reduce the current consumption.
The MSP430 has the current consumption of 0.1 µA in the OFF mode, 0.5 µA in the standby mode, and 0.5 mA in the active mode with 1 MHz clock. The CC2420 chip has the current consumption of less than 1 µA in the OFF mode, 20 µA in the power down mode, 426 µA in the idle mode, 18.8 mA in the receive mode, and 17.4 mA in the transmit mode with the power of 0 dBm. Since the energy harvested from the RF signal is very low, we need to utilize these low power modes to save energy.
In the Z1 mote, we use Contiki[12] as an operating system. Contiki is an open source operating system for the Internet of Things. Contiki runs on tiny low-power microcontrollers and makes it possible to develop applications that make efficient use of the hardware while providing standardized low-power wireless communication for a range of hardware platforms. We use Contiki as a software platform for the sensor board since Contiki provides a set of convenient software libraries for hardware control.
We have written an application code running on top of Contiki. This code periodically changes the
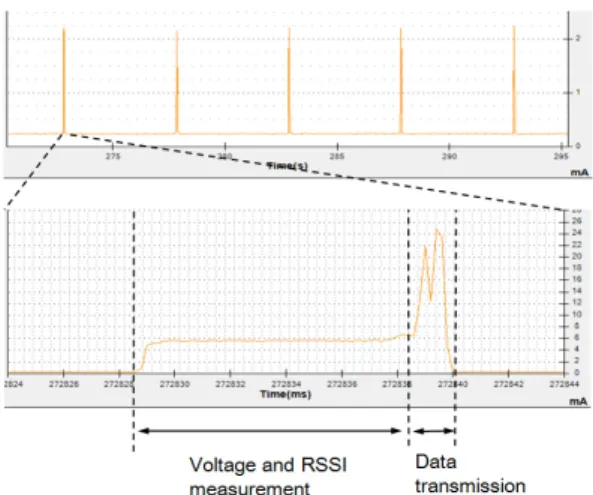
operating mode of all chips on the Z1 mote to minimize the energy consumption. In the active duration, the Z1 mote first obtains the RSSI value and the voltage level of the supercapacitor. The RSSI value is derived from the energy harvesting board by using the analog-to-digital conversion (ADC). The voltage level is obtained from an internal sensor of the MSP430 MCU. Other sensor measurements, such as temperature and light, can also be made during the active duration. Then, the Z1 mote transmits the sensing results to the power beacon via the 802.15.4 communication link. After an active duration, the Z1 mote goes to an inactive duration. During an inactive duration, every chip should be put into an low power mode.
The cycle time is defined as the time between the start of each consecutive active duration. If the cycle time is small, the sensor board provides more frequent sensing results, but the energy consumption is high. Therefore, the sensor board should use appropriate cycle time to strike the balance between the sensing frequency and the energy consumption.
In Fig. 2, we show the current draw of the sensor board over time, measured by the Monsoon power monitor. In this figure, the cycle time is set to 5 seconds. We can see high power consumption during the active period, especially when the data is transmitted.
Ⅲ. Experimental Result
3.1 Supercapacitor Leakage Test
In this section, we present various measurement results from the testbed. A capacitor, including a supercapacitor, has a capacitor leakage. The energy stored within a supercapacitor leaks over time even though no load is applied. Since the energy supplied by the RF energy harvesting is small, the capacitor leakage has a great impact on the performance of the RF energy transfer system.
Fig. 3 is the result of our observation when isolating a fully charged supercapacitor from other components and letting the energy in the supercapacitor discharge until the voltage of the supercapacitor reaches 2.5 V. Here, we can see that
Fig. 4. The RSSI value according to the distance between the power beacon and the energy harvesting board.
Fig. 5. Stored energy over time when the supercapacitor is charged by the energy harvesting board.
Fig. 3. Discharging of the stored energy in a supercapacitor over time due to the capacitor leakage
the capacitor leakage is quite high in a high voltage level and gradually becomes low as the voltage level gets lower.
3.2 Energy Charging Performance of Power Beacon and Energy Harvesting Board Fig. 4 depicts the relationship between the RSSI value (in mW) and the distance from the power beacon to the energy harvesting board. This result is acquired from the experiments conducted by changing the position of the energy harvesting board to various distances. From the result, it can be seen that the variation of the distance has a great impact on the RSSI value. The farther the distance, the lower is the RSSI value received on the energy harvesting board. The gain in this figure represents the gain of signal from the USRP output before it is amplified.
We also investigate the relationship between
the RSSI value and the charging time. This investigation has been carried out by varying the transmit power from the power beacon. We choose 13 RSSI values from 0.5 mW to 7 mW. No load is applied in this experiment. We use the supercapacitor with the capacitance of 0.1 Farad. In Fig. 5, we show the stored energy in the capacitor (in mJ) according to the elapsed time. The energy stored in the capacitor, denoted by W is calculated by W=(1/2)CV2, where C is the capacitance and V is the voltage of the supercapacitor.
Fig. 5 shows that the charging time of the supercapacitor is strongly dependent upon the RSSI value. With the higher RSSI received by the energy harvesting board, more energy can be stored in the supercapacitor for the same time duration. Thus, the charging time of the supercapacitor becomes shorter with the higher RSSI. With the constant RSSI value, the energy stored in the supercapacitor increases in a constant rate especially when the RSSI is high.
However, if the RSSI is low, this linear increment is disturbed by other factors such as the capacitor leakage, which is noticeable especially in a high voltage level.
The charging power is defined as the power supplied to the supercapacitor by the energy harvesting board. After eliminating the effect of the capacitor leakage, we can obtain the charging power according to the RSSI value based on the results in Fig. 5. In Fig. 6, we show the charging power obtained in this way. We can see that the charging
Fig. 6. Charging power and energy harvesting efficiency according to RSSI.
Fig. 7. Power consumption of the sensor board according to cycle time.
power increases as the RSSI increases, although the charging power and the RSSI does not have a linear relationship.
In Fig. 6, we also show the energy harvesting efficiency. It should be noted that the energy harvesting efficiency is defined as the ratio of the charging power to the RSSI value. From the measured result depicted in Fig. 6, it seem that the highest efficiency is obtained when the RSSI value is around 3.2 mW. At this RSSI value, the highest energy harvesting efficiency is 37 %.
3.3 Energy Consumption of Sensor Board In this subsection, we show the measurement results about the energy consumption of the sensor board. Fig. 7 shows the power consumption according to the cycle time. We obtain this results
by using the Monsoon power monitor without connecting the sensor board to the energy harvesting board or the supercapacitor. Here, we can see that the power consumption in sensor board becomes greater as we decrease the cycle time. The charging power converges to some value as we increase the cycle time since the sensor board still consumes energy even when it is in inactive periods. From Fig. 7, we can also see that the voltage level also affects the power consumption in the sensor board.
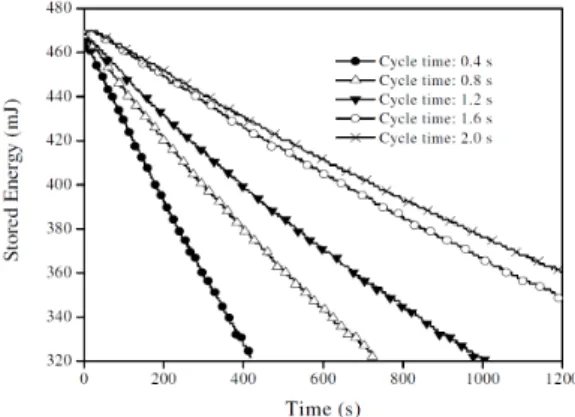
Fig. 8 shows the experimental result when we discharge a fully charged supercapacitor with the power consumption from the sensor board. No charging from the energy harvesting board is applied in this experiment. The cycle time of the sensor board is constant. In this experiment, we use the supercapacitor with the capacitance of 0.1 Farad. It can be seen that lower cycle time results in a faster loss of energy stored in the supercapacitor.
Fig. 8. Stored energy over time when the energy in the supercapacitor is consumed by the sensor board.
3.4 Simultaneous Charging and Discharging Test
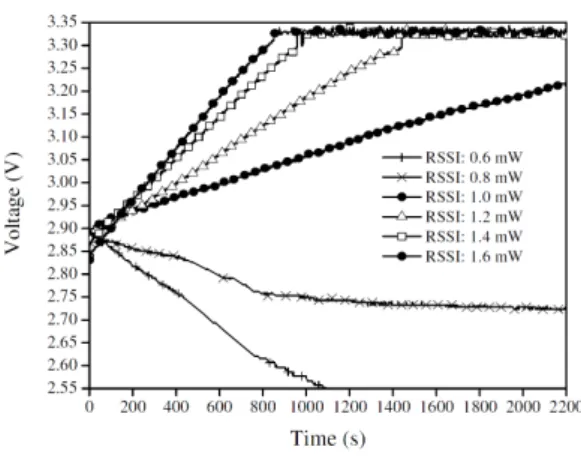
Fig. 9 shows the result of our experiment in the simultaneous charging and discharging test. In this experiment, the energy in the supercapacitor is charged by the energy harvesting board and at the same time is consumed by the sensor board. We set duty cycle to 0.7 second and adjust the RSSI to various values, from 0.6 mW to 1.6 mW. We can see that, with a high RSSI value, the voltage of the supercapacitor increases at a constant rate until the
Fig. 9. Voltage level of the supercapacitor over time when the energy is charged and discharged simultaneously.
Fig. 10. Stationary voltage level of the supercapacitor according to the cycle time and the RSSI value.
maximum voltage is reached. However, when the RSSI value is 0.8 mW, the voltage converges to the point at which the charging power and the consumed power are in equilibrium. When the RSSI value is 0.6 mW, the voltage keeps decreasing since the charging power is less than the consumed power.
If we connect the energy harvesting board and the sensor board at the same time, the voltage level of the supercapacitor reaches to some stationary value as seen in Fig. 9. We define this voltage as the stationary voltage level. In Fig. 10, we show the stationary voltage level of the supercapacitor according to the cycle time and the RSSI value.
Fig. 10 shows the feasibility of the cycle time and RSSI combination. The RF energy transfer system is sustainable only when the stationary voltage level is above the minimum required voltage for the sensor
board, i.e., 2.55 V. If we want to make the sensor board activated more often, we need to make sure that the RSSI at the energy harvesting board is high enough so that the charging power is greater than the sum of the power consumption and the capacitor leakage.
Ⅳ. Conclusion and Future Works
In this work, we have introduced an RF energy transfer testbed and presented some preliminary measurement results. There are many possible directions to expand this testbed for testing various technologies and applications of the RF energy transfer.
As our nearest future works with this testbed, we plan to do two things. The first is to expand our testbed with a beamforming capability to enhance the end-to-end power transfer efficiency. The second is to find an accurate empirical model so that we can create an autonomous and predictive control algorithm that can bring our testbed to its maximum efficiency by dynamically adjusting the transmit power of the power beacon and the cycle time of the sensor board.
References
[1] L. Xie, Y. Shi, Y. T. Hou, and W. Lou,
“Wireless power transfer and applications to sensor networks,” IEEE Wireless Commun.
Mag., vol. 20, no. 4, pp. 140-145, Aug. 2013.
[2] X. Lu, P. Wang, D. Niyato, D. I. Kim, and Z.
Han, “Wireless networks with RF energy harvesting: a contemporary survey,” IEEE
Commun. Surveys Tuts., vol. 17, no. 2, pp.
757-789, 2015.
[3] Z. Ding, C. Zhong, D. Ng, M. Peng, H.
Suraweera, R. Schober, and H. Poor,
“Application of smart antenna technologies in simultaneous wireless information and power transfer,” IEEE Commun. Mag., vol. 53, no. 4, pp. 86-93, Apr. 2015.
[4] S. Bi, C. K. Ho, and R. Zhang, “Wireless powered communication: opportunities and
challenges,” IEEE Commun. Mag., vol. 53, no.
4, pp. 117-125, Apr. 2015.
[5] National Instruments, NI USRP-292x/293x
Datasheet: Universal Software Radio Peripherals,
Retrieved Aug. 2015 from http://www.ni.com/datasheet/pdf/en/ds-355.
[6] Mini-Circuits, Coaxial High Power Amplifier:
ZHL-5W-422+, Retrieved Aug. 2015 from
http://www.minicircuits.com/pdfs/ZHL-5W- 422+.pdf.[7] Zolertia, Z1 datasheet, Retrieved Aug. 2015 from http://zolertia.sourceforge.net/wiki/images /e/e8/ Z1_RevC_Datasheet.pdf.
[8] Powercast Corporation, Product Datasheet: P2
110–915 MHz RF Powerharvester Receiver,
Retrieved Aug. 2015 from http://www.powerca stco. com/PDF/P2110-datasheet.pdf.[9] R. Shigeta, T. Sasaki, D. M. Quan, Y.
Kawahara, R. J. Vyas, M. M. Tentzeris, and T. Asami, “Ambient RF energy harvesting sensor device with capacitor-leakage-aware duty cycle control,” IEEE Sensors J., vol. 13, no. 8, pp. 2973-2983, Aug. 2013.
[10] D. Mishra, S. De, and K. R. Chowdhury,
“Charging time characterization for wireless RF energy transfer,” IEEE Trans. Cir. Syst. II:
Express Briefs, vol. 62, no. 4, pp. 362-366,
Apr. 2015.[11] M. Y. Naderi, P. Nintanavongsa, and K. R.
Chowdhury, “RF-MAC: a medium access control protocol for re-chargeable sensor networks powered by wireless energy harvesting,” IEEE Trans. Wirel. Commun., vol. 13, no. 7, pp. 3926-3937, Jul. 2014.
[12] A. Dunkels, B. Gronvall, and T. Voigt,
“Contiki - a lightweight and flexible operating system for tiny networked sensors,” in Proc.
IEEE LCN 2004, pp. 455-462, Tampa, FL,
Nov. 2004.Arif Abdul Aziz
2015년 2월 : B.S., Department of Electronics and Instrumentation, University of Gadjah Mada
2015년 3월~현재:서울과학기 술대학교 컴퓨터공학과 석사 과정
<관심분야> RF Energy Transfer, Wireless Sensor Network, Robotics, Digital Image Processing (Computer Vision), Embedded System.
Dimas Tribudi
2011년 2월 : B.S., Department of Electrical Engineering, University of Indonesia 2011년 9월~2013년 2월 : Tele-
communication engineer, Alstom Grid
2015년 2월:서울과학기술대학 교 컴퓨터공학과 석사
<관심분야> M2M communication, D2D communication, RF energy harvesting, software defined radio
Lorenz Ginting
2015년 2월 : B.S., School of Electrical Engineering and Informatics, Institut Teknologi Bandung
2015년 3월~현재:서울과학기 술대학교 컴퓨터공학과 석사 과정
<관심분야> RF energy transfer, MIMO Beamforming
Phisca Aditya Rosyady
2014년 2월 : B.S., Department of Electronics and Instru- mentation, Universitas Gadjah Mada
2014년 3월~2015년 2월 : .Net Developer, PT. Astra Graphia Information Technology 2015년 3월~현재:서울과학기술대학교 컴퓨터공학
과 석사과정
<관심분야> RF Energy Transfer, Wireless Sensor Network, MIMO Beamforming
Dedi Setiawan
2006년 2월 : B.S., School of Electrical Engineering and Informatics, Institut Teknologi Bandung
2006년 3월~2014년 2월:Soft- ware Developer, Clarisense Digital Media
2011년 2월 : M.S., School of Electrical Engineering and Informatics, Institut Teknologi Bandung
2014년 3월~현재:서울과학기술대학교 의공학바이 오소재융합협동과정 박사과정
<관심분야> Wireless Sensor Network, RF Energy Harvesting
최 계 원 (Kae Won Choi)
2001년 2월 : 서울대학교 지구 환경시스템공학부 학사 2007년 8월:서울대학교 컴퓨
터공학과 박사
2010년 9월~현재:서울과학기 술대학교 컴퓨터공학과 조교 수
<관심분야> RF energy transfer, Device-to-Device Communication, Cognitive Radio