Jour. Korean Earth Science Society, v. 32, no. 7, p. 770−783, December 2011 http://dx.doi.org/10.5467/JKESS.2011.32.7.770
Projected Climate Change Scenario over East Asia by a Regional Spectral Model
Eun-Chul Chang and Song-You Hong*
Department of Atmospheric Sciences and Global Environment Laboratory, Yonsei University, Seoul 120-749, Korea
동아시아 지역에서의 지역 분광 모델을 이용하여 투영시킨 기후변화 시나리오
장은철·홍성유*
연세대학교 대기과학과, 120-749, 서울시 서대문구 연세로 50
Abstract: In this study, we performed a downscaling of an ECHAM5 simulated dataset for the current and future climate produced under the Special Report on Emission Scenarios A1B (SRES A1B) by utilizing the National Centers for Environmental Prediction (NCEP) Regional Spectral Model (RSM). The current climate simulation was performed for the period 1980-2000 and the future climate run for the period 2040-2070 for the COordinated Regional climate Downscaling EXperiment (CORDEX)’s East Asia domain. The RSM is properly able to reproduce the climatological fields from the evaluation of the current climate simulation. Future climatological precipitation during the summer season is increased over the tropical Oceans, the maritime-continent, and Japan. In winter, on the other hand, precipitation is increased over the tropical Indian Ocean, the maritime-continents and the Western North Pacific, and decreased over the eastern tropical Indian Ocean. For the East Asia region few significant changes are detected in the precipitation climatological field.
However, summer rainfall shows increasing trend after 2050 over the region. The future climate ground temperature shows a clear increasing trend in comparison with the current climate. In response to global warming, atmospheric warming is clearly detected, which strengthens the upper level trough.
Keywords: Downscaling, RSM, emission scenario, global warming, East Asia, CORDEX
요 약: 본 연구에서는 ECHAM5 모델을 통하여 생산된 현재 및 A1B 미래 기후 변화 시나리오에 따른 미래기후 자료 를 미 환경예측 센터의 분광모델인 RSM을 이용하여 역학적 규모축소를 수행하였다. 현재 기후 모의는 1980-2000년 기간에 대하여 수행되었으며, 미래 기후 모의는 2040-2070 기간에 대하여 CORDEX에서 제시한 동아시아 영역에서 수 행되었다. RSM의 현재 기후 모의 검증을 통해 이 모델이 기후 관점에서 대기 상태를 적절히 모의함을 판단할 수 있었 다. 미래 기후 모의 결과를 현재 기후 모의 결과와 비교하여 본 결과, 여름철에 열대 해양, 남아시아, 일본 부근에서 강 수가 증가하였으며, 겨울철에는 서북 태평양 지역과 열대 인도양에서 강수가 증가하였고 열대 동인도양에서는 감소하였 다. 동아시아 강수의 기후장에 있어서는 미래 기후가 현재와 큰 차이를 보이지 않지만 2050년 이후의 여름철 강수는 점차 증가하는 추세를 나타내고 있다. 미래 기후의 지상 온도는 현재와 비교해 볼 때 명확한 상승이 분석되었다. 대기 장에 있어서는 미래 기후에서 지구 온난화에 대한 반응으로 전체적으로 온도와 지위고도장이 증가하는 변화를 나타내 었으며 이에 따라 상층 기압골이 발달함을 보였다.
주요어: 규모축소, RSM, 배출 시나리오, 지구 온난화, 동아시아, CORDEX
*Corresponding author: [email protected]
*Tel: +82-2-2123-2679
*Fax: +82-2-365-5163
Introduction
The impacts of future climate change have been intensively studied with great interest in many fields such as hydrology (Cohen et al., 2000; Gosain et al., 2006; Menzel et al., 2006; Yaning et al., 2006), water resource management (Krasovskaia, 1995; Risbey and Entekhabi, 1996), agriculture (Darwin et al., 1995;
Adams et al., 1998; Selvaraju, 2003), forestry (Kirilenko and Solomon, 1998), flood (Mirza et al., 1998;
Reynard et al., 1998; Miller et al., 2004), drought (Vicente-Serrano and Lopez-Moreno, 2006), human and animal populations (Brotton and Wall, 1997;
Ferguson, 1999) and their health (Tyler, 1994; Hamilton, 1995; Pounds et al., 1999). A proper assessment of probable future climate and its variability is to be made for various climate scenarios. These scenarios refer to plausible future climates which have been constructed for explicit use in investigating the potential consequences of anthropogenic climate change and natural climate variability (Anandhi et al., 2008).
The Intergovernmental Panel on Climate Change (IPCC) Fourth Assessment Report (AR4) presented the results of simulations of future global climate scenarios (IPCC, 2007). These simulations used six Special Report on Emissions Scenarios (SRES) emission profiles, A1FI, A1T, A1B, A2, B1, and B2, in conjunction with considerations of socio-economic factors including population density, economic growth, energy use efficiency, and scientific and technological developments.
Global climate models (GCMs) have been widely used to produce long-term homogeneous predictions under aforementioned future climate change scenarios.
However, due to their low special resolution (generally
>100 km) GCMs cannot be used directly for climate impact assessment on a local scale. Thus, downscaling is performed either by statistical methods (Kwadijk and Rotmans, 1995), or by nesting a regional climate model (RCM) in the GCM over the domain of interest (Giorgi et al., 1997; Hong and Leetmaa 1999; Kleinn et al., 2005; Yhang and Hong 2008; Hurkmans et al., 2010; Hong et al., 2010; Sun et al., 2011; Oh et al., 2011).
In this study, we perform dynamical downscaling by utilizing the National Centers for Environmental Centers (NCEP) Regional Spectral Model (RSM;
Juang et al. 1997) from the projected simulation of the European Centre Hamburg Version 5 (ECHAM5) model for current climate (1978-2000) and future climate (2038-2070) which follows the A1B scenario over the COordinated Regional climate Downscaling EXperiment (CORDEX) domain, which covers East Asia, the Indian and western Pacific Oceans, and the northern Australia (see Fig. 1). These regions in CORDEX domain are reported that they have significant direct/remote effects on changes of the East Asian monsoon system (Cha, 2007; Lee et al., 2007).
Through a comparison of these two period runs, future climate changes of precipitation, temperature, geopotential height and wind fields are discussed with respect to current climate over East Asia.
The organization of this paper is as follows: Section 2 describes the experimental design. Section 3 provides evaluations of the downscaled results from RSM for current climate. Section 4 describes future climate changes in comparison with current climate.
Section 5 provides a summary and conclusions.
Experimental Design
The NCEP RSM is the model used in this study. A detailed model description and its application to Fig. 1. Regional model domain and orography (m).
772
Eun-Chul Chang and Song-You Hongregional climate are provided by Juang et al. (1997) and Hong and Leetmaa (1999), respectively. The spectral representation of the RSM is a two-dimensional cosine series for perturbations of pressure, divergence, temperature, and mixing ratio. A two dimensional sine series is used for the vorticity perturbation field.
Linear computations, such as horizontal diffusion and semi-implicit adjustment, are only considered as perturbations. Therefore, the error due to the reevaluation of the linear forcing from the base fields by the regional model is eliminated. An addition to Hong and Leetmaa (1999) is a revised nonlocal
diffusion scheme, the Yonsei University (YSU) scheme (Hong et al., 2006). As a spectral nudging technique, the revised Scale Selective Bias Correction (SSBC) method is applied. The SSBC (Kanamaru and Kanamitsu, 2007; Kanamitsu et al., 2010) was revised by Chang and Hong (2011) to consider a vertically weighted damping coefficient, which gives more freedom in the lower atmospheric levels. This model has been widely evaluated over East Asia and produced successful results in reproducing summer monsoon precipitation over the region (Yhang and Hong, 2008; Kanamitsu et al., 2010). It has been Fig. 2. Seasonally averaged precipitation (mm d−1) during 1980~2000 from (a) CMAP observation and (b) RSM_20C experi- ment for JJA. (c) and (d) are same as (a) and (b) but for DJF.
employed as a useful research tool in understanding precipitation mechanisms embedded within the East Asian monsoon (Kang and Hong, 2008; Koo and Hong, 2010).
Figure 1 shows the simulation domain of the RSM, which is the CORDEX East Asian domain with a horizontal grid spacing of approximately 50 km (0.44 degrees). The number of grid points is 241 (west-east) by 198 (north-south). The number of vertical layers is 28 on terrain-following sigma coordinates. European Centre Hamburg Version 5 (ECHAM5; Roeckner et al., 2003) model simulations which have a spatial resolution of T63 (corresponding to a resolution of 1.875o×1.875°) for current and future climate are used for atmospheric initial and lateral boundary data.
ECHAM5 future climate simulation follows the A1B scenario of IPCC AR4. The IPCC A1B scenario is a continuation of the historic anthropogenic simulation reflecting a future scenario with an integrated world that is growing quickly with a global population that reaches 9 billion in 2050 and then gradually declines, which is converging socially and economically across regions (Stott et al., 2006).
The RSM is integrated during 23-years from 1978 to 2000 for current climate (hereafter; RSM_20C) and 33-years from 2038 to 2070 for future climate (hereafter; RSM_A1B). The first 2 years of each simulation are considered as spin-up, and they are excluded for analysis. Model simulated precipitation of current climate is compared with the Climate Prediction Center (CPC) Merged Analysis of Precipitation (CMAP; Xie and Arkin, 1997). The Climate Research Unit (CRU) precipitation data (Mitchell and Jones, 2005) is also used to evaluate model simulated precipitation over continental regions. The CRU
precipitation data is a monthly, station based data set with a resolution of 0.5o×0.5o (http://www.cru.uea.ac.uk/
cru/data/hrg/cru_ts_2.10).
Evaluation of Current Climate Run
In this section, assessment of the RSM downscaled fields is performed to confirm that the RSM can properly reproduce current climate. When the regional climate model presents evidence of skillful simulation, comparisons between the produced future climate results with the simulated current climate fields are meaningful. Figure 2 shows the seasonally averaged precipitation fields from the CMAP observation and the RSM_20C runs for June-July-August (JJA) and December-January-February (DJF) during the analysis period (1980-2000). Note that the DJF of a given year means the period from December of that year to February of the next year. The observed feature in JJA shows the tropical rainfall bands over the Bay of Bengal, the South China Sea, and the equatorial western Pacific. The East Asian summer monsoon rainfall band is shown over southern China, the Table 1. Pattern correlation coefficient (PC) and root mean square error (RMSE) scores of simulated precipitation (mm d−1) and 2 m temperature from the RSM_20C experiment to the CMAP and CRU observations for 1980-2000. Values in parentheses for 2 m temperature are calculated exclusive of the Tibetan Plateau
Variable Precipitation 2 m Temperature
Observation CMAP CRU CRU
JJA PC 0.62 0.76 0.93 (0.95)
RMSE 3.95 2.89 3.47 (2.08)
DJF PC 0.76 0.81 0.98 (0.98)
RMSE 3.49 2.02 4.47 (3.76)
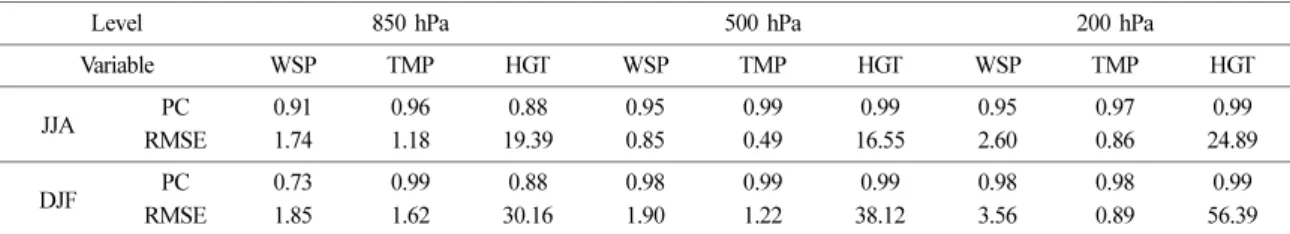
Table 2. Pattern correlation coefficient (PC) and root mean square error (RMSE) scores of simulated wind speed (ms−1), temperature (K), and geopotential height (gph) from the RSM_20C experiment to the ECHAM5 fields for 1980-2000
Level 850 hPa 500 hPa 200 hPa
Variable WSP TMP HGT WSP TMP HGT WSP TMP HGT
JJA PC 0.91 0.96 0.88 0.95 0.99 0.99 0.95 0.97 0.99
RMSE 1.74 1.18 19.39 0.85 0.49 16.55 2.60 0.86 24.89
DJF PC 0.73 0.99 0.88 0.98 0.99 0.99 0.98 0.98 0.99
RMSE 1.85 1.62 30.16 1.90 1.22 38.12 3.56 0.89 56.39
774
Eun-Chul Chang and Song-You HongKorean peninsula, and Japan (Fig. 2a). The intensities of the simulated rainfall from the RSM_20C run for JJA are stronger than those of the CMAP observation (Fig. 2b), but the overall features of the RSM_20C simulation are similar to the observation. Observed precipitation bands in DJF are dominant over the tropical regions of the Southern Hemisphere, which are the southern Indian Ocean, the northern Australian maritime and the southwestern Pacific region (Fig.
2c). Simulated precipitation from the RSM_20C run in
DJF is stronger over the southern tropical maritime.
Simulated East Asia winter monsoon precipitation which extends from the Eastern China Sea to Japan is excessive compared to the observation (Fig. 2d).
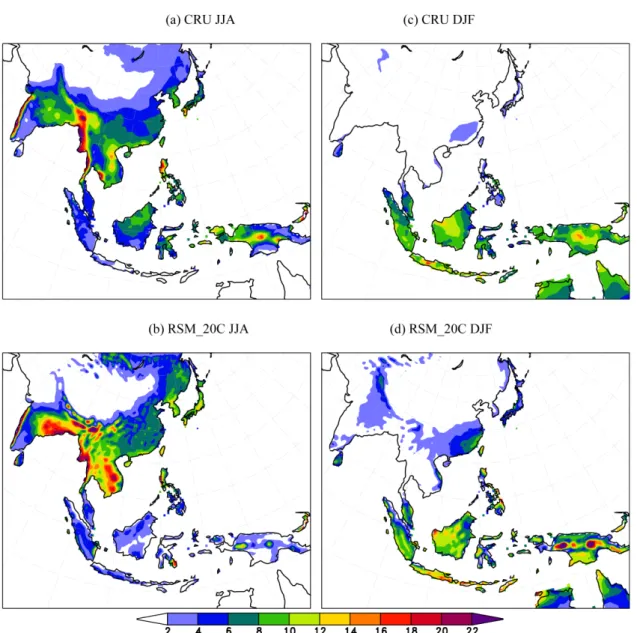
Figure 3 presents the same comparison of precipitation patterns shown in Figure 2, but the CMAP observation is replaced by the CRU dataset.
The CRU observation is available only over continents. However, it has higher spatial resolution (0.5o×0.5o) than the CMAP data (2.5o×2.5o). The JJA Fig. 3. Seasonally averaged precipitation (mm d−1) during 1980~2000 from (a) CRU observation and (b) RSM_20C experiment for JJA. (c) and (d) are same as (a) and (b) but for DJF.
precipitation of the CRU has stronger intensities than in the CMAP observation. It is shown that strong rainfall patterns are detected over the western side of India and Indochina for both the CRU and the RSM_20C run, which is not distinctly detected in CMAP. For the boreal winter season, the CRU dataset shows a larger precipitation amount than the CMAP data over the maritime-continent region. These comparisons of simulated precipitation with the CRU observation support that the strong precipitation from the RSM_20C run with respect to the CMAP data is caused by the higher resolution of the regional model and it is not erroneous, even though the simulated precipitation is still stronger than the CRU observation.
Evaluation of the simulated precipitation from RSM_20C, which is presented above, is summarized in Table 1. The pattern correlations (PC) and root mean square error (RMSE) scores show that the RSM runs are better for winter season for both of the observation datasets, and the observed precipitation features are sufficiently explained by the downscaled fields. Assessments for ground temperature at the 2 m level are also given in Table 1. Simulated ground temperature in DJF is better than in JJA, but the JJA simulation is quite good, with a correlation of 0.93 with respect to the CRU dataset. The RMSEs of
ground temperature are slightly large, at 3.47 and 4.47 for JJA and DJF, respectively. A large portion of the temperature bias to the observations is found over the Tibetan Plateau. The PC and RMSE scores are improved when this region is excluded for evaluation (given in parentheses in Table 1).
Evaluations of other atmospheric fields are also performed (Table 2). PC and RMSE scores are calculated for wind speed, temperature and geopotential height fields at 850, 500 and 200 hPa levels. In the mid and upper levels, these atmospheric fields are well reproduced as all the PCs are over 0.95. Simulated fields in the lower level are also well downscaled, even though the PCs are smaller than those of the upper atmosphere. If these scores are compared to those of Chang and Hong (2011), one can find that these scores indicate the good performance of the RSM simulation.
Future Climate Changes
Analyses of projected future climate downscaled by the RSM from the ECHAM5 simulation for the A1B emission scenario are performed from 2040 to 2070.
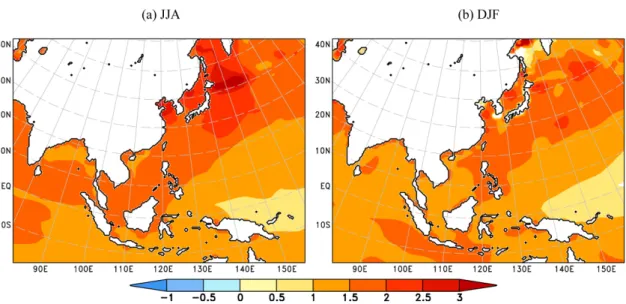
Figure 4 shows the mean field changes of sea surface temperature (SST) between the simulated current and Fig. 4. SST (K) differences of A1B period mean minus 20C period mean for (a) JJA and (b) DJF. Shaded values mean that they exceed 95% significance level.
776
Eun-Chul Chang and Song-You Hongfuture climates. For JJA and DJF, the entire maritime region shows warming trends for mean fields. It is shown that SSTs over East Asia are much impacted by global warming for both the summer and winter seasons. Particularly, the summer SST increments around Korea and Japan are much stronger than those of other oceans.
Figure 5 shows the seasonally averaged precipitation field of the RSM_A1B run for JJA and DJF. General features of precipitation in the summer and winter seasons are not much different from those of the 20C
run. To identify future climate changes with respect to current climate, the differences of mean precipitation between the RSM_A1B run and the RSM_20C run are presented in Fig. 5(c, d). In the summer season (JJA), the rainfall increase is clearly seen over the Indian Ocean, the Borneo Sea, the western equatorial Pacific, and Japan. In DJF, precipitation is increased over the tropical Indian Ocean, the maritime-continents and the western North Pacific, and decreased over the eastern tropical Indian Ocean. For the East Asia region (red boxed area in Fig. 5a and 5b), few Fig. 5. Seasonally averaged precipitation (mm d−1) during 2040~2070 from RSM_A1B experiment for (a) JJA and (b) DJF. Dif- ferences of seasonally averaged precipitation (mm d−1) of the RSM_A1B run from the RSM_20C run for (c) JJA and (d) DJF.
Closed contours in (c) and (d) indicate the 95% significance level.
significant changes are detected in precipitation.
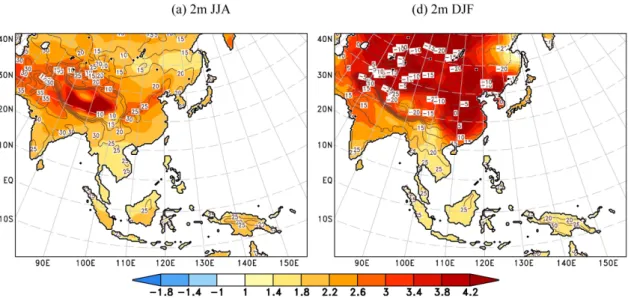
Figure 6 shows ground temperature changes at the 2 m level. One can clearly see the increasing ground temperature for future climate. The increments are much stronger in the winter season. For summer time, warming is strong over the areas of northwest India and central China. In winter, the northern region above 30oN over the Asian continent shows a strong warming trend. Precipitation and ground temperature have a great impact on human societies. Thus, we perform variability analyses of these variables over East Asia in interannual time scale. To investigate this issue, interannual time-series of precipitation and ground temperature (at 2 m) which are averaged for the East Asia region (red box in Fig. 4a, b) are presented in Fig. 7. Precipitation in JJA does not show clear decadal changes until 2050. But, the trend of rainfall is clearly an increasing pattern after 2050.
For winter season precipitation, no dominant characteristics in future climate are seen. For ground temperature fields, much more distinct changes are detected than in the precipitation field. For both JJA and DJF, clear monotonic increasing trends are captured in the future climate simulation. In JJA, the mean values of the temperature are 22.1 and 24.3 for current and future climate, respectively. In DJF, the
temperature changes are more clear, with period mean values of −8.5 and −4.6 for the RSM_20C and RSM_A1B simulations, respectively. This means that surface warming is one of the major responses of the global warming scenario and that the impact of global warming is more distinct in the winter season.
However, it does not mean that the surface warming is directly connected to the increase of precipitation over East Asia.
Figure 8 shows the seasonal mean field of temperature of the RSM_A1B and the differences between the simulated current and future climates. The outstanding feature of the atmospheric temperature is the warming trend. For JJA, warming is strong over the Asian continent from 30oN to 40oN in the lower level (Fig. 8a). In the upper level, summer season air temperature warming is strong in the lower latitudes (Fig. 8b). For DJF, the atmospheric response to global warming is similar to that of ground temperature, which is remarkable over the Asian continent in the lower level (Fig. 8c). In the upper level, the DJF warming trend is similar to JJA, but it is weaker in higher latitude regions.
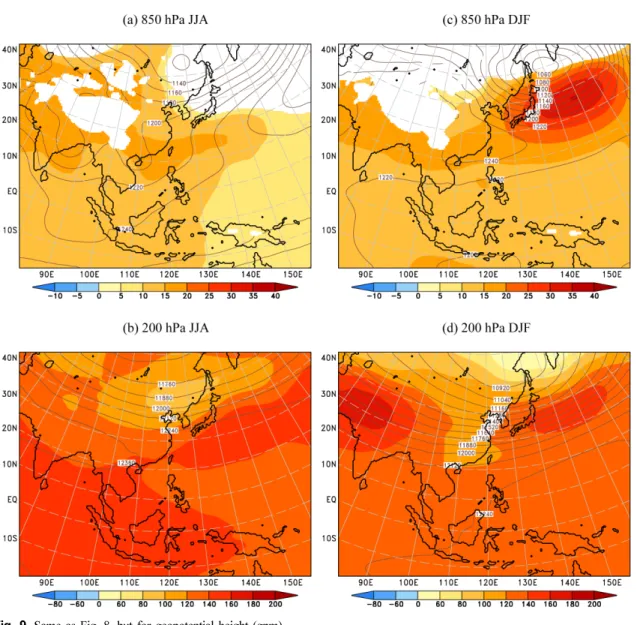
Figure 9 provides the response of geopotential height changes to the atmospheric warming. The JJA geopotential height field at 850 hPa shows height Fig. 6. Temperature (K) differences of A1B period mean minus 20C period mean for (a) JJA and (b) DJF at the 2 m level.
Shaded values mean they exceed 95% significance level.
778
Eun-Chul Chang and Song-You Hongincreasing over India, the Tibetan Plateau and the South and East China Seas. In Fig. 9b, the height increase is relatively weak over the northeast China region and strong over the Indian Ocean and the maritime-continent region. In DJF, the lower level trough which centered over the Sea of Okhotsk is weakened (Fig. 9c). The winter season upper level trough is strengthened by the gradient of height
increase which is weak over the core region of the trough and strong over northwestern India and eastern Japan.
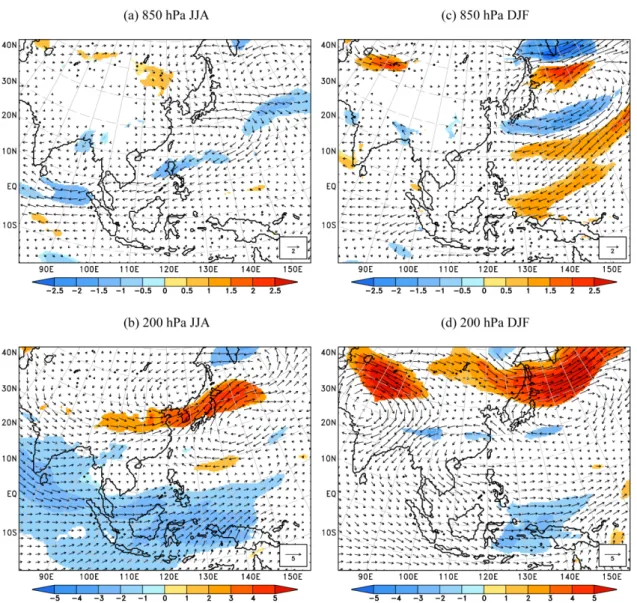
Wind field differences are presented in Fig. 10. In JJA, anti-cyclonic flows are captured at 850 hPa over the tropical Indian Ocean and the South China Sea.
The future climate upper level JJA wind field shows the intensified East Asian Jet stream and the westerlies over the Indian Ocean and the maritime- continent region which reduce the trade wind belt.
These differences are close to the height increase as described in Fig. 9. In winter, the reduced trough over the Sea of Okhotsk at 850 hPa generates anti-cyclonic flows over eastern Japan which reduces wind speed over southeastern Japan and enhances wind speed over the western Pacific. The strengthened trough at the 200 hPa level in DJF shows the enhanced Jet stream which extends from central Asia to Northeast Asia.
Concluding Remarks
In this study, we performed a downscaling of the ECHAM5 simulated dataset for current and future climate, produced under the SRES emission scenario A1B by utilizing the NCEP RSM. For the current climate downscaling, the RSM is properly able to reproduce the climatological fields. Future climate change is presented by the differences of the future climate simulation from the current climate run. In summer season (JJA), rainfall is increased over the areas of Indian Ocean, the Borneo Sea, the western equatorial Pacific, and Japan. In DJF, precipitation is increased over the tropical Indian Ocean, the maritime-continents and the Western North Pacific.
For the East Asia region, few significant changes are detected in the precipitation climatological field. The time variability of the summer precipitation over East Asia is not very different for the 2040-2050 period in comparison with the 1980-2000 period. However, rainfall after 2050 shows increasing trend over this region. Winter precipitation shows that the future climate has similar mean and variability with respect to the current climate. The ground temperatures of the Fig. 7. Area averaged time series of precipitation (mm d−1)
for (a) JJA and (b) DJF, 2m temperature for (c) JJA and (d) DJF, over Northeast Asia (red box in Fig. 3a and 3b).
future climate simulation show a clear increase by about 2 and 4 K for JJA and DJF mean, respectively.
Atmospheric temperature fields are increased over almost the entire domain of the regional model. In response to the warming, geopotential height is also increased, which strengthens the upper level trough.
These future climate changes of the summer season produce the intensified East Asian Jet and weakened trade wind belt over the Indian Ocean and the maritime-continent region in the upper level. The low level cyclonic structure over the Sea of Okhotsk is
weakened in the winter season, which enhances winds over the western Pacific. In the upper level, the Jet stream which extends from Central to Northeast Asia is intensified.
The IPCC A1B scenario assumes a balanced use of all energy sources. Thus, this scenario does not suppose extreme changes in future climate. Nevertheless, the atmospheric fields experienced significant warming and a strengthened trough system over East Asia under the A1B scenario. This may reflect that the East Asian monsoon system, which is one of the most Fig. 8. Seasonally averaged temperature (K) field of the RSM_A1B (contour) and its differences (K) of the RSM_A1B mean from the RSM_20C mean (shaded) at (a) 850 hPa and (b) 200 hPa for JJA. (c) and (d) are the same as (a) and (b) but for DJF.
Shaded values mean they exceed 95% significance level.
780
Eun-Chul Chang and Song-You Hongactive components of the global climate system, is sensitively affected by global warming.
Acknowledgments
This work was funded by the Korea Meteorological Administration Research and Development Program under Grant RACS RACS 2010-2014. The use of the computing system from Korea Institute of Science and Technology Information (KISTI) is also greatly appreciated.
References
Adams, R.M., Hurd, B.H., Lenhart, S., and Leary, N., 1998, Effects of global climate change on agriculture:
An interpretive review. Climate Research, 11, 19-30.
Anandhi, A., Srinivas, V.V., Nanjundiah, R.S., and Kumar, D.N., 2008, Downscaling precipitation to river basin in India for IPCC SRES scenarios using support vector machine. International Journal of Climatology, 28, 401- 40.
Brotton, J. and Wall, G., 1997, Climate change and the Bathurst caribou herd in the Northwest Territories Canada. Climatic Change, 35, 35-52.
Fig. 9. Same as Fig. 8. but for geopotential height (gpm).
Cha, E.J., 2007, El Niño-Southern Oscillation, Indian Ocean Dipole Mode, a relationship between the two phenomena, and their impact on the climate over the Korean Peninsula. Journal of Korean Earth Science Society, 28, 35-44.
Chang, E.C. and Hong, S.Y., 2011, Spectral nudging sensitivity experiments. Tellus, in review.
Cohen, S.J., Miller, K.A., Hamlet, A.F., and Avis, W., 2000, Climate change and resource management in the Columbia River basin. Water International, 25, 253-272.
Darwin, R.F., Tsigas, M., Lewandrowski, J., and Raneses, A., 1995, World agriculture and climate change.
Economic Adaptations Agricultural Economic Report
Number 703, US Department of Agriculture Economic Research Service, 100 p.
Ferguson, M.A.D., 1999, Arctic tundra caribou and climatic change: Questions of temporal and spatial scales.
Geoscience Canada, 23, 245-252.
Giorgi, F., Hurrell, J.W., Marinucci, M.R., and Beniston, M., 1997, Elevation dependence of the surface climate change signal: A model study. Journal of Climate, 10, 288-296.
Gosain, A.K., Sandhya, R., and Debajit, B., 2006, Climate change impact assessment on hydrology of Indian river basins Special Section: Climate Change and India.
Current Science, 90, 346-353.
Fig. 10. Wind difference (m s−1, vectors) and wind speed differences (m s−1, shaded) of A1B period mean minus 20C period mean at (a) 850 hPa and (b) 500 hPa for JJA. (c) and (d) are the same as (a) and (b) but for DJF. Wind speed differences over 95% significance level are shaded.
782
Eun-Chul Chang and Song-You HongHamilton, L.S., 1995, Mountain cloud forest conservation and research: A synopsis. Mountain Research and Development, 15, 259-266.
Hong, S.Y. and Leetmaa, A., 1999, An evaluation of the NCEP RSM for regional climate modeling. Journal of Climate, 12, 592-609.
Hong, S.Y., Noh, Y., and Dudhia, J., 2006, A new vertical diffusion package with an explicit treatment of entrainment processes. Monthly Weather Review, 134, 2318-2341, doi:10.1175/MWR3199.1.
Hong, S.Y., Moon, N.K., Lim, K.S.S., and Kim, J.W., 2010, Future climate change scenarios over Korea using a Multi-Nested Downscaling System: A pilot study.
Asia-Pacific Journal of Atmospheric Sciences, 46, 425- 435.
Hurkmans, R., Terink, W., Uijlenhoet, R., Torfs, P., Jacob, D., and Troch, P.A., 2010, Changes in streamflow dynamics in the Rhine basin under three high-resolution regional climate scenarios. Journal of Climate, 23, 679- 699.
IPCC, 2007, Climate Change 2007: The physical science basis. IPCC, 996 p.
Juang, H.M.H., Hong, S.Y., and Kanamitsu, M., 1997, The NCEP Regional Spectral Model: An update. Bulletin of the American Meteorological Society, 78, 2125-2143.
Kanamaru, H. and Kanamitsu, M., 2007, Scale-selective bias correction in a downscaling of global analysis using a regional model. Monthly Weather Review, 135, 334-350.
Kanamitsu, M., Yoshimura, K., Yhang, Y.B., and Hong, S.Y., 2010, Errors of interannual variability and trend in dynamical downscaling of reanalysis. Journal of Geophysical Research, 115, D17115, doi:10.1029/
2009JD013511.
Kang, H.S. and Hong, S.Y., 2008, An assessment of the land surface parameters on the simulated regional climate circulations: The 1997 and 1998 east Asian summer monsoon cases. Journal of Geophysical Research, 113, D15121, doi:10.1029/2007JD009499.
Kirilenko, A.P. and Solomon A.M., 1998, Modeling dynamic vegetation response to rapid climate change using bioclimatic classification. Climatic Change, 38, 15-49.
Kleinn, J., Frei, C., Gurtz, J., Lüthi, D., Vidale, P.L., and Schär, C., 2005, Hydrologic simulations in the Rhine basin driven by a regional climate model. Journal of Geophysical Research, 110, D04102, doi:10.1029/
2004JD005143.
Koo, M.S. and Hong, S.Y., 2010, Diurnal variations of simulated precipitation over East Asia in two regional climate models. Jounal of Geophysical Research, 115, D05105, doi:10.1029/2009JD012574.
Krasovskaia, I., 1995, Quantification of the stability of
river flow regimes. Hydrological Sciences Journal, 40, 587-598.
Kwadijk, J.C.J. and Rotmans, J., 1995, The impact of climate change on the river Rhine: A scenario study.
Climatic Change, 30, 397-425.
Lee, H.S., Jhun, J.G., Kang, I.S., and Moon, B.K., 2007, Characteristics of atmospheric circulation over east asia associated with unusual climate of Korea in winter 2006/2007. Journal of Korean Earth Science Society, 28, 374-387.
Menzel, L., Thieken, A., Schwandt, D., and Bürger, G.
2006, Impact of climate change on the regional hydrology - scenario-based modeling studies in the German Rhine catchment. Natural Hazards, 38, 45-61.
Miller, J.R., Dixon, M.D., and Turner, M.G., 2004, Response of avian communities in large-river floodplains to environmental variation at multiple scales. Ecological Applications 14, 1394-1410.
Mirza, M.Q., Warrick, R.A., Ericksen, N.J., and Kenny, G.J., 1998, Trends and persistence in precipitation in the Ganges Brahmaputra and Meghna Basins in South Asia. Hydrological Sciences Journal, 43, 845-858.
Mitchell, T.D. and Jones, P.D., 2005, An improved method of constructing a database of monthly climate observations and associated high-resolution grids.
International Journal of Climatology, 25, 693-712.
doi:10.1002/joc.1181.
Oh, S.G., Suh, M.S., Myoung, J.S., and Cha, D.H., 2011, Impact of boundary conditions and cumulus parameterization schemes on regional climate simulation over South-Korea in the CORDEX-East Asia domain using the RegCM4 model. Journal of Korean Earth Science Society, 32, 373-387.
Pounds, J.A., Fogden, M.P.L., and Campbell, J.H., 1999, Biological response to climate change on a tropical mountain. Nature, 398, 611-615.
Reynard, N.S., Prudhomme, C., and Crooks, S.M., 1998, The potential impacts of climate change on the flood characteristics of a large catchment in the UK.
Proceedings of the Second International Conference on Climate and Water Espoo Finland August 1998.
Helsinki University of Technology, Helsinki, Finland, 320-332.
Risbey, J.S. and Entekhabi D., 1996, Observed Sacramento Basin streamflow response to precipitation and temperature changes and its relevance to climate impact studies. Journal of Hydrology, 184, 209-223.
Roeckner, E., Bäuml, G., Bonaventura, L., Brokopf, R., Esch, M., Giorgetta, M., Hagemann, S., Kirchner, I., Kornblueh, L., Manzini, E., Rhodin, A., Schlese, U., Schulzweida, U., and Tompkins, A., 2003, The atmospheric general circulation model ECHAM5, Part I:
model description. Technical Report 349, Max Planck
Institute for Meteorology, 140 p.
Selvaraju, R., 2003, Impact of El-Nino–southern oscillation on Indian foodgrain production. International Journal of Climatology, 23, 187-206.
Stott, P.A., Jones, G.S., Lowe, J.A., Thorne, P., Durman, C., Johns, T.C., and Thelen, J.C., 2006, Transient climate simulations with the HadGEM1 climate model:
Causes of past warming and future climate change.
Journal of Climate, 19, 2763-2782. doi:10.1175/
JCLI3731.1
Sun, W.Y., Min, K.H., and Chern, J.D., 2011, Numerical study of 1998 late summer flood in East Asia. Asia- Pacific Journal of Atmospheric Sciences, 47, 123-135.
Tyler, M.J., 1994, Climatic change and its implications for the amphibian fauna. Transactions of the Royal Society of South Australia, 118, 53-57.
Vicente-Serrano, S.M. and Lopez-Moreno, J.I., 2006, The
influence of atmospheric circulation at different spatial scales on winter drought variability through a Semi- Arid Climatic Gradient in Northeast Spain. International Journal of Climatology, 26, 1427-1453.
Xie, P. and Arkin, P.A., 1997, Global precipitation: A 17- yr monthly analysis based on gauge observations, satellite estimates, and numerical model output. Bulletin of the American Meteorological Society, 78, 2539-2558.
Yaning, C., Kuniyoshi, T., Changchun X., Yapeng C., and Zongxue X., 2006, Regional climate change and its effects on river runoff in the Tarim basin China.
Hydrological Processes, doi:10.1002/hyp6200.
Yhang, Y.B. and Hong, S.Y., 2008, A simulated climatology of the East Asian summer monsoon using a Regional Spectral Model. Asia-Pacific Journal of Atmospheric Sciences, 44, 325-339.
2011년 11월 29일 접수 2011년 12월 13일 수정원고 접수 2011년 12월 14일 채택