말소리와 음성과학 제4권 제3호 (2012) pp. 75~83
Reduction and Frequency Analyses of Vowels and Consonants in the Buckeye Speech Corpus
Yang, Byunggon
1)ABSTRACT
The aims of this study were three. First, to examine the degree of deviation from dictionary prescribed symbols and actual speech made by American English speakers. Second, to measure the frequency of vowel and consonant production of American English speakers. And third, to investigate gender differences in the segmental sounds in a speech corpus. The Buckeye Speech Corpus was recorded by forty American male and female subjects for one hour per subject. The vowels and consonants in both the phonemic and phonetic transcriptions were extracted from the original files of the corpus and their frequencies were obtained using codes of a free software R. Results were as follows: Firstly, the American English speakers produced a reduced number of vowels and consonants in daily conversation. The reduction rate from the dictionary transcriptions to the actual transcriptions was around 38.2%. Secondly, the American English speakers used more front high and back low vowels while three-fourths of the consonants accounted for stops, fricatives, and nasals. This indicates that the segmental inventory has nonlinear frequency distribution in the speech corpus. Thirdly, the two gender groups produced vowels and consonants similarly even though there were a few noticeable differences in their speech. From these results we propose that English teachers consider pronunciation education reflecting the actual speech sounds and that linguists find a way to establish unmarked segmentals from speech corpora.
Keywords: English, segmentals, vowels, consonants, frequency, speech corpus, markedness hypothesis
1. Introduction
In a casual conversation we often observe that American speakers tend to talk fast and to reduce or change sounds of phonetic symbols defined in an English dictionary which we would find in the productions of the citation style of speech (Ladefoged & Johnson, 2011) or lexical entry form (Lodge, 2009). The mismatch between the prescribed and actual pronunciation leads to the difficulty of Korean learners in the communication with American English speakers let alone the
1) Pusan National University, [email protected]
This study was supported by the Fund for Humanities &
Social Studies at Pusan National University 2011.
Received: July 25, 2012 Revised: August 24, 2012 Accepted: September 10, 2012
difficulty the learners face in acquiring new sound symbols which are not in the Korean sound system. Most Korean learners are generally trained to practice the prescribed pronunciation at school. One of the departure points of this study is to examine how much reduction of pronunciation from the dictionary symbols American English speakers make in a naturally elicited speech corpus. In a small speech corpus we are apt to make a biased conclusion because some people tend to use a limited set of words and phrases repeatedly to express their ideas or thoughts in daily conversations while others tend to elaborate their thoughts using various expressions on the same idea. However, when the speech corpus is large enough we would find some facts that could be applicable to English pronunciation education in general.
Recently many papers have been published on the word
frequency or discourse analysis of various types of corpora
through collecting vast amount of words in speech or
conversational texts (Bell, Brenier, Gregory, Girand & Jurafsky, 2009; Yaguchi, Iyeiri & Baba, 2010; Yoon, 2012). However, there are not many studies on the segmentals such as vowels and consonants of a speech corpus (Johnson, 2003; Raymond, Dautricourt & Hume, 2006). The lack of research may be attributed to the difficulty of collecting sufficient data from speakers and transcribing appropriately the actual pronunciation of the speech corpus. The transcription requires both trained listeners and appropriate softwares to confirm and label sounds, which requires a tremendous amount of time. Also the validity and reliability of the transcriptions should be maintained at a certain level in order to draw a meaningful conclusion.
Transcribers often place different symbols on the same data at different time, which leads to intertranscriber variability (Ball &
Rahilly, 1999). In addition, simple analyses on the speech or written texts may not reflect the frequency distribution of words that American English speakers use in daily conversations (Kim, 2009). Speech and writing are considered as separate media. For example, speech is spontaneous and forms a continuous stream while writing allows detailed planning and is done by conventions (see Table 1.1 of Lodge (2009) for the comparison).
The frequency distribution of vowels and consonants can be a useful guide to establish the universals across languages and may offer a chance to consider the markedness hypothesis in second language acquisition. The UPSID archive (Maddieson, 1984) provides a basis for determining the most frequent sound types in the world languages. Among consonants, 80% or more of languages have /p, t, k, m, n, s, j/. /k/ is relatively preferred.
Among vowels, /i, a, u/ form over 80% of the UPSID data, and /a/ is far more frequent than other vowels (Maddieson, 1992). A question arises whether the distribution holds true in daily conversations. Another interesting question may arise whether the distribution sheds light on the markedness hypothesis.
Eckman (2012) reviewed the principle of markedness pioneered by the Prague School of Linguistics in the theories of Trubetzkoy (1939) and Jakobson (1941). Trubetzkoy and Jakobson proposed a concept that in such binary oppositions as voiced and voiceless obstruents one member of the opposition can have a wider distribution within a given language or across the world’s languages and be designated as unmarked. The unmarked member can be simpler, more basic and more natural than the marked counterpart. Eckman (1977) proposed the Markedness Differential Hypothesis in that the area of difficulty that a language learner will have can be predicted from both
the difference and the relative degree of markedness.
Specifically he suggested that the areas of the target language with most different sounds may be difficult to acquire and furthermore the degree of difficulty can be predicted directly by the relative degree of markedness of the area of acquisition in a target language. Eckman posits that the notion of typological markedness may be directly related to language universals or the basic tenet of the Optimality Theory (Prince and Smolensky, 1993). OT uses the universal constraints which are divided into faithfulness and markedness constraints. Eckman focused on the frequency of occurrence across the world’s languages among the various approaches to, and definitions of, markedness (Battistella, 1990). This paper explores the frequency distribution of vowels and consonants in a speech corpus of American English and considers the notion of markedness. We expect that there will not be an even frequency distribution of vowels and consonants within a speech corpus and the notion may have to be revised in the second language learning. Simply we can predict that the more frequent vowels and consonants in daily conversations may yield more pronunciation errors by nonnative speakers.
The aims of this study are to examine the amount of reduction of phonetic symbols from a dictionary to the actual speech sounds and to analyze the frequency of vowels and consonants and to examine a gender difference in the segmental sounds in a speech corpus in order to understand general phonetic patterns of actual speech and to find pedagogical implications for Korean English learners. Specifically the author will focus on the following three research questions:
1. How much reduction of vowel and consonant sounds prescribed by an English dictionary do American English speakers make in their daily conversations?
2. Which vowels and consonants do American English speakers produce most in their daily conversations?
3. Is there any gender difference in the frequency distribution of vowels and consonants?
Results of this study may expand a linguistic understanding
of actual speech and be applicable to curriculum developments
and plans of English pronunciation education. For example,
English teachers may guide the Korean learners to practice
actual pronunciations or the teachers may place more frequently
used pronunciations at an earlier stage of learning.
2. Method
2.1 Subjects and the Buckeye Speech Corpus
Subjects of the Buckeye Speech Corpus were 40 white Caucasians who were born in the region of Columbus, Ohio (Kiesling, Dilley & Raymond, 2006). They formed two groups of male and female speakers (20 in each group). Each sex group consisted of a younger group under 30 and an older group over 40. The subjects were recruited from local newspaper ads or recommended by friends and neighbors and passed a screening test of dialect through a short telephone interview. The recording was made in a seminar room of the Ohio State University. A trained male postdoctoral researcher and a female graduate student interviewed each subject regarding his or her opinions on the campus life, politics, sports, transportation, etc. The interviewers led the conversation by raising questions on their responses or viewpoints. It lasted around 60 minutes per each subject. The recorded speech was transcribed using Soundscriber. The transcribed files were aligned and automatically labeled onto the actual pronunciation by ESPS aligner. Later trained graduate students corrected errors made by the aligner and applied some narrow transcriptions to such sound changes as nasalizations, glottalizations, flappings, etc. From a preliminary analysis of the corpus we found that the total number of the tokens except such exclamation sounds as um, uh, oh, and yeah was 268,500 and that of the types was 11,452 (Type to Token Ratio: 4.3%). The low ratio indicates that the American speakers made many repetitions of frequently used content and function words, which is typical in daily conversations.
2.2 Frequency and statistical analysis
The author extracted sound labels from 255 original files which listed signal information of each orthographic word, non-speech labels, two sets of phonemic or phonetic labels and part-of-speech tags. The following text in italic shows an excerpt from the original file of a transcribed speech recorded by s0101.
47.530873 122 lived; l ih v d; l ah v d; VBN 47.658958 122 in; ih n; ih n; IN
48.144502 122 columbus; k ow l ah m b ah s;
k l ah b ah s; NNP 48.311979 122 my; m ay; m ay; PRP$
48.737113 122 entire; eh n t ay er; eh n t eh r; JJ
49.021891 122 life; l ay f; l ay f; NN
49.287684 122 thirty; th er t iy; th er dx iy; CD 49.506014 122 four; f ow r; f ow; CD
50.171175 122 years; y ih r z; y eh r s; NNS
The first number in each line indicates a starting time point for the given token followed by 122 for a color type. Then, a word is given for each token. The following set of symbols are phonemic transcriptions of the sounds of the word defined in an English dictionary. The second set of symbols are phonetic transcriptions of the actual pronunciation of the speaker for the given word. The last label is a part-of-speech tag. In this paper, we will extract both the phonemic and phonetic transcriptions from the original files. The first set is referred to as the dictionary transcriptions; the second set as the actual transcriptions. This paper focuses on the differences in the two sets as well as the overall frequency distribution of vowels and consonants.
According to a description on the speech corpus, the actual transcriptions were carried out by the trained graduate students who watched spectrographic displays of each sound segment and automatically aligned and labeled phonetic symbols and listened to the sound at the same time. Interestingly, they used a limited set of notations. Specifically we can notice a vowel change from ih to ah in the first word "lived." The third line shows how they transcribed the schwa sound. The third syllable of the word
"columbus" was transcribed the same as that of the second stressed syllable. It may be considered a weakness of this study.
Nevertheless, the massive sound symbols of the speech corpus more than offset the weakness when we focus on the reduction.
We can see clearly the deletion of the first vowel and the nasal consonant in the second syllable of the actual pronunciation of the word. Also flapping occurred in the word "thirty".
General procedures of collecting frequency data were obtaining
transcribed sound symbols from the original files and counting
frequencies using R (2.14.0). From the collected folder, each file
was read from the 10th row to the end of the file. The first 10
rows indicated such header information of the selected file as
filename, type, comments, etc. Then, a matrix file of 3 columns
with the same number of the rows was created by collecting the
2nd and 4th columns of each file in order to obtain the frequency
of the dictionary transcriptions. The part-of-speech tags from the
4th column were used to screen non-phonetic symbols and
utterances with tags of "null" or "UH". Then, one phonetic symbol
was assigned to one row after breaking a number of symbols for
a word into each separate symbol. Some words have more than
one symbol in a row separated by spaces. Then, the number of vowel and consonant symbols within each file was counted by a function ‘table’ in R. The frequency analysis of the actual transcriptions was carried out by collecting the 3rd and 4th columns of the file modifying a line of the code for the dictionary transcriptions. The following R code shows the procedure described above.
library(reshape) path="C:/buckeye/"
setwd(path)
fnames=list.files(path=path) for (i in 1:length(fnames)) { linkf=paste(path,fnames[i], sep="") s1=read.delim(linkf)
sx=s1[10:nrow(s1),1]
sxch=as.character(sx)
spli=do.call("rbind", lapply(strsplit(sxch, ";"), as.character))
spli24=spli[,2:4]
spli24xr=spli24[!spli24[,2]==" null" & !spli24[, 2]==" UH"]
spli24xrone=spli24xr[1:length(spli24xr)/2]
spli24xrd=strsplit(spli24xrone, " ") spli24xrdmelt=melt(spli24xrd) attach(spli24xrdmelt) res=sort(table(value))
fnamespli=strsplit(fnames[i], ".words") resfname=paste(fnamespli, ".txt", sep="") resframe=as.data.frame(res, stringsAsFactors=F) colnames(resframe)=fnamespli
write.table(resframe, file=resfname, sep="\t") detach(spli24xrdmelt)
}
The preliminary frequency data files were moved into two separate folders of the male and female speakers. All the files of each folder were appended to one file using the following code.
path="C:/buckmale/"
setwd(path)
fnames=list.files(path=path) for (i in 1:length(fnames)) {
appendf=file.append("temp.txt", fnames[i]) }
The two appended files of the male and female speakers were opened in Microsoft Excel, and frequencies of phonetic symbols were sorted in an ascending order. Finally, the following R code was used to obtain the frequency distribution of phonetic symbols produced by each group of the male and female speakers.
numres=maleresult
sound=as.character(numres[1, 1]) freq=as.numeric(numres[1, 2]) for (i in 1:nrow(numres)) {
soundnext=as.character(numres[i+1, 1]) freqnext=as.numeric(numres[i+1, 2]) if (sound==soundnext)
{
freq=freq+freqnext }
else {
print(paste(i, " ", sound, " ", freq)) sound=soundnext
freq=freqnext }
}
print(paste(i, " ", sound, " ", freq))
Then, sums and percentage distributions of phonetic symbols
were calculated. Only phonetic symbols which were listed in
Tables 2 and 3 of the manual of the Buckeye Speech Corpus were
examined. While applying the code above, a few words or
non-phonetic symbols occurred (for example, filed, how, no, that,
to, etc), which seemed to be derived from the graduate
transcribers’ errors. A majority of the frequencies were mostly 2
and the others were in small numbers compared with the total
frequency of vowels and consonants, thus the author discarded
them from the final data. The syllabic symbols el and en were
classified as consonants. Also 38 h’s were added to the frequency
count of hh’s. The symbol Vn was classified as a vowel because
the manual specifically noted that nasalized vowels did not have
nasal segments. The vowels were grouped into front and back
vowels while the consonants were divided and discussed by the
manner and place of articulation.
Groups Vowels
Frequency in the dictionary
transcriptions
Frequency in the actual transcriptions
Front vowels
ih 165375 125286
iy 114472 66442
ae 90549 33359
eh 87937 70173
ey 57525 29583
ihn 524 1060
ehn 422 854
aen 355 763
iyn 156 286
eng 146 297
eyn 80 168
Sum
517541 328271
Back vowels
ah 185759 127882
ay 82138 46561
ow 73776 34807
uw 60220 22707
aa 50438 28676
er 45206 35009
aw 16917 9780
uh 14612 12055
Table 1. Phonetic categories and frequencies of the English vowels in the Buckeye Speech Corpus.
3. Results and Discussion
3.1 Total frequency distribution of sound symbols The total number of sound symbols in the Buckeye Speech Corpus was 2,638,882 in 60 phonetic categories for the dictionary transcriptions; and 1,631,010 in 61 phonetic categories for the actual transcriptions. The only additional category of the actual transcriptions was ern with 8 occurrences.
The total number of the vowels was 1,058,335 in 30 phonetic categories while that of the consonants was 1,580,547 in 30 phonetic categories. Interestingly the ratio of vowels to consonants in both the dictionary and actual transcriptions was almost the same, which might be attributable to the large scale of the corpus. The American English speakers produced more consonants than the vowels in their daily conversations. The percentage difference was 19.8%. That result is notable in the sense that the vowels and consonants should not be treated as having the same functional load in daily conversations. Is it simply because the number of consonants in the English pronunciation system exceeds that of vowels? It may not be the case since the phonetic categories in the current analyses for the vowels and consonants are almost comparable (30 each) including all the nasalized vowels. A plausible explanation can be made when one considers English syllable structures. We often observe that an English syllable is formed by a peak vowel preceded and followed by a consonant or consonant clusters. Even some syllabic consonants are produced without any intervening vowel. Also many unstressed vowels must have been deleted in the casual conversations. Thus the number of consonants in the actual conversations tends to exceed that of vowels in English.
When we consider the total number of the phonetic symbols in the dictionary transcriptions and that in the actual transcriptions, we can say that only 61.8% of the prescribed symbols in the dictionary was used in the actual productions of the subjects’ speech, which included all the phonological changes. There were many interesting phonological changes such as reductions or assimilations, but we will not pursue them in this paper. Segmentally the speakers produced 63.0% of the vowel symbols in the dictionary transcriptions while the same speakers did 61.0% of the consonant symbols in the same transcriptions. The 2% difference may be attributable to more phonological changes in consonants, which needs a further investigation. The results support the notion that the American speakers do not produce words fully as specified in the phonetic
symbols of a dictionary. When we consider the reduced pronunciation by almost 38.2%, we may have to adjust current education practice of English pronunciation to better suit to the actual pronunciation. One can easily expect a tremendous barrier in communication of nonnative speakers like the Korean learners. In other words, the learners who relied mostly on the phonetic symbols of an English dictionary will face much difficulty retrieving all the missing or changed vowels and consonants in daily conversations with American English speakers.
3.2 Frequency distribution of English vowels
<Table 1> lists phonetic categories and frequencies of the
English vowels in the Buckeye Speech Corpus. The vowels
were grouped into front and back vowels and sorted in a
descending order of frequency in the dictionary transcriptions
within each group.
ao 8504 16749
oy 1508 1027
own 678 1330
ahn 564 1092
aan 162 318
awn 98 164
ayn 90 152
aon 68 114
oyn 26 66
uwn 16 34
uhn 14 22
ern 8
Sum
540794 338553
Manner Conso- nants
Frequency in the dictionary transcriptions
Frequency in the actual transcriptions
Stops
t 178616 67610
d 104495 46561
k 83338 54141
b 49882 31854
p 41293 27710
g 28792 19449
Table 2. Phonetic categories and frequencies of the English consonants in the Buckeye Speech Corpus.
Table 1 shows a similar frequency distribution of front and back vowels. The front vowels in the dictionary transcriptions account for 48.9% of the total number of the vowels while the back vowels in the same transcriptions do 51.1%. The percentage difference between the two groups is 2.2%. Similarly the ratio of the front and back vowels in the actual transcriptions is 49.2% to 50.8% with a percentage difference of 1.6%. Thus, we can say that the American speakers had used vowel groups similarly in front and back dimensions with a slightly higher frequency in the back dimension. Since there exists not much proportionate difference between the dictionary and actual transcriptions, we will discuss mainly the frequency distribution of individual vowels in the actual transcriptions.
Among the front vowels, the highest frequency was observed in the front vowel ih (18.8%) followed by the vowels eh (10.5%) and iy (10.0%). The lower two vowels ae and ey account for around 5%. Among the back vowels, the highest proportion occurred in the vowel ah (17.6%) followed by the diphthongs ay (7.8%) and ow (7.0%). We observed that /a/ was the most frequent vowel in the UPSID data (Maddieson, 1992). The proportion of the vowel uw was 5.7% while the lax counterpart was 1.4%. The proportion of the nasalized vowels in the front group was 0.3% in the dictionary transcriptions and 1% in the actual transcriptions. The same proportion of the nasalized vowels was observed in the back vowels. All the nasalized vowels account for just a fraction of the daily conversation.
Now we will examine how much reduction of the vowels occurred from the dictionary transcriptions to the actual transcriptions in detail. We noted an overall 38.2% reduction of
vowels in the previous section. Interestingly the ratio between the two groups maintained almost the same distribution in both the dictionary and actual transcriptions (less than 1% reduction).
The reduction rate was 36.6% for the front vowels while that was 37.4% for the back vowels. The nasalized vowels will not be discussed here because they accounted for rather a negligible frequency distribution. Among the front vowels, the vowel ae showed the highest reduction rate (63.2%) followed by ey (48.6%) and the tense vowel iy (42%). The vowels eh and ih were not reduced much (20.2% and 24.2%). The higher reduction rate for the tense and corner vowels might be related to more demanding articulatory movements while maintaining a fast speech mode. Similarly, among the back vowels, we observe the highest reduction in the corner vowel uw (62.3%) which requires a lip rounding gesture, followed by the diphthong ow (52.8%) and ay (43.3%). The vowel ao was increased by 97% but the frequency in the corpus was small (1.6% in the dictionary transcriptions and 4.9% in the actual transcriptions) compared with the total frequency of the back vowels. The smallest reduction was seen in the vowel uh (17.5%). Considering the reduction rates in the corner vowels, the higher reduction rate for the round vowel uw might be related to the laborious lip rounding gesture in a fast speech style. However, further studies on the gestural costs of corner vowels and round back vowels are necessary to attempt any such explanation.
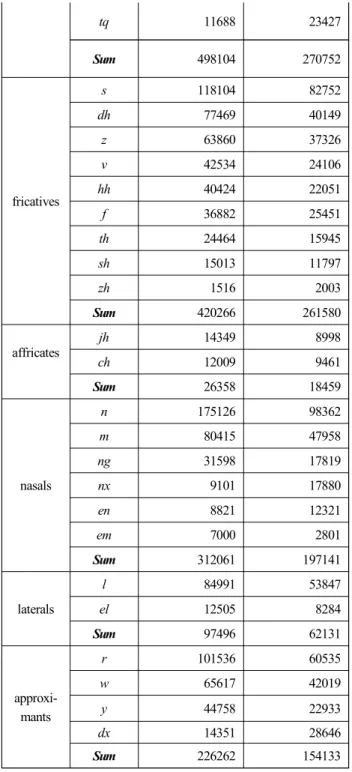
3.3 Frequency distribution of English consonants
Table 2 lists phonetic categories and frequencies of the
English consonants in the corpus. The consonants were grouped
by the manner of articulation and sorted in a descending order
of frequency in the dictionary transcriptions within each group.
tq 11688 23427
Sum
498104 270752
fricatives
s 118104 82752
dh 77469 40149
z 63860 37326
v 42534 24106
hh 40424 22051
f 36882 25451
th 24464 15945
sh 15013 11797
zh 1516 2003
Sum
420266 261580
affricates
jh 14349 8998
ch 12009 9461
Sum
26358 18459
nasals
n 175126 98362
m 80415 47958
ng 31598 17819
nx 9101 17880
en 8821 12321
em 7000 2801
Sum
312061 197141
laterals
l 84991 53847
el 12505 8284
Sum
97496 62131
approxi- mants
r 101536 60535
w 65617 42019
y 44758 22933
dx 14351 28646
Sum
226262 154133
From Table 2, we observed that the percentage proportion of consonants grouped into the categories by the manner of articulation was quite similar between the dictionary and actual transcriptions. Thus, we will examine mainly the proportion of each group in the actual transcriptions. The stops account for 28.1% of the total frequency of the consonants followed by the fricatives (27.1%) and nasals (20.5%). All the three major categories account for 75.7% of the frequency of all the consonants. The consonantal results generally agree to the UPSID archive (Maddieson, 1984). The approximants recorded
16.0% and the affricates and laterals together did 8.3%.
The highest frequency among all the consonants was found in the fricative s (8.6%) followed by t (7.1%), which are produced at alveolar regions in the mouth. The frequency rank was reversed in the dictionary transcriptions. The original consonant t in the dictionary transcriptions was changed into a flap or reduced when it is not stressed between sonorant symbols or in the syllable coda. The alveolar consonants n and l listed 10.2%, and 5.6%, respectively. The voiced equivalents of those consonants also showed almost half of the proportion.
Figure 1 illustrates the distribution of consonants grouped by the place of articulation (Yang, 2008).
bilabial labiodental dental alveolar postalveolar palatal velar glottal
Percent (%) of total consonants
0 10 20 30 40 50 60 70