INTRODUCTION
The patterns of healthcare utilization change in infectious dis-
ease outbreaks. Identifying the patterns of change is impor- tant for future preparedness and response. The effects on healthcare utilization of infectious disease epidemic depend on the characteristics of an infection. In the 2003 severe acute respiratory syndrome (SARS) epidemic in Taiwan, medical service utilization decreased due to fear of nosocomial trans- mission.1,2 However, in the 2009 pandemic of H1N1 influenza, which is highly infectious but has a low case-fatality rate, emer- gency care utilization increased.3,4
In 2015, South Korea (hereafter “Korea”) experienced an epidemic of Middle East respiratory syndrome (MERS). In a vulnerable healthcare delivery system in which the gatekeep- er function of primary clinics was weak, the first patient wan- dered through several different hospitals before being diag-
Impact of the 2015 Middle East Respiratory Syndrome Outbreak on Emergency Care Utilization and Mortality in South Korea
Sun Young Lee
1,2, Young-Ho Khang
1,3, and Hwa-Kyung Lim
31Department of Health Policy and Management, Seoul National University College of Medicine, Seoul;
2Department of Emergency Medicine, Seoul National University Hospital, Seoul;
3Institute of Health Policy and Management, Seoul National University Medical Research Center, Seoul, Korea.
Purpose: In May 2015, South Korea experienced an epidemic of Middle East respiratory syndrome (MERS). This study investigat- ed the impacts of MERS epidemic on emergency care utilization and mortality in South Korea.
Materials and Methods: A natural experimental study was conducted using healthcare utilization and mortality data of the entire Korean population. The number of monthly emergency room (ER) visits was investigated to identify changes in emergency care utilization during the MERS epidemic; these trends were also examined according to patients’ demographic factors, disease severi- ty, and region. Deaths within 7 days after visiting an ER were analyzed to evaluate the impact of the reduction in ER visits on mor- tality.
Results: The number of ER visits during the peak of the MERS epidemic (June 2015) decreased by 33.1% compared to the average figures from June 2014 and June 2016. The decrease was observed in all age, sex, and income groups, and was more pronounced for low-acuity diseases (acute otitis media: 53.0%; upper respiratory infections: 45.2%) than for high-acuity diseases (myocardial infarctions: 14.0%; ischemic stroke: 16.6%). No substantial changes were detected for the highest-acuity diseases, with increases of 3.5% for cardiac arrest and 2.4% for hemorrhagic stroke. The number of deaths within 7 days of an ER visit did not change signifi- cantly.
Conclusion: During the MERS epidemic, the number of ER visits decreased in all age, sex, and socioeconomic groups, and de- creased most sharply for low-acuity diseases. Nonetheless, there was no significant change in deaths after emergency care.
Key Words: Middle East respiratory syndrome (MERS); emergency service, hospital; communicable diseases, emerging;
disaster planning
pISSN: 0513-5796 · eISSN: 1976-2437
Received: March 21, 2019 Revised: June 1, 2019 Accepted: June 20, 2019
Corresponding author: Sun Young Lee, MD, MS, Department of Emergency Medi- cine, Seoul National University Hospital, 101 Daehak-ro, Jongno-gu, Seoul 03080, Korea.
Tel: 82-2-2072-0294, Fax: 82-2-741-7855, E-mail: [email protected]
•The authors have no potential conflicts of interest to disclose.
© Copyright: Yonsei University College of Medicine 2019
This is an Open Access article distributed under the terms of the Creative Com- mons Attribution Non-Commercial License (https://creativecommons.org/licenses/
by-nc/4.0) which permits unrestricted non-commercial use, distribution, and repro- duction in any medium, provided the original work is properly cited.
Yonsei Med J 2019 Aug;60(8):796-803 https://doi.org/10.3349/ymj.2019.60.8.796
nosed, thereby spreading the infection.5 The 14th patient, a super-spreader, stayed in an overcrowded emergency room (ER) in a tertiary-care hospital for 3 days and spread the infec- tion to 78 patients.6 An healthcare-associated MERS epidemic then started and the fear of MERS spread nationwide.6-8 A 14- day self-isolation quarantine program was applied to contacts of infected patients, while there was no restriction on the pub- lic’s access to medical care.8,9 However, Korean citizens were afraid to visit healthcare facilities due to fears regarding the potential nosocomial transmission of this unfamiliar conta- gious disease. Such fears affected the entire society, and all healthcare utilization reportedly decreased.
In order to effectively respond to emerging infectious dis- ease outbreaks, it is important to predict changes in healthcare utilization and understand the different patterns of changes in diverse population groups. Previous studies have analyzed the impacts of SARS and influenza epidemics.2-4,10,11 However, although few small studies have investigated changes in health- care utilization during the MERS epidemic in Korea,12,13 no study has systematically evaluated the impact of the MERS epidemic on nationwide healthcare utilization. Furthermore, the impact of the reduction in emergency care utilization on health outcomes has not been explored.
The hypothesis of this study was that the use of emergency care during the MERS epidemic decreased regardless of age, sex, and socioeconomic position (SEP), but with a less promi- nent impact for severe diseases, meaning that the final health outcomes of emergency care showed minimal changes. We aimed to investigate the changes in emergency care utilization during the 2015 MERS epidemic according to patient charac- teristics, disease severity, and region, and evaluate its impact on mortality.
MATERIALS AND METHODS
Study setting and databases
The population of Korea is approximately 50 million people, spread over an area of 99000 km2. The administrative units of Korea include eight metropolitan cities and nine provinces that are divided into cities and counties. Korea implemented National Health Insurance (NHI) in 1989, covering the entire population. The Korean government runs NHI as a single in- surer, compulsorily covering inpatient, outpatient, and emer- gency services.14,15 While NHI service ensures high accessibility to medical care, the gatekeeper function of primary clinics is weak, meaning that people can visit tertiary-care hospitals free- ly, with low out-of-pocket costs. Korea has a total of 420 regis- tered ERs, which are open to all beneficiaries without restric- tion, and overcrowding of ER is a serious problem in tertiary- care hospitals.16,17
The National Health Information Database (NHID) from NHI Service was analyzed.15,18 The eligibility database (DB),
healthcare utilization DB, and death information DB con- tained within NHID were used for this study. The eligibility DB (patients’ demographic information) included age, sex, and insurance premium as an indicator of SEP.19 The healthcare utilization DB contained insurance service fee codes and di- agnostic codes. The total number of diagnostic codes was five, including one principal code, one secondary code, and three additional diagnostic codes, based on the International Clas- sification of Diseases, 10th edition. All healthcare use covered by NHI was included in the NHID, but cases involving traffic accidents covered by auto insurance (accounting for approxi- mately 2.6% of total healthcare use) and cases involving for- eigners not covered by the Korean NHI were excluded.14,18,20 We individually linked the eligibility DB and healthcare utili- zation DB with the death information DB, including date of death, to investigate the mortality after ER visits.
MERS outbreak in Korea and study population
On May 20, 2015, the first MERS case in Korea was identified in a traveler from the Middle East. From May 20, when the first patient was diagnosed, to July 5, when the last patient was diagnosed, a total of 186 patients were confirmed, with a 20%
mortality rate.21,22 Although some hospitals were closed tem- porarily for quarantine purposes, there was no restriction on the use of medical services. However, activities in all sectors of society, including health service utilization, decreased. Social cost of the MERS epidemic was estimated to be 8.3 billion USD.23
All patient visits to ER between January 2014 and December 2016 were examined. Cases for which data regarding the age and sex of the insured and insurance premium were not con- firmed were minimal (0.097% of total visits), and such cases were excluded from the analysis. The official end date of the MERS epidemic, according to the criteria of World Health Or- ganization, was December 23, which came 80 days after the last death. However, the period of the 2015 MERS epidemic was defined as June to July 2015, corresponding to the period when new patients were diagnosed and the fear of MERS was preva- lent. The peak was June 2015, when most number of new pa- tients were diagnosed.
Measurement of variables
Patients were divided into three age groups: children (0–19 years), adults (20–59 years), and the elderly (over 60). SEP was classified into quintile groups using an insurance premium.19
Based on the first two diagnostic codes (principal and sec- ondary codes), we selected several major diseases in ER and classified them to high-acuity and low-acuity diseases, based on whether their treatment could be initiated at the primary care settings rather than ER.24 High-acuity diseases included cardiac arrest (I46), myocardial infarction (MI; I21-22), hem- orrhagic stroke (I60-62), and ischemic stroke (I63-64).25 Low- acuity diseases included acute gastroenteritis (AGE; A08-09),
acute pharyngotonsillitis (APT; J00), acute otitis media (AOM;
H65-67), and upper respiratory infection (URI; J00-06).1,24 The regions where the MERS outbreak mainly occurred (i.e., Seoul metropolitan city and Gyeonggi Province) were defined as risk areas and were compared with other regions. In Gyeong- gi Province, Suwon, where the infection control hospital is lo- cated, and Pyeongtaek, where the first patient was diagnosed, were defined as high-risk areas, while Anyang and Seongnam, which are similar to Suwon and Pyongtaek in terms of popu- lation size and number of ER visits, were defined as compari- son areas.
The first outcome was the monthly number of ER visits. To assess the degree of reduction in ER visits, the ratio of ER visits in 2015 to the averaged visits from the same month in 2014 and 2016 was calculated as follows and presented as a percentage (%):
Ratio of ER visits in 2015 (%)=
Number of ER visits in 2015
×100.
Average number of ER visits in 2014 and 2016
The second outcome was the monthly number of deaths within 7 days of an ER visit, which was calculated as follows and presented as a percentage (%): ratio of deaths in 2015 to averaged deaths of the corresponding months in 2014 and 2016.
Statistical analyses
The MERS epidemic can be considered as a natural experi- ment. The periods of the MERS epidemic were considered as the intervention group, and other months were considered as the comparison group. In addition to the investigation of monthly trends from 2014 to 2016, the monthly numbers of ER visits in 2015 were compared with the average visits of the cor- responding months in 2014 and 2016 (ratio of ER visits in 2015,
%). The monthly number of deaths within 7 days of an ER visit was analyzed in the same manner. This analytical choice was based on the assumption that the monthly statistical figures in 2015 would have been similar to the averages from 2014 and 2016 in the absence of important events or policies affect- ing monthly visits and associated mortality.
In addition, age-standardized prevalence and their 95%
confidence intervals (CIs) per 100000 population were calcu- lated for the ER visits and deaths within 7 days of an ER visit in 2015. The number of health insurance subscribers was used as the denominator,26 and mid-year population in 2016 was used as the standard population.27 Prevalence ratios and their 95% CIs were also calculated using the averaged value from the same month in 2014 and 2016 as reference.
Changes in emergency care utilization patterns were com- pared by age, sex, and SEP [quintile of insurance premium: Q1 (lowest) to Q5 (highest)]. The reductions in ER visits for high- acuity and low-acuity diseases were presented as percentages
(%) comparing risk areas with comparison areas. The ratios of monthly ER visits in 2015 to the averaged visits from the same month in 2014 and 2016 were compared according to disease severity, and we performed chi-square test to assess whether the differences of monthly ER visits between 2015 and 2014/2016 were statistically significant. All other results were graphically displayed to identify monthly trends throughout the year, and we considered the values during the MERS epidemic to be meaningful if they were outside the range of values for the other months.
Data management and statistical analyses were conducted using SAS software version 9.4 (SAS Institute Inc., Cary, NC, USA).
Ethics statement
The protocol of this study was reviewed and approved by the Institutional Review Board of Seoul National University Hospi- tal (No. C-1804-041-934). Data use of this study was also ap- proved by the National Health Insurance Service of Korea (Study No. NHIS-2018-1-153). No personal identifiers were provided in the data; instead, only anonymized aggregate data were used for the final analysis.
RESULTS
Overall emergency room visits according to the MERS epidemic
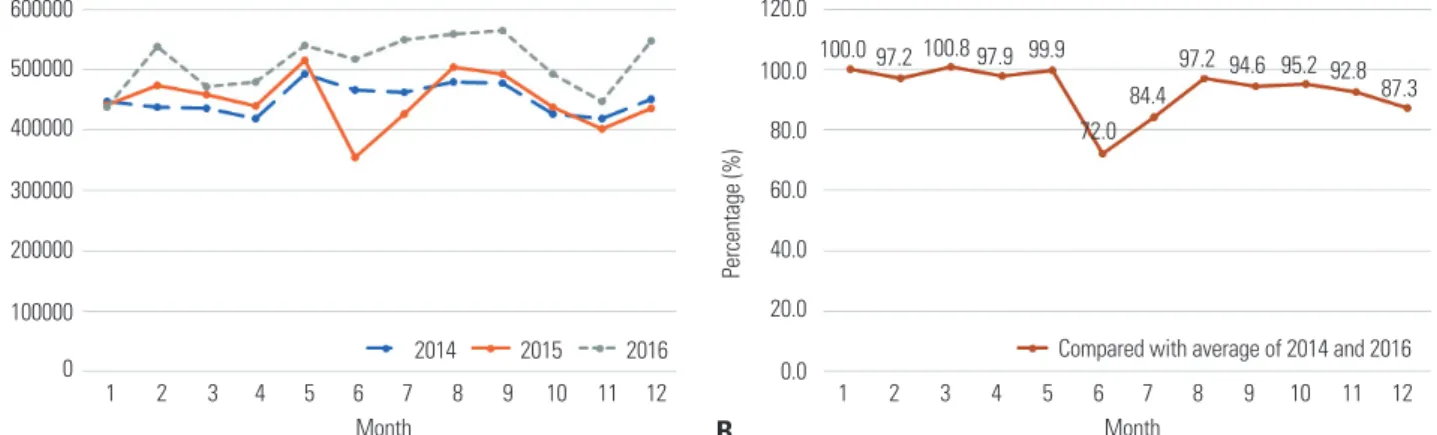
ER visits rose from 2014 to 2016, as shown graphically in Fig. 1.
At the peak of the MERS epidemic in June 2015, the number of ER visits sharply declined by 28.0%, reaching 72.0% of the average visits in 2014 and 2016 (Fig. 1, Supplementary Table 1, only online). Except for June and July, the ratio of ER visits in 2015 ranged from 87.3% to 100.8%. The MERS epidemic re- sulted in a marked reduction in ER visits regardless of age, sex, and SEP, especially in pediatric patients (39.6%, 21.9%, and 24.9% decreased in children, adults, and the elderly, respec- tively) (Supplementary Table 2, Supplementary Fig. 1, only on- line).
The age-standardized prevalence ratios for ER visits per 100000 population in June 2015 was 0.72, which was lower compared to the rest of the year (0.85 to 1.01) (Table 1).
Emergency care utilization according to disease severity
At the peak of the MERS epidemic, the ratio of ER visits due to low-acuity diseases decreased more sharply than that of ER vis- its due to high-acuity diseases (33.8%, 39.9%, 53.0%, and 45.2%
decreased in AGE, APT, AOM, and URI, respectively versus a 14.0% decreased for MI and a 16.6% decreased for ischemic stroke). ER visits due to the highest-acuity diseases, cardiac arrest and hemorrhagic stroke, did not decrease during the MERS outbreak (with ratios of 103.5% for cardiac arrest and
102.4% for hemorrhagic stroke) and showed similar trends throughout the year (Table 2, Supplementary Table 3, Supple- mentary Figs. 2 and 3, only online).
Emergency care utilization by region
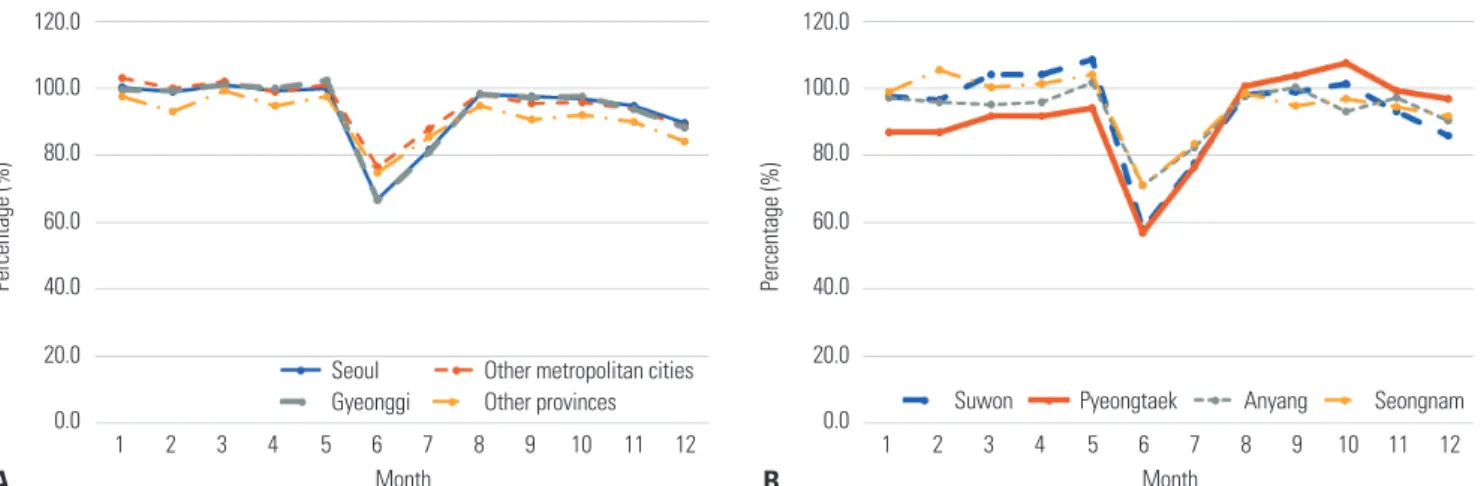
At the peak of the MERS epidemic, the reduction in emergen-
cy care use was more prominent in the risk areas than in other metropolitan cities and provinces (66.9% in Seoul and 66.7%
in Gyeonggi Province versus 76.7% in other metropolitan cit- ies and 75.0% in other provinces). In Gyeonggi Province, the reduction was more prominent in high-risk areas than in com- parison areas (58.1% in Suwon and 56.8% in Pyeongtaek ver-
1 2 3 4 5 6 7 8 9 10 11 12 1 2 3 4 5 6 7 8 9 10 11 12
Month Month
120.0 100.0 80.0 60.0 40.0 20.0 0.0
Percentage (%)
600000 500000 400000 300000 200000 100000 0
Number of patients (n)
2014 2015 2016 Compared with average of 2014 and 2016 100.0 97.2 100.8 97.9 99.9
72.0
84.4 97.2 94.6 95.2 92.8 87.3
A B
Fig. 1. Trends in emergency room visits between 2014 and 2016. (A) Monthly number of emergency room visits. (B) Ratio of emergency room visits in 2015 compared to the averages in 2014 and 2016.
Table 2. The Ratios of Monthly Emergency Room Visits in 2005 to the Average Visits of Corresponding Months in 2014 and 2016 according to Disease Severity (%)
Month
High-acuity disease Low-acuity disease
Myocardial infarction
Cardiac arrest
Ischemic stroke
Hemorrhagic
stroke AGE APT AOM URI
% p value* % p value* % p value* % p value* % p value* % p value* % p value* % p value*
May 98.2 0.463 100.2 0.992 96.2 0.019 101.1 0.732 99.7 0.411 92.0 <0.001 90.8 <0.001 95.7 <0.001 June† 86.0 <0.001 103.5 0.401 83.4 <0.001 102.4 0.443 66.2 <0.001 60.1 <0.001 47.0 <0.001 54.8 <0.001 July† 94.6 0.050 99.2 0.802 95.7 0.011 101.0 0.786 83.3 <0.001 60.5 <0.001 67.2 <0.001 60.4 <0.001 August 96.9 0.267 95.4 0.209 98.3 0.309 98.3 0.553 99.1 0.097 101.4 0.606 101.2 0.728 100.9 0.290 AGE, acute gastroenteritis; APT, acute pharyngotonsillitis; AOM, acute otitis media; URI, upper respiratory infection.
*p value from chi-square test; †Values during Middle East respiratory syndrome epidemic period (June to July).
Table 1. The Age-Standardized Prevalence (per 100000) and Prevalence Ratio of Monthly Emergency Room Visits and Deaths within 7 Days of Emer- gency Room Visits
Month ER visits Deaths within 7 days of ER visits
Prevalence* (95% CI) Prevalence ratio† (95% CI) Prevalence* (95% CI) Prevalence ratio† (95% CI)
January 885.47 (882.86–888.08) 1.00 (1.00–1.00) 12.69 (12.36–13.01) 1.02 (0.99–1.05)
February 949.72 (947.02–952.42) 0.97 (0.97–0.98) 12.78 (12.45–13.10) 0.97 (0.94–1.00)
March 919.44 (916.77–922.10) 1.01 (1.01–1.01) 13.99 (13.65–14.33) 1.11 (1.08–1.14)
April 882.06 (879.45–884.66) 0.98 (0.98–0.98) 12.25 (11.93–12.56) 1.05 (1.02–1.08)
May 1031.75 (1028.94–1034.57) 1.00 (1.00–1.00) 12.04 (11.73–12.35) 1.00 (0.97–1.03)
June‡ 708.48 (706.15–710.82) 0.72 (0.72–0.72) 10.82 (10.52–11.11) 0.99 (0.96–1.03)
July‡ 853.01 (850.45–855.57) 0.85 (0.84–0.85) 10.89 (10.59–11.19) 1.00 (0.97–1.03)
August 1007.88 (1005.10–1010.66) 0.97 (0.97–0.97) 10.80 (10.50–11.09) 0.96 (0.93–0.99)
September 985.56 (982.81–988.31) 0.95 (0.94–0.95) 11.34 (11.04–11.65) 0.98 (0.95–1.02)
October 876.61 (874.01–879.21) 0.95 (0.95–0.96) 11.70 (11.39–12.01) 0.96 (0.93–0.99)
November 804.15 (801.66–806.64) 0.93 (0.93–0.93) 11.73 (11.42–12.04) 0.97 (0.94–1.00)
December 871.86 (869.27–874.45) 0.87 (0.87–0.88) 12.48 (12.16–12.80) 0.95 (0.92–0.98)
ER, emergency room; CI, confidence intervals.
*Age-standardized prevalence per 100000 in 2015; †Average age-standardized prevalence for the corresponding months in 2014 and 2016 were referent in cal- culating prevalence ratios; ‡Values during the Middle East respiratory syndrome epidemic period (June to July).
sus 71.0% in Anyang and 71% in Seongnam) (Fig. 2, Supple- mentary Table 4, only online).
Effect of reduction in emergency care utilization on short-term mortality
No substantial changes were detected in the number of deaths within 7 days after an ER visit throughout the year (Decem- ber: 94.5% to March: 110.1%), including the MERS epidemic period (June: 99.2% and July: 99.5%) (Fig. 3, Supplementary Table 5, only online). The death trends within 7 days of an ER visit in 2015 were similar throughout the year, regardless of sex and SEP. Due to the unstable numbers of monthly child- hood deaths (ranging from 42 to 85 in 2014–2016), a large variation in children was noted, from 54.4% in February to 133.3% in August, while the corresponding values during the months of the MERS epidemic were 114.6% (June) and 78.0%
(July) (Supplementary Table 2, Supplementary Fig. 4, only on- line).
DISCUSSION
This study evaluated changes in the utilization of emergency care throughout the 2015 MERS epidemic in Korea by using NHID, which covered the entire Korean population. Emer- gency care utilization decreased regardless of age, sex, and SEP at the peak of the MERS epidemic, especially in pediatric patients. The reduction was more prominent in low-acuity dis- eases than in high-acuity diseases, and in the MERS epidemic areas than in other areas. Although ER visits decreased mark- edly during the epidemic period, the number of deaths within 7 days of an ER visit did not change.
Patterns of medical service use in infectious disease outbreak may vary according to the characteristics of an infection, such as infectivity and lethality of the disease. Both SARS and H1N1 influenza were epidemics that caused global panic, but the pattern of healthcare utilization changed in the opposite di- rection. Healthcare utilization decreased in the 2003 SARS ep- idemic due to fear of nosocomial infection, whereas it explo- 1 2 3 4 5 6 7 8 9 10 11 12 1 2 3 4 5 6 7 8 9 10 11 12
Month Month
120.0 100.0 80.0
60.0 40.0
20.0 0.0
120.0 100.0 80.0
60.0 40.0
20.0 0.0
Percentage (%) Percentage (%)
Seoul Other metropolitan cities
Gyeonggi Other provinces Suwon Pyeongtaek Anyang Seongnam
A B
Fig. 2. Trends in the ratio of emergency room visits in 2015 compared to the averages in 2014 and 2016 by region. (A) Regional trends in emergency room visits between risk areas and comparison areas. Seoul and Gyeonggi province were risk areas while other metropolitan cities and other prov- inces were comparison areas. (B) Regional trends in emergency room visits between high-risk areas and comparison areas in Gyeonggi Province.
Suwon and Pyeongtaek were high-risk areas while Anyang and Seongnam were comparison areas.
7000 6000 5000 4000 3000 2000 1000 0
120.0 100.0 80.0 60.0 40.0 20.0 0.0
Number of patients (n) Percentage (%)
1 2 3 4 5 6 7 8 9 10 11 12 1 2 3 4 5 6 7 8 9 10 11 12
Month Month
2014 2015 2016 Death within 7 days
101.896.5 110.1
104.4
99.4 99.2 99.5 95.7 98.3 95.6 97.1 94.5
A B
Fig. 3. Short-term mortality after emergency care between 2014 and 2016. (A) Monthly number of deaths within 7 days of an emergency room visit. (B) Ratio of deaths within 7 days of an emergency room visit in 2015 compared to the averages in 2014 and 2016.
sively increased in the 2009 H1N1 influenza pandemic due to fear of influenza itself.2-4,10 In the case of MERS, since the main transmission route was nosocomial transmission and the mor- tality rate was high, healthcare utilization decreased during the epidemic.12,13 This effect was dramatic in the ER rather than other departments in hospitals, as most of the nosocomial in- fections occurred in a crowded ER.6 When we analyzed the monthly number of ER visits by type of ER using the National Emergency Department Information System (NEDIS) data, the number of ER visits decreased in all three types of ER (re- gional emergency medical center, local emergency medical center, and local emergency medical institution) in MERS epi- demic, regardless of the type of ER.16 Since only 186 patients were diagnosed with MERS during the epidemic in Korea, the explanation for the impact of MERS on ER use was fear, not the MERS disease itself. The effects of fear impacted everyone in the society regardless of age, sex, and SEP groups.7 The great- er reduction in the epidemic areas than in other comparison areas also corroborates the explanation that the fear of MERS infection caused the reduced utilization of healthcare.
As in previous studies examining changes in healthcare uti- lization according to disease severity, the results of this study showed that the reduction in emergency care utilization was most prominent for low-acuity diseases.1,12,13 The reduction in visits for high-acuity diseases was relatively small, and the most severe diseases did not show a decrease even in June 2015, when the epidemic was at its peak. Patients decide to use medi- cal care based on their consideration of risks and benefits.
During an infectious disease epidemic, patients use medical care when they feel that the benefits of healthcare utilization are greater than the risk of infection.1 When there were con- cerns about nosocomial infections, those with low-acuity dis- eases, which are considered to have little benefits from emer- gency service use, were less likely to visit the ER. In Korea, due to the absence of limitations on healthcare utilization and the weak gatekeeping role of healthcare delivery system, unnec- essary hospital utilization of low-acuity patients is preva- lent.28,29 As a result, overcrowding in a tertiary-care hospital ER caused the MERS epidemic, and low-acuity patients decreased most when the risk of infection overwhelmed the benefit of emergency service use. A study of the SARS epidemic showed that restriction of non-urgent hospital utilization during the epidemic did not increase mortality and complication rates.30 The authors of that study concluded that restriction of non-ur- gent visits is a safe public health strategy to control nosocomi- al infections and to maintain hospital surge capacity. Examin- ing the scale of ER visits for low-acuity diseases with little benefit from service use is important, not only for preparing ap- propriate emergency surge capacity but also for providing evi- dence to redesign emergency service to decrease healthcare- related infectious disease outbreak.
Another noteworthy finding of this study was that, although the total number of ER visits decreased, the number of deaths
within 7 days of an ER visit did not meaningfully change dur- ing the epidemic. This implies that the number of patients with serious conditions visiting the ER did not change, even though overall emergency care utilization decreased. As shown for cardiac arrest and hemorrhagic stroke in this study, the reduc- tion in ER use for high-acuity diseases is expected to be mini- mal in infectious disease outbreak. When fear of an epidemic spreads and ER visits decrease, preparations for serious con- ditions need to be focused, and patients with severe diseases should not face barriers to emergency care use.
This study had some limitations. First, our analysis was based on the assumption that no meaningful changes in factors af- fecting ER visits, except for the MERS epidemic, occurred dur- ing the study period, which might not have been completely true. For example, the ratio of ER visits in December 2015 was relatively low compared to the ratio in other comparison months (87.3%; Supplementary Table 1, only online). This may have been due to the influenza epidemic in December 2016, which occurred a month earlier than usual (influenza epi- demic alarm was announced by the Korea Centers for Disease Control and Prevention on January 2, 2014; January 22, 2015;
January 14, 2016; and December 8, 2016). However, our analy- sis on the utilization by region (MERS risk area versus com- parison area) corroborated our explanation. Second, the scope of this study only included patients who visited the ER.
The health outcomes of those who did not use emergency ser- vices were not investigated. Although ER visits for the most severe conditions did not decrease, the reduction in emer- gency care utilization for MI and ischemic stroke, where acute care is important, might have led to complications other than short-term mortality.31,32 Supplementary Fig. 5 (only online) employing mortality data among the entire Korean popula- tion from Statistics Korea shows no apparent changes in over- all mortality according to the MERS epidemic. However, fur- ther study is needed to investigate the long-term outcomes of reduced emergency care utilization. Third, ER visits due to traffic accidents, which account for a considerable proportion of injured patients, were not included in this study, as these cases were covered by auto insurance in Korea and not by the NHI. However, based on the estimates from NEDIS database in Korea, 5.1% of ER visits were covered by auto insurance.33 Changes in the ER visits covered by auto insurance would not critically change the findings.
This study also had several strengths. First, to the best of our knowledge, this is the first study to investigate the impact of MERS outbreak at the national level. In the era of emerging infectious diseases, understanding the impact of epidemic is an important first step to being prepared. Second, this study was a natural experiment, in which major confounding fac- tors, such as social and economic factors, might well be inde- pendent of the MERS epidemic in the causal association with ER visits and mortality. Third, we employed total NHI data cov- ering the entire Korean population, which enabled us to pres-
ent stable overall- and subgroup-specific numbers of ER visits and mortality.
In conclusion, during the 2015 MERS epidemic in Korea, the utilization of emergency care decreased regardless of age, sex, and SEP. A greater reduction was observed in epidemic areas than in other comparison areas, and the reduction was greater for low-acuity diseases than for high-acuity diseases.
Although the number of ER visits decreased, the number of deaths within 7 days of an ER visit did not change.
ACKNOWLEDGEMENTS
Hee-Yeon Kang and Yeon-Yong Kim provided helpful com- ments on the earlier analysis of this paper.
AUTHOR CONTRIBUTIONS
Conceptualization: Sun Young Lee and Young-Ho Khang. Data cura- tion: Sun Young Lee and Young-Ho Khang. Methodology: Sun Young Lee, Young-Ho Khang, and Hwa-Kyung Lim. Formal analysis: Sun Young Lee and Hwa-Kyung Lim. Software: Sun Young Lee. Valida- tion: Sun Young Lee and Young-Ho Khang. Investigation: Sun Young Lee, Young-Ho Khang, and Hwa-Kyung Lim. Writing—original draft:
Sun Young Lee. Writing—review & editing: Sun Young Lee, Young-Ho Khang, and Hwa-Kyung Lim. Approval of final manuscript: All authors.
ORCID iDs
Sun Young Lee https://orcid.org/0000-0002-1626-2721 Young-Ho Khang https://orcid.org/0000-0002-9585-8266 Hwa-Kyung Lim https://orcid.org/0000-0003-2330-718X
REFERENCES
1. Lu TH, Chou YJ, Liou CS. Impact of SARS on healthcare utiliza- tion by disease categories: implications for delivery of healthcare services. Health Policy 2007;83:375-81.
2. Chang HJ, Huang N, Lee CH, Hsu YJ, Hsieh CJ, Chou YJ. The im- pact of the SARS epidemic on the utilization of medical services:
SARS and the fear of SARS. Am J Public Health 2004;94:562-4.
3. Fagbuyi DB, Brown KM, Mathison DJ, Kingsnorth J, Morrison S, Saidinejad M, et al. A rapid medical screening process improves emergency department patient flow during surge associated with novel H1N1 influenza virus. Ann Emerg Med 2011;57:52-9.
4. Costello BE, Simon HK, Massey R, Hirsh DA. Pandemic H1N1 in- fluenza in the pediatric emergency department: a comparison with previous seasonal influenza outbreaks. Ann Emerg Med 2010;56:
643-8.
5. Cowling BJ, Park M, Fang VJ, Wu P, Leung GM, Wu JT. Preliminary epidemiological assessment of MERS-CoV outbreak in South Ko- rea, May to June 2015. Euro Surveill 2015;20:7-13.
6. Cho SY, Kang JM, Ha YE, Park GE, Lee JY, Ko JH, et al. MERS-CoV outbreak following a single patient exposure in an emergency room in South Korea: an epidemiological outbreak study. Lancet 2016;388:994-1001.
7. Ro JS, Lee JS, Kang SC, Jung HM. Worry experienced during the 2015 Middle East Respiratory Syndrome (MERS) pandemic in Korea. PLoS One 2017;12:e0173234.
8. Park GE, Ko JH, Peck KR, Lee JY, Lee JY, Cho SY, et al. Control of an outbreak of Middle East respiratory syndrome in a tertiary hospital in Korea. Ann Intern Med 2016;165:87-93.
9. Kim EY, Liao Q, Yu ES, Kim JH, Yoon SW, Lam WW, et al. Middle East respiratory syndrome in South Korea during 2015: risk-related perceptions and quarantine attitudes. Am J Infect Control 2016;44:
1414-6.
10. Chen TA, Lai KH, Chang HT. Impact of a severe acute respiratory syndrome outbreak in the emergency department: an experience in Taiwan. Emerg Med J 2004;21:660-2.
11. Heiber M, Lou WY. Effect of the SARS outbreak on visits to a com- munity hospital emergency department. CJEM 2006;8:323-8.
12. Paek SH, Kim DK, Lee JH, Kwak YH. The impact of Middle East respiratory syndrome outbreak on trends in emergency depart- ment utilization patterns. J Korean Med Sci 2017;32:1576-80.
13. Jeong H, Jeong S, Oh J, Woo SH, So BH, Wee JH, et al. Impact of Middle East respiratory syndrome outbreak on the use of emer- gency medical resources in febrile patients. Clin Exp Emerg Med 2017;4:94-101.
14. Song SO, Jung CH, Song YD, Park CY, Kwon HS, Cha BS, et al.
Background and data configuration process of a nationwide pop- ulation-based study using the Korean National Health Insurance system. Diabetes Metab J 2014;38:395-403.
15. Park CS, Choi EK, Han KD, Lee HJ, Rhee TM, Lee SR, et al. Associ- ation between adult height, myocardial infarction, heart failure, stroke and death: a Korean nationwide population-based study.
Int J Epidemiol 2018;47:289-98.
16. National Emergency Medical Center. Statistical yearbook of emer- gency medical service [Internet]. Seoul: National Emergency Medi- cal Center; c2015 [accessed on 2019 March 19]. Available at: https://
www.e-gen.or.kr/nemc/statistics_annual_report.do.
17. Lee YJ, Shin SD, Lee EJ, Cho JS, Cha WC. Emergency department overcrowding and ambulance turnaround time. PLoS One 2015;
10:e0130758.
18. Seong SC, Kim YY, Khang YH, Park JH, Kang HJ, Lee H, et al. Data resource profile: the National Health Information Database of the National Health Insurance Service in South Korea. Int J Epidemiol 2017;46:799-800.
19. Khang YH, Yang S, Cho HJ, Jung-Choi K, Yun SC. Decomposition of socio-economic differences in life expectancy at birth by age and cause of death among 4 million South Korean public servants and their dependents. Int J Epidemiol 2010;39:1656-66.
20. Health Insurance Review and Assessment Service. Statistics of the healthcare fee [Internet]. Wonju: Health Insurance Review and As- sessment Service; c2015 [accessed on 2019 March 19]. Available at: https://www.hira.or.kr/bbsDummy.do?pgmid=HIRAA020045 030000&brdScnBltNo=4&brdBltNo=2376&pageIndex=2#none.
21. Kang CK, Song KH, Choe PG, Park WB, Bang JH, Kim ES, et al.
Clinical and epidemiologic characteristics of spreaders of Middle East respiratory syndrome coronavirus during the 2015 outbreak in Korea. J Korean Med Sci 2017;32:744-9.
22. Kim KH, Tandi TE, Choi JW, Moon JM, Kim MS. Middle East re- spiratory syndrome coronavirus (MERS-CoV) outbreak in South Korea, 2015: epidemiology, characteristics and public health im- plications. J Hosp Infect 2017;95:207-13.
23. Cho KY, Yoo JS. Estimate of economic loss of MERS epidemic [In- ternet]. Seoul: Korea Economic Research Institute; c2015 [accessed on 2019 March 19]. Available at: https://www.keri.org/web/www/
research_0201?p_p_id=EXT_BBS&p_p_lifecycle=0&p_p_state=
normal&p_p_mode=view&_EXT_BBS_struts_action=%2Fext%
2Fbbs%2Fview_message&_EXT_BBS_messageId=350282.
24. Kellermann AL, Weinick RM. Emergency departments, Medicaid costs, and access to primary care--understanding the link. N Engl
J Med 2012;366:2141-3.
25. Writing Group Members, Mozaffarian D, Benjamin EJ, Go AS, Ar- nett DK, Blaha MJ, et al. Heart disease and stroke statistics-2016 update: a report from the American Heart Association. Circula- tion 2016;133:e38-360.
26. Korean Statistical Information Service (KOSIS). Health insurance statistics: monthly population [Internet]. Daejeon: KOSIS; c2018 [accessed on 2019 March 19]. Available at: http://kosis.kr/statHt- ml/statHtml.do?orgId=350&tblId=TX_35001_A007&vw_cd=MT_
ZTITLE&list_id=350_35001_B&seqNo=&lang_mode=ko&language
=kor&obj_var_id=&itm_id=&conn_path=MT_ZTITLE.
27. Korean Statistical Information Service (KOSIS). The estimated population [Internet]. Daejeon: KOSIS; c2019 [accessed on 2019 March 19]. Available at: http://kosis.kr/statHtml/statHtml.do?org Id=101&tblId=DT_1BPA001&vw_cd=MT_ZTITLE&list_id=A41_10
&seqNo=&lang_mode=ko&language=kor&obj_var_id=&itm_
id=&conn_path=MT_ZTITLE.
28. Jung H, Do YK, Kim Y, Ro J. The impact of an emergency fee in- crease on the composition of patients visiting emergency depart- ments. J Prev Med Public Health 2014;47:309-16.
29. Lee JY, Jo MW, Yoo WS, Kim HJ, Eun SJ. Evidence of a broken healthcare delivery system in Korea: unnecessary hospital outpa- tient utilization among patients with a single chronic disease with-
out complications. J Korean Med Sci 2014;29:1590-6.
30. Stukel TA, Schull MJ, Guttmann A, Alter DA, Li P, Vermeulen MJ, et al. Health impact of hospital restrictions on seriously ill hospital- ized patients: lessons from the Toronto SARS outbreak. Med Care 2008;46:991-7.
31. Levine GN, Bates ER, Blankenship JC, Bailey SR, Bittl JA, Cercek B, et al. 2015 ACC/AHA/SCAI focused update on primary percuta- neous coronary intervention for patients with ST-elevation myo- cardial infarction: an update of the 2011 ACCF/AHA/SCAI Guide- line for percutaneous coronary intervention and the 2013 ACCF/
AHA Guideline for the management of ST-elevation myocardial infarction: a report of the American College of Cardiology/Ameri- can Heart Association Task Force on Clinical Practice Guidelines and the Society for Cardiovascular Angiography and Interventions.
Circulation 2016;133:1135-47.
32. Furie KL, Jayaraman MV. 2018 Guidelines for the early manage- ment of patients with acute ischemic stroke. Stroke 2018;49:509-10.
33. National Emergency Medical Center. Statistical yearbook of Na- tional Emergency Department Information System (NEDIS) [In- ternet]. Seoul: National Emergency Medical Center; c2015 [ac- cessed on 2019 March 19]. Available at: https://www.e-gen.or.kr/
nemc/statistics_annual_report.do?brdclscd=02.