• 검색 결과가 없습니다.

Evaluation of hyoid bone movements in subjects with open bite: a study with real-time balanced turbo field echo cine-magnetic resonance imaging

N/A
N/A
Protected

Academic year: 2022

Share "Evaluation of hyoid bone movements in subjects with open bite: a study with real-time balanced turbo field echo cine-magnetic resonance imaging"

Copied!
11
0
0

로드 중.... (전체 텍스트 보기)

전체 글

(1)

Evaluation of hyoid bone movements in subjects with open bite: a study with real-time balanced turbo field echo cine-magnetic resonance imaging

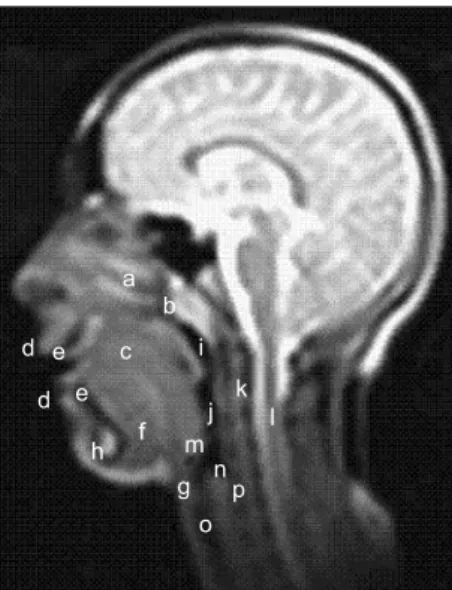
Objective: To assess the position and movements of the hyoid bone during deglutition in patients with open bite. Methods: Thirty-six subjects were divided into 2 groups according to the presence of anterior open bite. The open bite group (OBG) and control group each comprised 18 patients with a mean overbite of –4.9

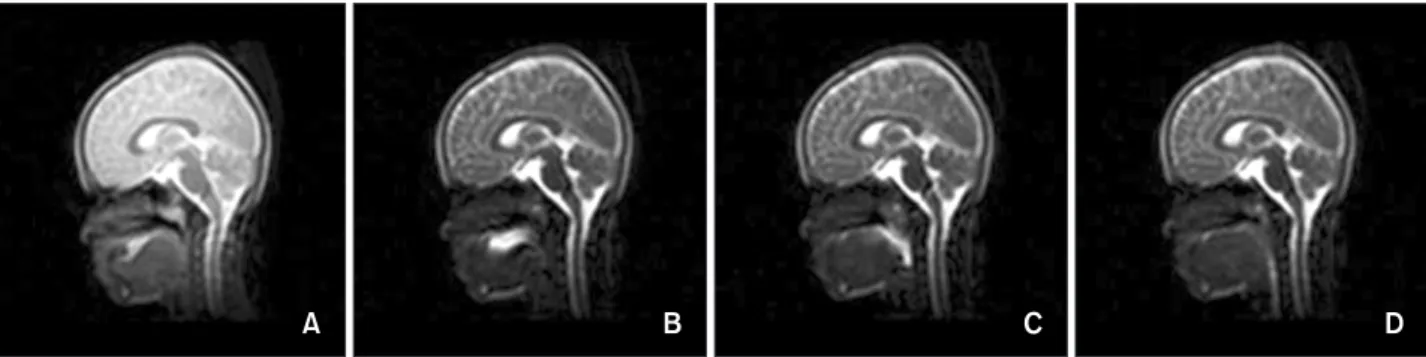
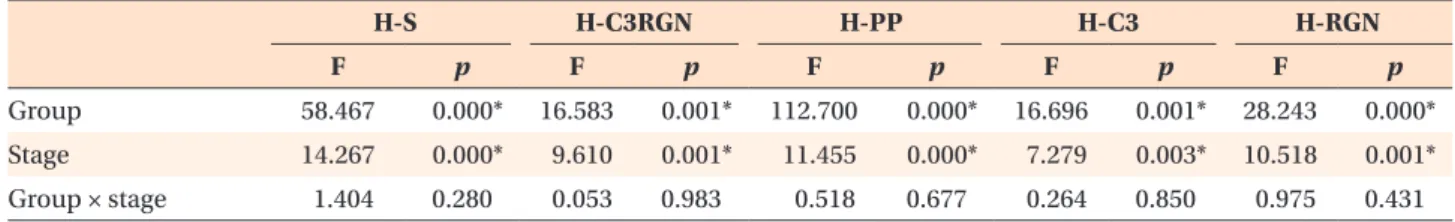
± 1.9 mm and 1.9 ± 0.7 mm. The position of the hyoid bone during the 4 stages of deglutition was evaluated by measuring vertical and horizontal movement of the bone. Results: Interactions of group and stage showed no significant effect on the measurements (p > 0.05). However, when group and stage were evaluated individually, they showed significant effects on the measurements (p < 0.001). In OBG, the hyoid bone was more inferiorly and posteriorly positioned, and this position continued during the deglutition stages. Conclusions: The hyoid bone reaches the maximum anterior position at the oral stage and maximum superior position at the pharyngeal stage during deglutition. Open bite does not change the displacement pattern of the bone during deglutition. The hyoid bone is positioned more inferiorly and posteriorly in patients with open bite because of released tension on the suprahyoid muscles.

[Korean J Orthod 2012;42(6):318-328]

Key words: Magnectic resonance imaging, Dentofacial anomalies Seniz Karacay

a

Sila Gokce

b

Ersin Yildirim

a

a

Section of Orthodontics, Gulhane Military Medical Academy, Haydarpasha Education Hospital, Istanbul, Turkey

b

Department of Orthodontics, Gulhane Military Medical Academy, Ankara, Turkey

Received March 19, 2012; Revised August 30, 2012; Accepted September 7, 2012.

Corresponding author: Seniz Karacay.

Associate Professor, Section of Orthodontics, Gulhane Military Medical Academy, Haydar pasha Education Hospital, Tibbiye Cad., GATA Haydarpaşa Eğt. Hast., Diş Servisi, Uskudar-Istanbul, Istanbul, Turkey.

Tel +90 536 496 72 56 e-mail kseniz@yahoo.com

© 2012 The Korean Association of Orthodontists.

The authors report no commercial, proprietary, or financial interest in the products or companies described in this article.

This is an Open Access article distributed under the terms of the Creative Commons Attribution Non-Commercial License (http://creativecommons.org/licenses/by-nc/3.0) which permits unrestricted non-commercial use, distribution, and reproduction in any medium, provided the original work is properly cited.

pISSN 2234-7518 • eISSN 2005-372X

http://dx.doi.org/10.4041/kjod.2012.42.6.318

(2)

INTRODUCTION

The hyoid bone is unique because it has no bony articu- lation. However, it is an insertion element for muscles, ligaments, and fasciae attached to the mandible, clavicle, sternum, cranium, and cervical vertebrae. The hyoid bone is an important part of the musculoskeletal apparatus of the craniofacial complex and factors affecting this system might have not only local but systemic effects as well.

1

Mandibular repositioning by advancement or setback sur geries reportedly changes the position of the hyoid bone by causing alterations in the tension of the supra- hyoid and infrahyoid muscles, neck extensor muscles, and cervical fasciae.

2-4

Its position also changes in relation to postural changes of the head and tongue, malocclusion, and facial type.

1,5-9

Several authors reported that the posi- tion of the hyoid bone is affected by the biomechanics of the suprahyoid and infrahyoid muscles and the elastic membranes of the larynx and trachea.

10,11

Andersen,

12

Subtelny and Sakuda,

13

and Haralabakis et al.

9

studied the position of the hyoid bone in patients with open bite and observed the stability of its vertical position. However, Haralabakis et al.,

9

who also evaluated the horizontal position of the hyoid bone according to a vertical line drawn from the Frankfort horizontal (FH) plane at porion, reported that it is positioned more pos te riorly in patients with open bite. Yet the horizontal distance of the hyoid bone from the cervical spine, pharynx, and mandibular plane (MP) is not influenced by open bite.

In most previous studies, cephalometric measurements were used to determine hyoid bone positioning. How- ever, as this bone moves forward and upward during swallowing, evaluation of its movements during de- glu ti tion is more important than investigating its static posi tion. Mays et al.

14

evaluated the influence of crani- ofacial morphology on hyoid bone movements by video fluoroscopy and demonstrated that the forward displacement of the hyoid bone during liquid swallowing is significantly related to craniofacial morphology. For instance, as the FH-MP angle (FMA) increases, the forward displacement of the hyoid bone decreases. These authors suggested that the observed effects are related to the biomechanics of the suprahyoid musculature. Sloan et al.

15

also analyzed hyoid bone behavior during deglutition by cinefluorography and detected two distinct movement patterns: a circular pattern and an oblique, elliptical pattern.

Postural changes in the mandible and tongue affect the position of the hyoid bone.

5-8

Open bite is usually associated with posterior rotation of the mandible and changes in the tongue posture and deglutitive tongue movements.

16-18

Therefore, open bite may also affect the position and movements of the hyoid bone during deglutition. The aim of this retrospective study was to

assess the position and movements of the hyoid bone during deglutition in patients with open bite by real- time balanced turbo field echo (B-TFE) cine magnetic resonance imaging (cine MRI).

MATERIALS AND METHODS

Subjects

The cine MRI images used in this study were selected from records obtained to evaluate deglutitive tongue move ments in patients with open bite and Class II maloc- clusions.

18,19

This study was initiated after obtaining institutional approval from Gulhane Military Medical Academy’s Ethics Committee (1491-373-07). Images of 36 patients with normal overjet (1 - 3 mm) were selected.

G*Power software (v3.1.3; Franz Faul, Universitat Kiel, Germany) was used to determine the power of the sample size.

20

A sample size of 36 patients was considered suf- ficient to provide more than 60% power for detecting significant differences with an effect size of 0.30 between groups at a 0.05 significance level.

Two groups were formed according to the presence of anterior open bite (at least −2 mm). The open bite group (OBG) included 18 patients (14 girls and 4 boys) with a mean age of 14.5 ± 2.7 years and mean overbite of −4.9 ± 1.9 mm. The control group (CG) comprised 18 patients (11 girls and 7 boys) with a mean age of 16.4 ± 0.9 years and mean overbite of 1.9 ± 0.7 mm. Cephalometric analyses

Figure 1. Anatomical structures visible on cine magnetic

resonance imaging (a) nasal cavity, (b) nasopharynx, (c)

tongue, (d) lips, (e) incisors, (f) floor of the mouth, (g)

hyoid bone, (h) symphysis, (i) pharynx, (j) larynx, (k) spinal

column, (l) spinal cord, (m) epiglottis, (n) cricoid cartilage

and cricotracheal membrane, (o) trachea, and (p) upper

portion of the esophagus.

(3)

revealed that 4 patients in the OBG and 2 patients in the CG had mild skeletal Class II malocclusions with an ANB angle of 5

o

, although their overjet was in the normal range. Other patients had skeletal Class I malocclusions and ANB angles ranging from 1

o

to 4

o

. In the OBG, the MP angle (SN–GoGn) was 35.56 ± 1.69

o

, FMA was 28.17 ± 1.62

o

, and the palatal plane (PP) angle (SN–

PP) was 5.72 ± 1.28°, revealing posterior rotation of the mandible and anterior rotation of the PP. In the CG, these measurements were 32.61 ± 1.33

o

, 23.83 ± 1.29

o

, and 7.28

± 1.32

o

, respectively. None of the patients had complaints related to masticatory difficulty, dysphasia, or swallowing disorders.

Cine MRI and stages of deglutition

A detailed description of the dynamic images obtained by B-TFE cine MRI (New Intera Nova; Philips Medical Systems, Best, The Netherlands) has been presented in our previous reports.

18,19

Figure 1 shows the anatomical structures visible on these images. For each patient, images of the following 4 stages of deglutition during water swallowing were determined by a consensus of 3 specialists and printed on radiographs.

Stage 1 (oral preparatory stage): The tongue tip contacts the maxillary incisors and/or the palatal mucosa (Figure 2A).

Stage 2 (oral stage): The dorsum of the tongue loses contact with the soft palate (Figure 2B).

Stage 3 (pharyngeal stage): The bolus crosses the posterior or inferior margin of the mandibular ramus (Figure 2C).

Stage 4 (esophageal stage): The bolus enters the eso- phageal opening (Figure 2D).

Measurements

To determine the position and movements of the hyoid bone during deglutition, linear measurements were obtained from the printed radiographs by the same

investigator (SG) to avoid inter-examiner variability. The distance between the hyoid bone and point sella (H-S), the vertical distance between the hyoid bone and PP (H- PP), and the vertical distance between the hyoid bone and a line connecting the most anteroinferior point of the third cervical vertebra and retrognathion (H-C3RGN) were used to evaluate the vertical movement of the

Figure 2. Stages of deglutition. A, stage 1 (oral preparatory stage), the tongue tip contacts the maxillary incisors and/

or the palatal mucosa; B, stage 2 (oral stage), the dorsum of the tongue loses contact with the soft palate; C, stage 3 (pharyngeal stage), the bolus crosses the posterior or inferior margin of the mandibular ramus; and D, stage 4 (esophageal stage), the bolus enters the esophageal opening.

Figure 3. Measurements used for evaluating hyoid bone

movements. (1) H-S, distance between hyoidale (H, the

most anterosuperior point of the hyoid bone) and point

sella (S); (2) H-PP, perpendicular distance of hyoidale

to the palatal plane (PP); (3) H-C3RGN, perpendicular

distance of hyoidale to the line connecting the most

anteroinferior point of the third cervical vertebra (C3)

and retrognathion (RNG, the most prominent point of

the posterior border of the symphysis); (4) H-C3, distance

between hyoidale and the most anteroinferior point

of the third cervical vertebra; and (5) H-RGN, distance

between hyoidale and retrognathion.

(4)

hyoid bone. The horizontal movement was evaluated by measuring the distances between the hyoid bone and the most anteroinferior point of the third cervical vertebra (H-C3) as well as the distance between the hyoid bone and retrognathion (H-RGN) (Figure 3).

The measurements of 10 patients were repeated 1 month

later, and reliability was evaluated by using intraclass correlation coefficients (ICCs) and Bland–Altman plots.

Statistical analysis

All statistical analyses were performed with SPSS for Windows (version 15, IBM SPSS Inc., Chicago, IL,

Figure 4. Bland-Altman plots of the average differences in the measurements. A, H-S; B, H-C3RGN; C, H-PP;

D, H-C3; and E, H-RGN. The overall bias of each

measurement is shown, along with the 95% agreement

interval. SD, Standard deviation. Refer to Figure 3 for

measurements and abbreviations.

(5)

USA). The Shapiro-Wilks and Levene tests were applied to the data and mean ages, which were both found to be normally distributed and showed homogeneity of variance between groups. Therefore, parametric tests were performed for further analysis. Within-group differences in the stages of deglutition were analyzed with the paired- samples t-test. Repeated-measures analysis of variance (ANOVA) was used to evaluate the differences between groups and the significance of the interaction between stages and groups. p ≤ 0.05 was considered significant.

RESULTS

The ICCs for H-S, H-C3RGN, H-PP, H-C3, and H-RGN measurements were 0.99 (95% confidence interval [CI]

= 0.96 to 0.99), 0.86 (95% CI = 0.40 to 0.96), 0.98 (95%

CI = 0.92 to 0.99), 0.96 (95% CI = 0.83 to 0.99), and 0.97 (95% CI = 0.90 to 0.99), respectively. Bland-Altman plots showed a high degree of agreement (Figure 4).

Descriptive statistics of the measurements are presented in Table 1. In this table, mean values and standard devia- tions of the measurements according to the stages are shown for both OBG and CG.

With regard to the vertical movement of the hyoid bone (Tables 2 and 3), the OBG and CG showed significant decreases in the H-S measurement (p < 0.001 and p <

0.01, respectively) between stages 1 and 2 and between stages 1 and 3. However, the groups showed significant increases (p < 0.001 and p < 0.01, respectively) at stage 4, as determined by the comparisons between stages 2 and 4 and stages 3 and 4. However, only the OBG showed a significant difference between stages 1 and 4 (p < 0.05).

Similarly, the H-C3RGN measurement significantly decreased between stages 1 and 2 and between stages 1 and 3, but significantly increased between stages 2 and 4

and stages 3 and 4 in the OBG (p < 0.01). On the other hand, in the CG, this measurement showed significant changes only between stages 1 and 2 (p < 0.01) and stages 1 and 3 (p < 0.05). Moreover, both groups showed significant decreases in the H-PP measurement at stages 2 and 3 when compared with stage 1 (p < 0.001 for the OBG; p < 0.01 and p < 0.001, respectively, for the CG).

Significant increases in this measurement were also found between stages 2 and 4 and between stages 3 and 4 in the OBG (p < 0.001) and CG (p < 0.05 and p < 0.01, respectively).

Figures 5A-5C show the displacement of the hyoid bone according to the H-S, H-C3RGN, and H-PP measure- ments in both groups. The hyoid bone was located more inferiorly at all stages in the OBG than in the CG. In terms of the H-S and H-C3RGN measurements, the hyoid bone reached its most superior position at stage 3 in both groups. However, in the case of H-PP, the hyoid bone reached its most superior position at stage 2 in the OBG.

In the evaluation of the horizontal movement (Tables 2 and 3) of the hyoid bone, a significant increase in the H-C3 measurement was observed in between stages 1 and 2 in the OBG (p < 0.001) and CG (p < 0.01). Although the increases between stages 1 and 3 and stages 1 and 4 were not significant in the OBG (p > 0.05), they were significant in the CG (p < 0.05). The H-C3 measurement decreased between stages 2 and 3, stages 2 and 4, and stages 3 and 4 in both groups, but a significant change was determined only between stages 2 and 4 in the OBG (p < 0.05). When the H-RGN measurement was evaluated, a significant decrease between stages 1 and 2 was found in both the OBG (p < 0.05) and the CG (p < 0.001). A significant decrease was also found between stages 1 and 3 in the CG (p < 0.05). This measurement increased between stages 2 and 3, stages 2 and 4, and stages 3 and 4 in both groups,

Table 1. Descriptive statistics of the measurements (unit : mm)

Stage 1 Stage 2 Stage 3 Stage 4

H-S OBG 115.33 (6.544) 102.83 (7.446) 101.17 (7.687) 114.11 (6.258)

CG 105.05 (7.089) 95.85 (9.281) 95.90 (9.049) 104.55 (7.977)

H-C3RGN OBG 14.89 (1.875) 13.11 (2.349) 12.89 (1.875) 15.00 (2.196)

CG 13.20 (2.042) 11.20 (2.587) 11.30 (3.097) 12.65 (3.528)

H-PP OBG 67.78 (3.474) 61.22 (4.882) 61.61 (4.717) 67.94 (3.811)

CG 60.75 (3.291) 55.60 (6.336) 54.60 (4.210) 59.60 (5.557)

H-C3 OBG 33.56 (2.595) 36.72 (2.653) 35.06 (3.134) 35.00 (2.029)

CG 35.70 (3.854) 39.05 (4.058) 38.30 (3.757) 38.05 (3.103)

H-RGN OBG 36.06 (4.108) 32.33 (3.272) 34.94 (3.489) 35.11 (3.394)

CG 39.25 (3.059) 35.85 (2.323) 36.90 (3.354) 37.15 (2.777)

Values are presented as mean (standard deviation).

OBG, Open bite group (n = 18); CG, control group (n = 18).

Refer to Figure 3 for measurements and abbreviations.

(6)

but significant changes were determined only between stages 2 and 3 and stages 2 and 4 in the OBG (p < 0.05).

The hyoid bone was closer to the third cervical vertebra and retrognathion at all stages in the OBG when com- pared to the CG (Figure 5D and 5E). According to H-C3 and H-RGN measurements, the hyoid bone reached its most anterior position at stage 2 and returned to its normal position gradually during stages 3 and 4 in both

groups.

Interactions between groups and stages had no signifi- cant effects on the measurements (p > 0.05). How ever, when these factors were analyzed individually, the effects of group on the measurements were found to be significant (p < 0.001 for H-S, H-PP, and H-RGN; p <

0.01 for H-C3RGN and H-C3). Similarly, stage also had significant effects (p < 0.001 for H-S and H-PP; p < 0.01 Table 2. Differences in the measurements between the stages of deglutition in the open bite group (n=18)

Stage

Paired differences

t p-value

Mean Standard

deviation Standard error mean

H-S 1 - 2 12.500 7.733 1.823 6.858 0.000*

1 - 3 14167 8.726 2.057 6.888 0.000*

1 - 4 1.222 2.315 0.546 2.240 0.039*

2 - 3 1.667 5.099 1.202 1.387 0.183

2 - 4 −11.278 7.274 1.715 −6.577 0.000*

3 - 4 −12.944 7.840 1.848 −7.005 0.000*

H-C3RGN 1 - 2 1.778 1.833 0.432 4.115 0.001*

1 - 3 2.000 2.425 0.572 3.499 0.003*

1 - 4 −0.111 2.166 0.511 −0.218 0.830

2 - 3 0.222 2.579 0.608 0.366 0.719

2 - 4 −1.889 2.632 0.620 −3.045 0.007*

3 - 4 −2.111 2.847 0.671 −3.146 0.006*

H-PP 1 - 2 6.556 5.159 1.216 5.391 0.000*

1 - 3 6.167 5.854 1.380 4.470 0.000*

1 - 4 −0.167 4.004 0.944 −0.177 0.862

2 - 3 −0.389 4.578 1.079 −0.360 0.723

2 - 4 −6.722 5.859 1.381 -4.868 0.000*

3 - 4 −6.333 4.887 1.152 −5.498 0.000*

H-C3 1 - 2 −3.167 2.792 0.658 −4.812 0.000*

1 - 3 −1.500 4.260 1.004 −1.494 0.154

1 - 4 −1.444 3.258 0.768 −1.881 0.077

2 - 3 1.667 4.678 1.103 1.512 0.149

2 - 4 1.722 3.268 0.770 2.236 0.039*

3 - 4 0.056 3.572 0.842 0.066 0.948

H-RGN 1 - 2 3.722 5.707 1.345 2.767 0.013*

1 - 3 1.111 6.144 1.448 0.767 0.453

1 - 4 0.944 4.608 1.086 0.870 0.397

2 - 3 −2.611 4.118 0.971 −2.690 0.015*

2 - 4 −2.778 4.622 1.089 −2.550 0.021*

3 - 4 −0.167 5.448 1.284 −0.130 0.898

*Statistically significant (by 2-tailed test).

Refer to Figure 3 for measurements and abbreviations.

(7)

for H-RGN, H-C3RGN, and H-C3) (Table 4).

DISCUSSION

The hyoid bone moves upward and downward by the contraction of the suprahyoid musculature and relaxation of the cricopharyngeus.

21

This synergistic contraction and relaxation also facilitates displacement of the tongue, pulls the larynx forward and upward, and opens the

upper esophageal sphincter, permitting the bolus to enter the esophagus.

21,22

These phenomena are accompanied by the sealing of the larynx, which is essential for safe swallowing. As the suprahyoid muscles are attached to several craniofacial landmarks, including the mandibular symphysis, inferior border of the mandible, base of the skull, and tongue, a relationship exists between the hyoid, tongue, and mandible during swallowing.

Previous studies using cine MRI revealed that move- Table 3. Differences in the measurements between the stages of deglutition in the control group (n=18)

Stage

Paired differences

t p-value

Mean Standard

deviation Standard error mean

H-S 1 - 2 9.200 9.666 2.161 4.257 0.000*

1 - 3 9.150 13.531 3.026 3.024 0.007*

1 - 4 0.500 3.804 0.851 0.588 0.564

2 - 3 −0.050 12.800 2.862 −0.017 0.986

2 - 4 −8.700 10.579 2.365 −3.678 0.002*

3 - 4 −8.650 13.888 3.105 −2.785 0.012*

H-C3RGN 1 - 2 2.000 2.449 0.548 3.651 0.002*

1 - 3 1.900 2.972 0.665 2.859 0.010*

1 - 4 0.550 3.348 0.749 0.735 0.471

2 - 3 −0.100 3.493 0.781 −0.128 0.899

2 - 4 −1.450 4.383 0.980 −1.480 0.155

3 - 4 −1.350 4.271 0.955 −1.414 0.174

H-PP 1 - 2 5.150 7.250 1.621 3.177 0.005*

1 - 3 6.150 4.452 0.995 6.178 0.000*

1 - 4 1.150 4.308 0.963 1.194 0.247

2 - 3 1.000 6.122 1.369 0.731 0.474

2 - 4 −4.000 7.616 1.703 −2.349 0.030*

3 - 4 −5.000 6.601 1.476 −3.387 0.003*

H-C3 1 - 2 −3.350 4.404 0.985 −3.402 0.003*

1 - 3 −2.600 4.535 1.014 −2.564 0.019*

1 - 4 −2.350 4.848 1.084 −2.168 0.043*

2 - 3 0.750 3.567 0.798 0.940 0.359

2 - 4 1.000 5.099 1.140 0.877 0.391

3 - 4 0.250 3.611 0.807 0.310 0.760

H-RGN 1 - 2 3.400 3.331 0.745 4.565 0.000*

1 - 3 2.350 4.557 1.019 2.306 0.033*

1 - 4 2.100 4.564 1.021 2.058 0.054

2 - 3 −1.050 3.034 0.679 −1.547 0.138

2 - 4 −1.300 4.181 0.935 −1.390 0.180

3 - 4 −0.250 4.038 0.903 −0.277 0.785

*Statistically significant (by 2-tailed test).

Refer to Figure 3 for measurements and abbreviations.

(8)

ments during deglutition are affected by the dentofacial morphology and adaptive changes at the tip, dorsum, and root of the tongue.

18,23-25

Fujiki et al.

17

and Akin et al.

18

reported compensatory coordination of tongue move- ment, soft palate movement, and pharyngeal constrictor muscle activity during deglutition in patients with open bite, but the effects on hyoid bone movements during

deglutition were not evaluated. Therefore, we evaluated

the effects of anterior open bite on hyoid bone movements

during deglutition by cine MRI, a noninvasive and reliable

technique. To the best of our knowledge, no such study

has ever been performed. The turbo-FLASH sequence

was preferred because this sequence provides the best

temporal resolution and sufficient spatial resolution

Figure 5. Plots of the mean A, H-S; B, H-C3RGN; C, H-

PP; D, H-C3; and E, H-RGN values as a function of the

stages of deglutition in the open bite group (group 1)

and the control group (group 2). Refer to Figure 3 for

measurements and abbreviations.

(9)

during motion.

26

Water-swallowing sets are reportedly more reliable than dry-swallowing sets for distinguishing the stages of deglutition because the borders of soft tissues, especially the tongue, can be easily and correctly determined.

23

In this study, we used 10 mL water as the bolus. Standardization of the bolus volume is also important because it affects the movements of the hyoid bone.

27

In the current study, the vertical measurements revealed that patients with open bite had an inferiorly positioned hyoid bone during all stages of deglutition. When the movement of the hyoid bone was evaluated according to sella and the plane connecting the third cervical verte- bra and retrognathion, both groups showed superior displacement of the hyoid bone from stage 1 to stages 2 and 3. The hyoid bone reached its most superior position at stage 3 and nearly returned to its initial position at stage 4. However, evaluation according to the PP revealed that the hyoid bone reached its most superior position at stage 2 in patients with open bite. This difference is probably related to anterior rotation of the PP frequently encountered in patients with anterior open bite. Ander- sen

12

and Subtelny and Sakuda

13

compared the vertical positions of the hyoid bone between patients with open bite and those with normal occlusion. Contrary to our findings, they found no significant differences between these groups. However, supporting our results, Haralabakis et al.

9

found that the distance between the hyoid bone and PP is greater in patients with open bite, indicating an inferior position of the hyoid bone.

With regard to the horizontal measurements, the hyoid bone was closer to both the third cervical vertebra and retrognathion in patients with open bite. This result may seem to be conflicting. However, posterior rotation of the mandible is common in patients with anterior open bite

28

and may explain our findings. Depending on posterior mandibular rotation, the symphysis is located more inferiorly and posteriorly in these patients. The horizontal measurements revealed that, in both groups, the hyoid bone was displaced anteriorly from stage 1 to stage 2, reached its most anterior position at stage 2, and was gradually displaced in a posterior direction at stages 3 and 4. The inferior and posterior positioning of the hyoid

bone during all stages of deglutition in patients with open bite can be explained by the released tension of the suprahyoid muscles.

Similar to our findings, many previous studies have showed a close association between the inclination of the hyoid bone and mandibular inclination.

7,9,29

Tallgren and Solow

7

reported that the vertical positional changes in the hyoid bone follow the patterns of change in mandi bular inclination, whereas the horizontal positional changes mainly follow the changes in cervical inclination and craniofacial angulation. In our opinion, the closer posi- tion of the hyoid bone to the third cervical vertebra in patients with open bite is related to hyperextension of the head in these patients, causing the cervical spine to be stretched and decreasing the distance between the third cervical vertebra and hyoid bone. In accordance with our view, Opdebeeck et al.

30

reported that the cross-section of the lower pharynx is reduced and that the hyoid bone is closer to the cervical spine in subjects with a high FMA.

Encroachment of the vital pharyngeal space induces stret ching of the cervical spine and hyperextension of the head. Jena and Duggal,

29

who evaluated hyoid bone posi tion in subjects with different vertical jaw dysplasias, also reported that subjects with short face and long face syndromes have anteriorly and posteriorly positioned hyoid bones, respectively. Haralabakis et al.

9

found that the horizontal distance between the hyoid bone and the perpendicular line from the FH plane at porion is greater in patients with open bite, indicating a more posterior position of the hyoid bone. However, Subtelny and Sakuda

13

found no difference in the horizontal position of the hyoid bone in patients with open bite, contrary to our findings.

CONCLUSION

1. Real-time B-TFE cine MRI is a valuable tool to evaluate the movements of the hyoid bone during deglutition.

2. The hyoid bone reaches its most anterior and superior positions at the oral (stage 2) and pharyngeal (stage 3) stages of deglutition, respectively. Open bite does not affect the displacement pattern of the hyoid bone during deglutition.

Table 4. Effects of group and stage on the measurements

H-S H-C3RGN H-PP H-C3 H-RGN

F p F p F p F p F p

Group 58.467 0.000* 16.583 0.001* 112.700 0.000* 16.696 0.001* 28.243 0.000*

Stage 14.267 0.000* 9.610 0.001* 11.455 0.000* 7.279 0.003* 10.518 0.001*

Group × stage 1.404 0.280 0.053 0.983 0.518 0.677 0.264 0.850 0.975 0.431

*Statistically significant (by repeated-measures ANOVA).

Refer to Figure 3 for measurements and abbreviations.

(10)

3. The hyoid bone is positioned more inferiorly and posteriorly in patients with open bite because of rele- ased tension of the suprahyoid muscles.

REFERENCES

1. Rocabado M. Biomechanical relationship of the cranial, cervical, and hyoid regions. J Cranioman- dibular Pract 1983;1:61-6.

2. Hayes RJ, Sarver DM, Jacobson A. The quantification of soft tissue cervicomental changes after mandibular advancement surgery. Am J Orthod Dentofacial Orthop 1994;105:383-91.

3. Güven O, Saraçoğlu U. Changes in pharyngeal airway space and hyoid bone positions after body ostectomies and sagittal split ramus osteotomies. J Craniofac Surg 2005;16:23-30.

4. Marşan G, Oztaş E, Cura N, Kuvat SV, Emekli U.

Changes in head posture and hyoid bone position in Turkish Class III patients after mandibular setback surgery. J Craniomaxillofac Surg 2010;38:113-21.

5. Gobeille DM, Bowman DC. Hyoid and muscle changes following distal repositioning of the tongue.

Am J Orthod 1976;70:282-9.

6. Adamidis IP, Spyropoulos MN. The effects of lymph- adenoid hypertrophy on the position of the tongue, the mandible and the hyoid bone. Eur J Orthod 1983;5:287-94.

7. Tallgren A, Solow B. Hyoid bone position, facial morphology and head posture in adults. Eur J Orthod 1987;9:1-8.

8. Behlfelt K, Linder-Aronson S, Neander P. Posture of the head, the hyoid bone, and the tongue in children with and without enlarged tonsils. Eur J Orthod 1990;12:458-67.

9. Haralabakis NB, Toutountzakis NM, Yiagtzis SC. The hyoid bone position in adult individuals with open bite and normal occlusion. Eur J Orthod 1993;15:265- 10. Fromm B, Lundberg M. Postural behaviour of the 71.

hyoid bone in normal occlusion and before and after surgical correction of mandibular protrusion. Sven Tandlak Tidskr 1970;63:425-33.

11. Bibby RE, Preston CB. The hyoid triangle. Am J Orthod 1981;80:92-7.

12. Andersen WS. The relationship of the tongue-thrust syndrome to maturation and other factors. Am J Orthod 1963;49:264-75.

13. Subtelny JD, Sakuda M. Open bite: diagnosis and treatment. Am J Orthod 1964;50:337-58.

14. Mays KA, Palmer JB, Kuhlemeier KV. Influence of craniofacial morphology on hyoid movement: a preliminary correlational study. Dysphagia 2009;24:

71-6.

15. Sloan RF, Bench RW, Mulick JF, Ricketts RM, Brummett SW, Westover JL. The application of cephalometrics to cinefluorography: comparative analysis of hyoid movement patterns during deglu- tition in Class I and Class II orthodontic patients.

Angle Orthod 1967;37:26-34.

16. Fujiki T, Takano-Yamamoto T, Noguchi H, Yamashiro T, Guan G, Tanimoto K. A cineradiographic study of deglutitive tongue movement and nasopharyngeal closure in patients with anterior open bite. Angle Orthod 2000;70:284-9.

17. Fujiki T, Inoue M, Miyawaki S, Nagasaki T, Tanimoto K, Takano-Yamamoto T. Relationship between maxil- lofacial morphology and deglutitive tongue movement in patients with anterior open bite. Am J Orthod Dentofacial Orthop 2004;125:160-7.

18. Akin E, Sayin MO, Karaçay S, Bulakbaşi N. Real-time balanced turbo field echo cine-magnetic resonance imaging evaluation of tongue movements during de- glutition in subjects with anterior open bite. Am J Orthod Dentofacial Orthop 2006;129:24-8.

19. Yılmaz F, Sağdıç D, Karaçay S, Akin E, Bulakbası N.

Tongue movements in patients with skeletal Class II malocclusion evaluated with real-time balanced turbo field echo cine magnetic resonance imaging. Am J Orthod Dentofacial Orthop 2011;139:e415-25.

20. Cunningham JB, McCrum-Gardner E. Power, effect and sample size using GPower: practical issues for researchers and members of research ethics committees. Evid Based Midwifery 2007;5:132-6.

21. Sivarao DV, Mehendale HM. 2-Butoxyethanol auto- protection is due to resiliance of newly formed eryth- rocytes to hemolysis. Arch Toxicol 1995;69:526-32.

22. Palmer JB, Rudin NJ, Lara G, Crompton AW. Coor- dination of mastication and swallowing. Dyspha gia 1992;7:187-200.

23. Karaçay S, Akin E, Sayin MO, Bulakbaşi N. Real time balanced turbo field echo Cine-MRI in the analysis of deglutition events and transit times. J Oral Rehabil 2006;33:646-53.

24. Görgülü S, Sağdıç D, Akin E, Karaçay S, Bulakbası N. Tongue movements in patients with skeletal Class III malocclusions evaluated with real-time balanced turbo field echo cine magnetic resonance imaging.

Am J Orthod Dentofacial Orthop 2011;139:e405-14.

25. Karacay S, Akin E, Ortakoglu K, Bengi AO. Dynamic MRI evaluation of tongue posture and deglutitive movements in a surgically corrected open bite. Angle Orthod 2006;76:1057-65.

26. Anagnostara A, Stoeckli S, Weber OM, Kollias SS.

Evaluation of the anatomical and functional properties of deglutition with various kinetic high-speed MRI sequences. J Magn Reson Imaging 2001;14:194-9.

27. Dodds WJ, Man KM, Cook IJ, Kahrilas PJ, Stewart

(11)

ET, Kern MK. Influence of bolus volume on swallow- induced hyoid movement in normal subjects. AJR Am J Roentgenol 1988;150:1307-9.

28. Grabber TM, Vanarsdall RL, Vig K. Orthodontics:

Current principals and techniques. 4th ed. St. Louis:

Mosby; 2005.

29. Jena AK, Duggal R. Hyoid bone position in subjects

with different vertical jaw dysplasias. Angle Orthod 2011;81:81-5.

30. Opdebeeck H, Bell WH, Eisenfeld J, Mishelevich D.

Comparative study between the SFS and LFS rotation

as a possible morphogenic mechanism. Am J Orthod

1978;74:509-21.

수치

Figure 1. Anatomical structures visible on cine magnetic  resonance imaging (a) nasal cavity, (b) nasopharynx, (c)  tongue, (d) lips, (e) incisors, (f) floor of the mouth, (g)  hyoid bone, (h) symphysis, (i) pharynx, (j) larynx, (k) spinal  column, (l) spi
Figure 3. Measurements used for evaluating hyoid bone  movements. (1) H-S, distance between hyoidale (H, the  most anterosuperior point of the hyoid bone) and point  sella (S); (2) H-PP, perpendicular distance of hyoidale  to the palatal plane (PP); (3) H-
Figure 4. Bland-Altman plots of the average differences  in  the  measurements.  A,  H-S;  B,  H-C3RGN;  C,  H-PP;
Table 1. Descriptive statistics of the measurements (unit : mm)
+2

참조

관련 문서

In other words the mother's scholarship who have a lot of conversation time with child in home also influences the father's open communication type and

In 4-week group, the group filled with bone graft with decortication revealed larger new bone formation area than shown in the group that had a defect area

The result of using PLGA nanofiber membrane with bone graft material showed that the PLGA nanofiber membrane in the experimental group of 2 weeks were ten times more new

The defect area was filled with new-bone formation around the graft material hydroxy-apatite (open stars) at the periphery and chronic inflammation with

: Bone response to unloaded titanium implants with a sandblasted and acid-etched surface : A histomorphometric study in the canine mandible.. : Early

Bone transplants, autogenous bones, allogenic bones, xenogenic bones, and synthetic bone substitutes have all been used as bone graft materials.. However,

Based on the efforts of the lower open stage where they expanded open areas by strengthening continually the Chinese trade field, international cooperative relationship

This study aimed to evaluate the site and extent of injury, injury mechanism, player position, and the reinjury incidence in the hamstring by using magnetic