https://doi.org/10.7848/ksgpc.2017.35.5.415
A Combinatorial Optimization for Influential Factor Analysis: a Case Study of Political Preference in Korea
Yun, Sung Bum
1)ㆍYoon, Sanghyun
2)ㆍHeo, Joon
3)Abstract
Finding influential factors from given clustering result is a typical data science problem. Genetic Algorithm based method is proposed to derive influential factors and its performance is compared with two conventional methods, Classification and Regression Tree (CART) and Chi-Squared Automatic Interaction Detection (CHAID), by using Dunn’s index measure. To extract the influential factors of preference towards political parties in South Korea, the vote result of 18
thpresidential election and ‘Demographic’, ‘Health and Welfare’,
‘Economic’ and ‘Business’ related data were used. Based on the analysis, reverse engineering was implemented.
Implementation of reverse engineering based approach for influential factor analysis can provide new set of influential variables which can present new insight towards the data mining field.
Keywords: Reverse Engineering, Influential Factor Analysis, Classification and Regression Tree (CART), Chi- Squared Automatic Interaction Detection (CHAID), Genetic Algorithm (GA)
Original article
Received 2017. 9. 29, Revised 2017. 10. 15, Accepted 2017. 10. 26
1) Member, Dep. of Civil Engineering, Yonsei University (Email : [email protected]) 2) Dep. of Civil Engineering, Yonsei University (Email : [email protected])
3) Corresponding Author, Member, Dep. of Civil Engineering, Yonsei University (Email : [email protected])
This is an Open Access article distributed under the terms of the Creative Commons Attribution Non-Commercial License (http://
1. Introduction
The data mining techniques provides researchers with predictive models which can be used to extract insight from certain pools of data. In many cases the data mining techniques focus on prediction model results. Decision tree algorithm C4.5 was used to predict electric outrage rate using electricity transformer related data such as average voltage load and electricity wire length data (He et al., 2016).
Random Forest (RF) algorithm was used to predict ground water nitrate pollution. The result of RF derived lower mean square error than the result of logistic regression method showing the potential of data mining algorithm in terms of prediction model building (Rodriguez-Galiano et al., 2014). However, data mining algorithms can be also used in influential factor analysis. Classification and Regression Tree (CART) and Chi-Square Automatic Interaction Detection
(CHAID) algorithms has been used to derive influential factors from pools of data. Groundwater pollution sensitivity was analyzed with data mining algorithms and CART was used to derive hydrogeological parameters which specifically affects the water pollution level (Yoo et al., 2016). CART was also used in identifying factors which influence severity of injury for drivers in highways and railways (Ghomi et al., 2017). CHAID algorithm was used along with survey data from drug users to derive influential factors which specifically affects men or women to use drugs (Bertoni et al., 2014). CHAID algorithm was also used in tourism marketing field, deriving influential factors which segments the tourism market (Díaz-Pérez and Bethencourt-Cejas, 2016).
Influential factor analysis and finding the optimal
combination of the variables is similar in terms of extracting
relevant variables from massive data pools. The Genetic
Algorithm (GA) has been previously used as combinatorial
optimization problem solver (Bonham et al., 2017; Han et al., 2001), due to the ability to solve both minimization and maximization problems which is required for finding the optimal solution (Deb et al., 2000; Vaishnav et al., 2017). The similarity between data mining and optimization problem solving allows the usage of optimization characteristics of GA for influential factor analysis (Gandomi et al., 2016).
In this paper, we suggest a GA based method to extract influential variables from numerous pools of data and compare its performance with two conventional data mining methods – CART and CHAID. The test dataset was the vote result from 18th presidential election in South Korea. Political election has been widely studied in terms of analyzing the correlation between factors which can affect the voters to vote for certain party (Song, 2017). ‘Micro-targeting’ based study was also conducted, using the American National Election Studies (ANES) data, where researcher utilized C4.5 decision tree algorithm to predict the election result (Murray and Scime, 2010). Although Murray and Scime utilized data mining algorithm, the usage of ANES data limited the study to draw out election campaign related factors and prediction results. The study was further elaborated for social science data analysis (Scime and Murray, 2013).
Unlike the conventional methods of analyzing the correlation between specific factors, author suggests influential factor analysis method to derive politically influential factors. The vote result was divided into 5 clusters which will be the target variables of CART, CHAID and GA. The influential factors were extracted from 497 explanatory variables including ‘Demographic’, ‘Health and Welfare’, ‘Economic’
and ‘Business’. Based on the analysis, reverse engineering technique was implemented to analyze each factor, which provided a meaningful insight.
2. Material
2.1 Study area
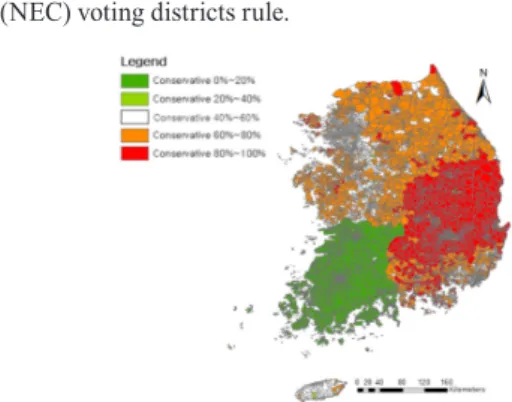
Due to high regional political preference between Gyung- Sang Do and Jeon-Ra Do area shown in Fig. 1, the study has focused on Seoul area where the difference between regional political preference is relatively low. Seoul consists of 1,535
(NEC) voting districts rule.
2.2 Dataset
The voting districts map used for the study was created by using the voting districts rule provided by NEC. The voting districts rule is a list of administrative districts - ‘Dongs’
which make up a certain voting district. Since the voting districts map was not available in NEC, author created voting districts map of Seoul from a census map, using the voting districts rule by merging the specified areas. The vote poll results were also acquired from NEC. Vote poll data contains the results of each voting districts, along with the number of eligible voters in the area. Total 8,145,787 people were eligible for 18
thpresidential election vote poll data at Seoul.
The result of the vote has shown that more than 95% of the votes were casted to the 2 major parties, even though there were 7 candidates including the representative for 3 parties and 4 independent candidates. Thus, only the votes for 2 major parties were used for this research.
479 explanatory variables including ‘Demographic’,
‘Health and Welfare’, ‘Economic’ and ‘Business’ related data were acquired from Korean Statistical Information Service (KOSIS). Out of 479 variables, 62 variables are related to
‘Demographic’, 188 variables are related to ‘Health and Welfare’, 48 variables are related to ‘Economic’, and 181 variables are related to ‘Business’.
3. Method
Fig. 1. Political preference map of South Korea with 5
preference classes
3.2 Categorizing
The vote results and districts must be categorized into distinct classes to apply the influential factor analysis. In South Korea, two major political parties existed in 18
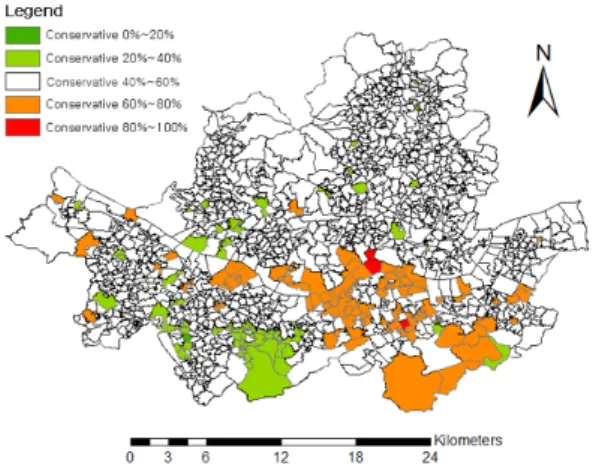
thpresidential election. These two parties have political characteristics of conservative and progressive. Since these two parties took up 99% of the votes in Seoul, the study only focused on these two parties. The regions were categorized into 5 classes of preference level and the categorized classes are listed in Table 1. Fig. 3 depicts the spatial reference voting districts map of Seoul colored with respect to preference classes.
mentioned in section 2.1. The vote result of Korean 18th presidential election was categorized into 5 groups, and the result was spatially joined to each voting districts. Since the dataset provided by KOSIS is based on census block map, 479 dataset values had to be either divided or merged together in order to fit the voting districts map. Due to this reason, the data values were distributed by using area based calculation.
The census based dataset is modified by using area ratio of voting districts and census blocks.
(1)
Where V
vdis the data value of voting district, V
censusis the data value of original census block, A
vdis area of voting district and A
censusis the area of census block aligning with voting district.
After the dataset was distributed to each voting district, all the dataset was normalized into values between 0 and 1, in order to be utilized by data mining algorithms. Eq. (2) is the equation used for normalizing the data values.
(2)
Where V
normis normalized value inserted in voting district, V
vdis original value from Eq. (1), V
max, V
minis the maximum and minimum value of specific data.
After preprocessing process, three data mining algorithms were implemented. The CART and CHAID provides tree model results and GA provides ‘fittest’ chromosome, representing clusters.
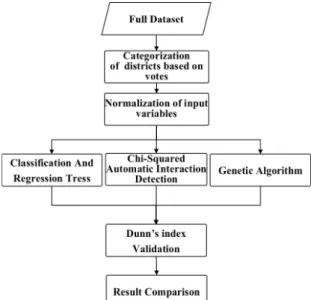
Output of each algorithms were compared using Dunn’s index. Dunn’s index was used for checking separability of clusters computed from the given set of influential variables and mining algorithms. The flow chart of the study is depicted in Fig. 2.
Fig. 2. Flow chart of the study
vd census vd census
V V A
= A
min max min
norm
V
vdV
V V V
= −
−
Class Description
1 Districts with 0~20% voters preferring conservative party 2 Districts with 20~40% voters preferring conservative party 3 Districts with 40~60% voters preferring conservative party 4 Districts with 60~80% voters preferring conservative party 5 Districts with 80~100% voters preferring conservative party
Table 1. Class categorization based on vote results
3.3 Classification and regression tree (CART) Decision tree is a mining algorithm which is used in data mining and machine learning (Li and Ye, 2001). The purpose of decision tree is to generate rules and relationships between factors, which can result in classification and regression tree model. When target variable is categorical, results of leaf nodes will be presented as classified categorical classes.
When the target variable is continuous value the model’s leaf nodes will be presented in regressed predicted value form. This algorithm is based on binary split where parent node only has two child nodes. For the split of parent node, different methods are used such as gini impurity, information gain, variance reduction.
In this research, gini impurity was applied to determine split rule. Gini impurity measures how well the random dataset is labeled. The impurity is derived by summing the probability of each dataset being labeled correctly, times by the probability of dataset being labeled incorrectly.
Classification and Regression Tree uses gini impurity to selects the occurrence of binary split that maximizes the decrease in impurity.
(3)
Where
I fG( )is the gini impurity value, f
iis the probability of dataset being labeled correctly and m is the number of labels being assigned to the dataset (Grabmeier and Lambe, 2007).
3.4 Chi-square automatic interaction detection (CHAID)
Chi-Squared Automatic Interaction Detection (CHAID) algorithm (Ramaswami and Bhaskaran, 2010) is a type of decision tree data mining method which utilizes significance testing. The CHAID algorithm is applicable in problems where target variables are dependent and categorical. In this study, the preference classes were used as target variables. In CHAID algorithm merging, splitting and stopping procedure is continuously repeated until the tree model grows to the end. In merging process, non-significant categories are merged based on the Bonferoni adjusted p-value and contingency table of target variable. In this procedure, the split is also decided based on the calculated p-value.
Afterwards contingency table is built for each child nodes again. The child nodes then act as parent node, and splits the target variables using the contingency table created in the previous step. The procedure of tree growth is repeated until the tree has reached a specific size. The size of the tree can be set by the user, otherwise the tree grows until no variable is suitable for splitting.
3.5 Genetic algorithm (GA)
In this study, the GA is newly implemented to solve combinatorial optimization problems. Genetic algorithm which was proposed by John Holland is a heuristic based algorithm using the rule ‘survival of the fittest’ (Yang et al., 2012). Genetic algorithm has been researched and applied in many fields. The algorithm consists of four parts, initialization process and genetic operations - selection, crossover, mutation. After initialization, the algorithm repeats the three genetic operation until the threshold is met. The threshold can be set as iteration numbers or genetic algorithm index.
Fig. 4 depicts the genetic algorithm’s workflow.
The main goal of genetic algorithm is to derive ‘strongest chromosome’ which contains maximum dissimilarity between clusters and maximum similarity inside cluster which is pre-given. Using genetic algorithm, the problem is solved heuristically. But the number of resulting factors are unknown until the process is finished. Thus, in this study Fig. 3. Political preference map of Seoul with 5 preference classes
1
( )
m(1 )
G i i
i
I f f f
=
= ∑ −
where x y , is a data element inside a specific cluster.
The resulting model of three different mining algorithm can be evaluated using Dunn’s measure. Depending on the index score, model with higher Dunn’s index value can be presumed as ‘well-classified’ model. On the other hand, model with lower Dunn’s index score can be presumed ‘not well-classified’.
4. Results
4.1 CART
The CART algorithm derived 7 influential factors, which are ‘Age (60-64)’, ‘Male Age (80-84)’, ‘Health Insurance Fee’, ‘Education Level (University)’, ‘Education Level (High School)’, ‘Area of Apartment’, and ‘Female Age (40-44)’.
Out of 7 factors, 3 were age related factors, affecting the preference mostly. Also, ‘Education Level (High School)’
factor was a ‘critical factor’ which divided publics whom were in category 1 and 4. Finally, Dunn’s index of given variables with respect to the clusters was 2.14. Fig. 5 depicts the result of CART in tree model. The decimal number in each node is the normalized value of factors presented in the node, and values in brackets are the percentage ratio of normalized values within the specific factor. For example, ‘Age (60- 64)’, 0.46 represents the normalized value and 35.23% is the equivalent ratio of value 0.46 in the dataset ‘Age (60-64)’. The equivalent ratio represents the percentage ratio within the given data group.
Fig. 5. Classification and regression tree result in tree model
of input variables which had been used. The ‘preference class’ from 1 to 5 was used as ‘clusters’ for genetic algorithm to optimize (Kim et al., 2014). For the current study, the parameter settings for GA is as follows: Initial population – 20, Crossover Candidate – 0.825, Mutation Candidate – 0.05, Number of Generation – 1,000.
3.6 Dunn’s index
For evaluation of each algorithms’ results, Dunn’s index (Maulik and Bandyopadhyay, 2002) was used. The Dunn’s index provides higher value when clusters are ‘well separated’
using the given cluster rules.
(4)
Where n
cis the number of clusters, dist c c ( , )
i jis the distance between clusters c
iand c
j, and diam c ( )
kis the diameter of cluster c
k. The distance between clusters
( , )
i jd c c and the diameter diam c ( )
kcan be defined as below Eq. 5.
(5)
Fig. 4. Genetic algorithm workflow
( )
( ( ) )
1... 1...
1...
min min , max
c c
c
i j
D i n j i n
k
k n
dist c c
I
= = +diam c
=
=
, ,
( , ) min { ( , )}, ( ) max{ ( , )}
i j
i j x c y c
k x y k
dist c c dist x y diam c dist x y
∈ ∈
∈
=
=
4.2 CHAID
The CHAID algorithm derived 6 influential factors, which are ‘Age (60-64)’, ‘Male Age (80-84)’, ‘Health Insurance Fee’,
‘ Area of Parking lot’, and ‘Area of Park’. For CHAID analysis 2 out of 6 factors were age related, showing age is again showing a strong influence on political preference along with CART algorithm result. Finally, the Dunn’s index of given variables with respect to the clusters was 2.43. Fig. 6 depicts the result in tree model. The decimal number in each node is the normalized value of factors presented in the node, and values in brackets are the percentage ratio of normalized values within the specific factor. The equivalent ratio represents the percentage ratio within the given data group.
4.3 GA
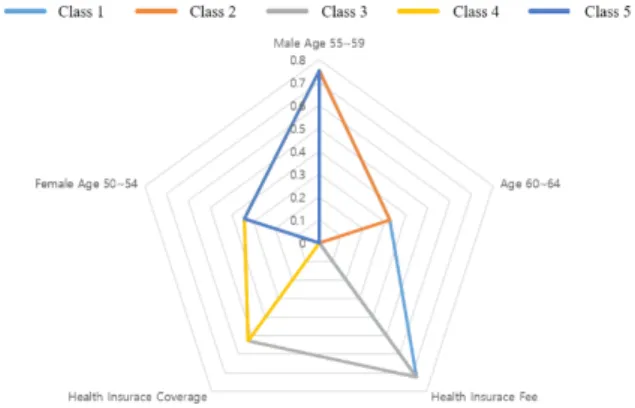
GA based algorithm produced 5 influential factors, which are ‘Male age (55-59)’, ‘Female Age (50-54)’, ‘Age (60-64)’,
‘ Health Insurance Fee’, ‘Health Insurance Coverage’. Dunn’s index of the five factors with respect to given clusters was 2.11. Fig. 7 depicts the result in radar graph model. The graph itself represents the influential factors which characterizes each classes. The result of GA also provides age related factors as influential factor. Also, ‘Health Insurance Fee’
factor was derived from GA along with ‘Health Insurance Coverage’ factor, showing that these two factors have influential effect on people in class 3.
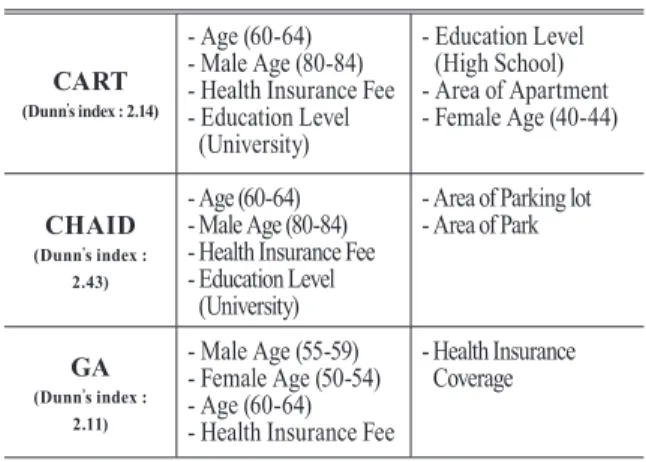
4.4 Result analysis
The influential factors selected by three different algorithms show similarities as listed in Table 2. All three results provided with ‘age related’ factors as influential factors. The correlation between age groups and political preference was frequently mentioned in previous studies (Park and Kim, 2016). The ‘Health Insurance Fee’ factor can be seen as a factor correlating with income rate, since higher income tends to lead to higher health insurance fee.
The ‘Health Insurance Coverage’ factor can be seen only from GA result, depicting higher health insurance coverage rate can cause higher preference towards conservative party.
The ‘Education Level’ factors were only derived from CART and CHAID model. In CART model ‘Education level (High School)’ represents that if more people did not graduate high school, it creates tendency among those people to prefer progressive party. On the contrary, in CART and CHAID result models the factor ‘Education level (University)’
suggests that if more people graduated university, it creates tendency among those people to prefer progressive party.
Lastly area related factors such as ‘Area of Parking lot’,
‘Area of Park’, and ‘Area of Apartment’ were derived only in CART and CHAID results. These factors can represent some descriptions about land use in specific district.
The Dunn’s index was 2.14 for CART, 2.43 for CHAID and 2.11 for GA. CHAID presented the best outcome, followed by CART and GA. The lowest separability result that GA had is Fig. 6. Chi-square automatic interaction detection result in
tree model
Fig. 7. Genetic algorithm result in radar graph model
setting of chromosomes is critical. However, the Dunn’s index result clearly presents that the GA based method can be a solution for influential factor mining problems, and can produce a different insight to a given problem.
5. Conclusion
This study aims to provide a new insight towards extracting influential factors by using reverse engineering technique. The author proposed a Genetic Algorithm based approach for finding optimized combination of variables which can maximize the separability of given clusters, and the outcomes were compared with the conventional data mining methods – CART and CHAID. The overall cluster accuracy was evaluated by Dunn’s index. Even though the GA provided with 2.11 Dunn’s index, which is similar to the CART result, this shows the possibility of GA to be used in data mining fields along with CART.
Due to the heuristic characteristic of GA, the result of genetic algorithm will be changed if the set parameters such as mutation candidate is altered. In order to fully make use of GA, optimal parameters must be derived to provide best result. The optimal parameters for GA may defer as the dataset changes, thus iterative measure should be applied to find the optimal parameters. Also, the class categorization of voters was handled manually by dividing the result by 20%.
Optimizing the categorization process can improve the data mining procedure by creating optimal number of classes.
This can be achieved by either using clustering algorithms
such as k-means and DBSCAN algorithm, or by altering the number of classes. To approve the optimal number of classes, indices such as silhouette index can be implemented.
The research outcomes could be applied not only to political field, but also to many other fields including marketing and business strategy, and finding insights within a set of most influential factors.
Acknowledgement
This research, ‘Geospatial Big Data Management, Analysis and Service Platform Technology Development’, was supported by the MOLIT(The Ministry of Land, Infrastructure and Transport), Korea, under the national spatial information research program supervised by the KAIA(Korea Agency for Infrastructure Technology Advan cement)”(17NSIP-B081011-04)
Reference
Bertoni, N., Burnett, C., Cruz, M. S., Andrade, T., Bastos, F. I., Leal, E., and Fischer, B. (2014), Exploring sex differences in drug use, health and service use characteristics among young urban crack users in Brazil, International Journal for Equity in Health, Vol. 13, No.1, pp. 70-80.
Bonham, D. R., Goodrum, P. M., Littlejohn, R., and Albattah, M. A. (2017), Application of data mining techniques to quantify the relative influence of design and installation characteristics on labor productivity, Journal of Construction Engineering and Management, Vol. 143, No. 8, pp. 52-62.
Deb, K., Agrawal, S., Pratap, A., and Meyarivan, T. (2000), A fast elitist non-dominated sorting genetic algorithm for multi-objective optimization: NSGA-II, Proceedings of International Conference on Parallel Problem Solving from Nature, ICPPSN, 18-20 Sep, Paris, France, Vol. 6, pp.
849-858.
Díaz-Pérez, F. M. and Bethencourt-Cejas, M. (2016), CHAID algorithm as an appropriate analytical method for tourism market segmentation, Journal of Destination Marketing &
Management, Vol. 5, No. 3, pp. 275-282.
Gandomi, A. H., Sajedi, S., Kiani, B., and Huang, Q. (2016), CART
(Dunn’s index : 2.14)
- Age (60-64) - Male Age (80-84) - Health Insurance Fee - Education Level (University)
- Education Level (High School) - Area of Apartment - Female Age (40-44)
CHAID
(Dunn’s index : 2.43)
- Age (60-64) - Male Age (80-84) - Health Insurance Fee - Education Level
(University)
- Area of Parking lot - Area of Park
GA
(Dunn’s index : 2.11)