• 검색 결과가 없습니다.

Tracking the Movement and Distribution of Green Tides on the Yellow Sea in 2015 Based on GOCI and Landsat Images

N/A
N/A
Protected

Academic year: 2021

Share "Tracking the Movement and Distribution of Green Tides on the Yellow Sea in 2015 Based on GOCI and Landsat Images"

Copied!
13
0
0

로드 중.... (전체 텍스트 보기)

전체 글

(1)

1. Introduction

There have been green tides annually at the Yellow Sea since a large-scale green tide occurred there in 2007 (Cui et al., 2012). The major causes of these green tides include eutrophication and increasing numbers of Porphyra yezoensis farms (Liu et al., 2009; Liu et al., 2010; Luo et al., 2012; Huo et al., 2013; Liu et al., 2013; Zhang et al., 2014). Large-scale green algae can

cause enormous economic damage to aquaculture and tourism for collection and disposal (Wang et al., 2009;

Liu et al., 2013).

The maximum effect range of green tides can extend to tens of thousands of square kilometers (Keesing et al., 2011), and thus, satellites can be effectively used to detect them (Hu, 2009). The remote sensing methods that have been used to detect green tides include the Normalized Difference Vegetation Index (NDVI, Hu,

Tracking the Movement and Distribution of Green Tides on the Yellow Sea in 2015

Based on GOCI and Landsat Images

Seung-Hwan Min*, Hyun-Ju Oh*

, Jae-Dong Hwang*, Young-Sang Suh*, Mi-Ok Park**, Ji-Sun Shin***

,

**** and Wonkook Kim***

*Oceanic Climate & Ecology Research Division, National Institute of Fisheries Science (NIFS)

**Department of Oceanography, Pukyong National University

***Korea Ocean Satellite Center, Korea Institution of Ocean Science and Technology (KIOST)

****Department of Convergence Study on the Ocean Science and Technology, Ocean Science and Technology School (OST)

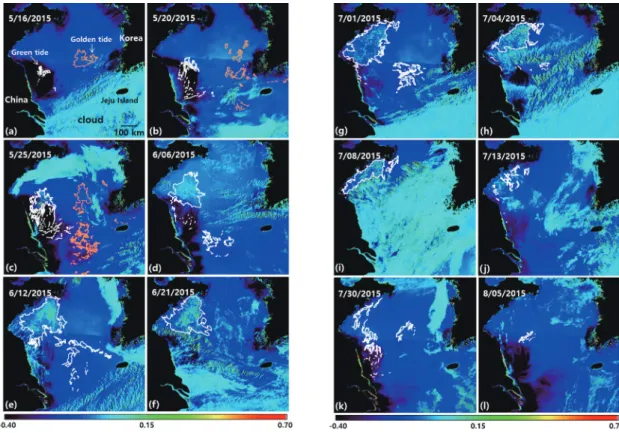
Abstract : Green tides that developed along the coast of China in 2015 were detected and tracked using vegetation indices from GOCI and Landsat images. Green tides first appeared near the Jiangsu Province on May 14 before increasing in size and number and moving northward to the Shandong Peninsula in mid-June.

Typhoon Cham-hom passed through the Yellow Sea on July 12, significantly decreasing the algal population.

An algae patch moved east toward Korea and on June 18 and July 4, several masses were found between the southwestern shores of Korea and Jeju Island. The floating masses found in Korean waters were concentrated at the boundary of the open sea and the Jindo cold pool, a phenomenon also observed at the boundary of coastal and offshore waters in China. Sea surface temperatures, derived from NOAA SST data, were found to play a role in generation of the green tides.

Key Words : Green tide, Yellow Sea, Korean coast, GOCI, Landsat, NDVI

Received January 31, 2017; Revised February 22, 2017; Accepted February23, 2017.

Corresponding Author: Hyun-Ju Oh ([email protected])

This is an Open-Access article distributed under the terms of the Creative Commons Attribution Non-Commercial License (http://creativecommons. org/licenses/by-nc/3.0) which permits unrestricted non-commercial use, distribution, and reproduction in any medium, provided the original work is properly cited

Article

(2)

2009; Shi and Wang, 2009; Choi et al., 2010; Liu et al., 2010; Keesing et al., 2011; Lee et al., 2011; Cui et al., 2012; Son et al., 2012; Xing et al., 2015; Xing and Hu, 2016), Floating Algae Index (FAI, Hu, 2009; Hu et al., 2010; Lee and Lee, 2012; Xing and Hu, 2016), Enhanced Vegetation Index (EVI, Hu, 2009; Son et al., 2012; Son et al., 2015), Virtual-Baseline Floating macroAlgae Height (VB-FAH, Xing and Hu, 2016), Floating Green Algae Index (FGAI, Lee and Lee, 2012), Index of floating Green Algae for GOCI (IGAG, Son et al., 2012; Son et al., 2015), and the visual interpretation of false color images (Lü and Qiao, 2008;

Zhang et al., 2013). While these methods differ in terms of the resolution at which green tide can be quantified, they are all capable of identifying the presence of these algae accurately.

Most satellite-based remote sensing studies on green tides have been carried out on the waters off the coast of China. Green tides sink over time (Lü and Qiao, 2008; Wang et al., 2015) and off the coast of China, most green tides sink in the waters off the Korean Peninsula after passage through the Yellow Sea.

However, even some patch of algae traveling into Korean waters can cause damage. Green tides appeared along the southwestern shore of Korea and around Jeju Island in Korea in 2008 (Choi et al., 2010), 2009 (Kim et al., 2011), 2011 (Son et al., 2012; Son et al., 2015), and 2013 (MBC News, 2013). As for studies on floating green algae found in Korean waters, Choi et al. (2010) identified green tide near Jeju Island during a field study in 2008. Son et al. (2012) also verified that green tides were present in the waters adjacent to Jeju Island and in the southwestern coastal waters of the Korean Peninsula during a field study in 2011. Son et al. (2015) used the Geostationary Ocean Color Imager (GOCI) to find a patch of green algae that reached Korea in 2011 and also estimated its movement using Lagrangian particle tracking experiments.

The current study detected green tide that developed along the northeastern coast of China in 2015 and

tracked their movement into adjacent waters using satellite images. Prior to this study, the characteristic reflectance properties of Ulva prolifera, the main type of floating green algae in the region were known (Liu et al., 2010; Luo et al., 2012; Huo et al., 2013; Zhao et al., 2013; Wang et al., 2015). Data from the 500 m spatial resolution Communication, Ocean, and Meteorological Satellite (COMS) / GOCI were used to detect the green tides and in the case of very small patches, Landsat / Enhanced Thematic Mapper Plus (ETM+) and Operational Land Imager (OLI) data were employed for their higher spatial resolution of 30 m.

Since water temperature is a limiting factor for green algae growth (Kim et al., 1991; Taylor et al., 2001), NOAA Advanced Very High Resolution Radiometer (AVHRR) sea surface temperature (SST) data were used to evaluate the relationship between temperature and the development of floating algae masses. It is anticipated that this study will contribute to the advancement of remote sensing detection methods for green tides and to a better understanding of the occurrence characteristics of green tides in the Yellow Sea, which will be useful for future mitigation efforts.

2. Materials

1) Reflectance measurement of U. prolifera To identify the characteristic reflectance properties of U. prolifera, the primary component of the Yellow Sea green tides, U. prolifera samples were obtained in Muan, Jeollanam-do, South Korea on February 12, 2015 (Fig. 1(a)). An outdoor experiment was carried out for approximately 10 minutes starting at 10:45 local time (01:45 UTC). First, the reflectance of exposed U.

prolifera was measured. The samples were then placed in a box full of filtered sea water to mimic a floating state, and then remeasured.

Reflectance was measured with a hyperspectral

(3)

spectroradiometer (TriOS-RAMSES), which had a spectral resolution of 3.3 nm and a spectral range of 320-950 nm, for a total of 190 channels. The instrument had an accuracy of 0.3 nm. The total water leaving radiance (L

wT

, W/m

2

/nm/sr), skyradiance (L

sky

, W/m

2

/nm/sr), and downwelling irradiance (E

d

,W/m

2

) were measured. L

wT

and L

sky

were set at incidence angles of 30˚ from nadir and zenith, respectively, and both were set at a relative azimuth of 135˚ to minimize the effects of sun glint. Remote sensing reflectance (R

rs

) was obtained by using each of these elements in the following equation:

R

rs

= (L

wT

_ F

r

× L

sky

)/E

d

, (1) where F

r

is the Fresnel reflection, or the quantity of light reflected from the surface boundary of water and the atmosphere. Generally, at an acquisition incidence angle of 30˚, reflectance is 2.5% (Austin, 1974).

2) Data and methods for studying the target waters

The target waters of this study included the Yellow Sea, East China Sea, and a portion of the southern waters along the coast of Korea (Fig. 1(a)). Landsat images (30-m resolution) were used for the detection of initial occurrences of floating green algae (Fig. 1(a))

and occurrences of algae in seas adjacent to the Korean Peninsula (B and C in Fig. 1(a)), both which required higher spatial resolution data because of the small size and number of algal masses present. Landsat images were based on the Level 1 data obtained through the United States Geological Survey (USGS, http://glovis.

usgs.gov). The Fast Line-of-sight Atmospheric Analysis of Spectral Hypercubes (FLAASH) atmospheric correction module of ENVI was applied to these images. GOCI images (500-m resolution) were obtained from the Korea Ocean Satellite Center (KOSC, http://kosc.kiost.ac.kr) for the interval of May 16 through August 5, 2015. Only those images collected on well represented green tide were selected.

The Rayleigh-corrected reflectance (R

rc

) was generated by processing the L1B level products through the GOCI Data Processing System (GDPS ver.1.3) to remove atmospheric scattering (Gordon et al., 1988).

The equation for R

rc

is as follows:

R

rc

= πL

TOA

/(F

0

cosθ

0

) _ R

r

, (2) where L

TOA

is the radiance at the top of the atmosphere observed by a satellite sensor, F

0

is the mean solar radiation incident on Earth at the top of the atmosphere level, θ

0

is the solar zenith angle, and R

r

is the reflectance caused by Rayleigh scattering in the Fig. 1. (a) Green tides observations carried out using satellite image. A, B, and C are areas observed via Landsat images, and (b) A

photograph of floating algae taken during the serial oceanographic observations conducted on the East China Sea by the

NIFS on May 31, 2015. This image corresponds to the ★ symbol in Fig. 1(a) (location: 32˚30′57″ N, 124˚17′20.4″ E).

(4)

atmosphere.

Hu (2009) compared the NDVI, EVI, and FAI indices in Moderate Resolution Imaging Spectroradiometer (MODIS) and Landsat images and found that the FAI is the vegetation index least affected by aerosol type and thickness, solar/viewing geometry, and sun glint. Thus, FAI represents the most stable metric for detecting floating marine algae. However, the FAI cannot be applied to GOCI datasets because the GOCI images lack the necessary short-wave infrared (SWIR) band (Lee and Lee, 2012; Son et al., 2012). For this reason, in the current study, the NDVI, a simple method requiring only near-infrared (NIR) and red bands, was used in the GOCI images, while the FAI was used in Landsat images. The NDVI, as it was applied to the GOCI images, was defined as follows (Rouse et al., 1973):

NDVI = (R

rc

,NIR - R

rc,RED

)/(R

rc

,NIR + R

rc,RED

), (3) where R

rc,RED

and R

rc,NIR

are calculated at GOCI bands 5 (660 nm) and 8 (865 nm), respectively.

The FAI, as it was applied to the Landsat images, is defined as follows (Hu, 2009):

FAI = R

rc, NIR

_ R’

rc, NIR

R’

rc

= R

rc, RED

+ (R

rcSWIR

_ R

rc, RED

) (4)

× (λ

NIR

_ λ

RED

)/(λ

SWIR

_ λ

RED

),

where λ

RED

= 662 nm, λ

NIR

= 835 nm, and λ

SWIR

= 1648 nm for Landsat ETM+, and for Landsat OLI, λ

RED

= 654.6 nm, λ

NIR

= 864.6 nm, and λ

SWIR

= 1609 nm.

Water temperature is a crucial factor that limits the growth of Ulva spp. (Kim et al., 1991). SST data collected by the AVHRR sensors onboard the NOAA- 18 and NOAA-19 weather forecasting satellites and directly transmitted to the National Institute of Fisheries Science (NIFS) were used to determine surface water temperatures in this study. The SST data were combined to generate monthly averages for May through August.

3. Results

1) Measured reflectance spectra for U.prolifera

The Rrs spectra of U. prolifera measured by the TriOS spectroradiometer are shown the green region (555 nm, 0.02 sr

-1

). Reflectance increased significantly at 680 nm, and relatively high reflectance was observed in the NIR spectral range (700-900 nm, 0.04-0.11 sr

-1

).

The R

rs

spectra of U. prolifera samples submerged in filtered sea water exhibited approximately 29% lower reflectance than that of the exposed samples. More specifically, the submerged spectra showed a R

rs

decrease of approximately 72% at 555 nm. These results are similar to the radiometric measurements of U.

prolifera acquired during a field study involving healthy and massive bloom conditions conducted by Son et al. (2012). Such decreased reflectance is a result of incident light being absorbed or scattered by the sea water.

2) Detection of floating green algae in the Yellow Sea in 2015 using satellite images The green tides in the Yellow Sea in 2015 were first detected off the coast of the Jiangsu Province on May 14 using the Landsat/ETM+ data (coordinates: 34˚5′

Fig. 2. Laboratory-based reflectance measurements of U.

prolifera. Solid line: average R

rs

spectrum of completely exposed U. prolifera samples; Dotted line: Average R

rs

spectrum of U. prolifera samples submerged in filtered

sea water.

(5)

N, 121˚5′ E, Fig. 1(a)). The Landsat FAI image (Fig.

3(a) and magnified in Fig. 3(b)), clearly shows floating green algae in a light green coloration. These algal masses were confirmed by the GOCI data two days

later (Fig. 4(a)). The detection of the algal mass in the 500 m resolution GOCI images just two days after initial detection in the 30 m Landsat images is indicative of the high growth rate of floating green algae. Wang et al. (2015) stated that floating U.

prolifera can exhibit a maximum growth rate of 26.3 % per day.

Fig. 4 illustrates the chronology of the green tides as detected by the GOCI images. Patches were found off the coast of the Jiangsu Province and in the middle of the Yellow Sea (Fig. 4(a)) on May 16, 2015. Other studies have confirmed that floating green algae blooms occur off the coast of the Jiangsu Province in mid-May (Liu et al., 2009; Keesing et al., 2011; Liu et al., 2013;

Zhang et al., 2014; Wang et al., 2015), whereas their movement to the middle of the Yellow Sea during this period has not been reported. The NIFS carried out a Fig. 3. Landsat ETM+ FAI image taken on May 14, 2015. (a)

Landsat Region A of Fig. 1(a) with white ellipses indicating areas where green tides were observed. (b) A magnification of the area marked with the red square in (a). The green tide appear as light green in the image.

Fig. 4. Chronological images showing the development process of green tides, from their initial appearance on May 16, 2015 to their

final disappearance on August 5, 2015 as observed via GOCI NDVI images. The white ellipses indicate green tide. The orange

ellipses indicate floating algae that are assumed to be golden tide.

(6)

field study in the area ranging from the western to southwestern waters of Korea aboard fisheries vessel TAMGU-8 during a similar period (May 16-21, 2015).

Throughout this study, a band of golden tide, Sargassum horneri, ranging in size from 1 to 300 ha was found by the NIFS along the southwestern coast of the Korean Peninsula and in the waters surrounding Jeju Island (Fig. 5). The golden tides are known to move with the surface currents from Taiwan or the South China Sea to areas of higher latitude (Komatsu et al., 2014). In this regard, the algal patches found by the present study in the area west of the Korean Peninsula on May 16 and 20 (Fig. 4(a), (b)) were likely golden tides. A patch moving from the middle of the East China Sea to the middle of the Yellow Sea was also observed in the May 25

th

image (Fig. 4(c)).

During a series of oceanographic observations conducted on the East China Sea by the NIFS on May 31, 2015, both green algae and brown algae were observed and photographed (Fig. 1(b)). The floating green algae bloomed rapidly and expanded northward between May 20 and 25, with some of the masses moving eastward (Fig. 4(c)). On June 6, most green tides had moved out of the waters of high turbidity, which are identifiable in an NDVI image as waters with negative NDVI values (Fig. 4(d)), while some of them moved eastward from the Jiangsu Province. The entire patch could not be confirmed as green algae because golden tide was found in the field until May 31. At this time, the patch moving northward from the south was no longer present in the images.

The areal extent of green tides reached its maximum off the coast of the Shandong Peninsula on June 12 (Fig. 4(e)), and was maintained until July 8 (Fig. 4(i)).

On June 21, the detection area of green tide was the maximum (Fig. 6). Despite the fact that most of the Yellow Sea was covered with clouds except the part of the Shangdong Peninsula on July 8 (Fig. 4(i)), the area

of green tide sharply decreased on July 13 (Fig. 4(j), Fig. 6), when the weather was relatively clear after the typhoon Cham-hom passed (Fig. 1(a)). On June 12, a portion of the green tides moved to the southeast. This patch moved from the Shandong Peninsula to the East China Sea, and alternatively, a portion moved to an area between Jeollanam-do and Jeju Island. The presence of green tide between Jeollanam-do and Jeju Island was confirmed in the June 18 Landsat/OLI FAI image (Fig.

7(b)) and in the field by the NIFS from June 16-17, 2015 (Fig. 7(a)). On July 1, a portion of the green tides Fig. 5. Distribution of S. horneri detected during a NIFS field study conducted aboard the vessel TAMGU No. 8 from May 15-21, 2015 in the southwest waters off the Korean Peninsula and west waters off Jeju Island. The numbers represent the number of S. horneri patch observed at each site. Each algal patch was 100 × 100 m in areal extent (NIFS, 2015a).

Fig. 6. Area of green tide detected from Fig. 4. The threshold

applied as >0.

(7)

moved to the middle of the Yellow Sea, between Jeollanam-do and Jeju Island (Fig. 4(g)). This patch was verified in the July 4 Landsat/OLI FAI image (Fig.

7(c)) but was not detected in the GOCI NDVI image (Fig. 4(h)). The patch was tens to hundreds of kilometers in size when it passed through the Yellow Sea, whereas it was only 0.01 to 1 km in size when it was found in Korean waters. These data indicate that

the 500 m resolution of GOCI is sufficient for detecting green tide patches of massive sizes but insufficient for detecting the smaller masses that eventually flow into Korean coastal areas.

The GOCI NDVI images detected a small number of green tide distributed from the Shandong Peninsula to the Subei Bank on July 30 (Fig. 4(k)), and the final algal patches were observed on August 5 (central coordinate:

Fig. 7. (a) The region of the western sea off the Korean Peninsula and Jeju Island where green algae U. prolifera were observed during the serial oceanographic observations conducted by the NIFS on June 16 and 17, 2015 (modified from NIFS, 2015b). A: Several colonies of tens of meters or lesser in length were observed; B: Three to four colonies that were 1,000 × 500 m in size observed;

C: colonies of various sizes observed, including one that was 1,000 × 200 m in size, three to four that were 200 × 10 m in size, and three to four that were 100 × 30 m in size. (b) Landsat OLI FAI image acquired on June 18, 2015. The image corresponds to Landsat Region B of Fig. 1(a). The areas where green tides were detected in the image are marked with white ellipses. The area marked with a red boundary is described further in Fig. 8(c). (c) Landsat OLI FAI image acquired on July 4, 2015. The image corresponds to Landsat Region C of Fig. 1(a). The areas where green tides were detected in the image are marked with white ellipses.

Fig. 8. Green tides concentrated at the boundary of turbid waters and the open sea. (a) GOCI NDVI image from May 20, 2015

(a magnification of Fig. 4(b)); (b) GOCI NDVI image from May 5, 2015 (a magnification of Fig. 4(c)); and (c,l) Landsat OLI

FAI image from June 18, 2015 (marked with a red boundary in Fig. 7(b)).

(8)

34˚45′ E, 122˚00′ N, Fig. 4(l)).

Water with high concentrations of suspended sediment exhibits a characteristic reflectance spectrum with a maximum at 555 nm, and a wavelength- dependent decrease throughout the remaining spectrum (Moon et al., 2010). These highly turbid waters are represented by negative vegetation index values and are marked in purple and black in the Landsat OLI FAI image of Fig. 8. In the three images shown, floating green algae are concentrated at the boundary between the open sea and the highly turbid area. Fig. 8(a) and 8(b) show the floating green algae moving out of the highly turbid area off the Chinese coast to the open sea and expanding in the shape of a hammer. Fig. 8(c) provides a magnification of the area marked with a red square in the Landsat OLI FAI image of Fig. 7(b).

Here, a band of floating algae was detected at the boundary between the open sea and water mass where the cold pool of Jindo occurs.

According to the NOAA/AVHRR SST images in

Northeast Asia sea from 1985 to 2009, the Yellow Sea exhibits the greatest change in annual average temperature (17.6˚C) (Min et al., 2010). Large temperature changes in the Yellow Sea are assumed to act as an important limiting factor in the growth of algae. Here, we evaluated the relationship between the development of the algae and water temperature. The monthly average NOAA/AVHRR SST data were used to examine the water temperature where green tide were present (Fig. 9). The SSTs off the coast of the Jiangsu Province where green tide initially appeared in May ranged from 14˚C to 18˚C (Fig. 9(a)). The observation is supported by a previous experiment on algal growth conducted by Kim et al. (1991), which found that the relative growth rates (RGR) of Enteromorpha (now Ulva) linza and Enteromorpha (now Ulva) prolifera (0.85 and 0.80, respectively) were the highest at a temperature of 15˚C. The June water temperatures along the coast of the Jiangsu Province were between 19˚C and 21˚C (Fig. 9(b)). However, the

Fig. 9. Monthly average SST images in the Yellow Sea for May through August 2015 as measured by the AVHRR of NOAA-18 and

NOAA-19 satellites.

(9)

water temperatures off the coast of the Shandong Peninsula where algal blooms occurred were 1˚C to 2˚C colder, between 18˚C and 21˚C. The water temperatures between Jeollanam-do and Jeju Island were between 15˚C and 20˚C, and the cold pool of Jindo was widely developed in Jeollanam-do at approximate spatial bounds of 34-35˚N × 125-127˚E.

The water temperature of the open sea was approximately 1˚C colder than that of the coastal waters at Jeju Island. The July water temperatures were off the coasts of the Jiangsu Province and Shandong Peninsula were 25-26˚C and 23-25˚C, respectively (Fig. 9(c)).

The water temperatures in August, when the last green tide were observed, were in the range of 24-28˚C (Fig.

9(d)). U. linza and U. prolifera have been shown to grow at 25˚C (RGR: 0.55 and 0.30, respectively), but not at 30˚C (Kim et al., 1991).

4. Discussion

The average reflectance values of U. prolifera floating in filtered sea water were 29% lower than completely exposed U. prolifera. The difference appears to be related to the algal area exposed above the water when in a floating state. This suggests that green tide detected on satellites can be underestimated by actual amounts.

The green tides on the Yellow Sea in 2015 were first detected by Landsat images (May 14), and then, larger green algal masses were observed in GOCI images two days afterwards (May 16). These results demonstrate that the algae can exhibit high daily growth rates (Wang et al., 2015). Thus, depending on the period of analysis, it may be possible to use the 500 m resolution GOCI sensor for initial floating algae detections, given its excellent observation frequency of 8 times per day.

Since green tides on the Yellow Sea typically cover a large area, sensors that have a wide observation range are required to identify the entire area impacted. The

GOCI is a geostationary orbit sensor that carries out observations within a range of 2,500 × 2,500 km based around 130˚E × 36˚N, a region that includes the entire area of the Yellow Sea. In Korea, GOCI-II is in development with a planned launch date set for 2019.

It is a geostationary orbit sensor for ocean color observations that will exhibit better performance than the GOCI (spatial resolution: 250 m and observation frequency: 10 times per day). GOCI-II will provide more faster and accurate results in detecting green tide in the Yellow Sea.

Green tides generated in the Yellow Sea along the

coast of China move from the south to the north by

riding the wind-driven surface layer currents (Liu et al.,

2009; Keesing et al., 2011; Lee et al., 2011; Qiao et al.,

2011; Son et al., 2015). Choi et al. (2010) stated that

the mechanism of green tide movement from the coast

of China to adjacent waters through the Yellow Sea is

most consistent with the movement of Changjiang

Diluted Water (CDW). Fig. 4(d) shows a patch of

marine algae moving from the mouth of the Yangtze

River to Jeju Island, verifying the suggestion made by

Choi et al. (2010). However, in the images taken on

June 12

th

and July 1

st

(Fig. 4(e), (g)) a patch was

observed between the Shandong Peninsula and Jeju

Island. The movement of this patch is consistent with

that of tidal residual currents flowing into the southeast

along the Yangtze Bank (Lee and Beardsley, 1999; Lee

et al., 2011). These currents are stronger than the

opposing winds or currents (Lee et al., 2011). A patch

moving to the region between Jeollanam-do and Jeju

Island was found in the June 12 image (Fig. 4(e)). A

weak flow consistent with the movement of this patch

is generated between Jeollanam-do and Jeju Island in

the eastern direction due to tidal residual currents (Lee

and Beardsley, 1999). It seems that the movement of

green tides from the Yellow Sea to adjacent waters is

affected by the combination of tides, CDW, winds, and

currents, which should be further studied to provide a

greater understanding of green tide dynamics in the

(10)

region.

The areal extent of green tide masses significantly decreased as they moved through the Yellow Sea from the Chinese coast. The green tides moving through the middle of the Yellow Sea formed a band that was tens to hundreds of kilometers in length on June 12 (Fig.

4(e)). A smaller band of length 0.01 to 1 km was found between Jeollanam-do and Jeju Island between June 16 and 18 (Fig. 7). A similar observation was made of algae in the middle of the Yellow Sea on July 1 (Fig.

4(g)) and those between Jeollanam-do and Jeju Island on July 4 (Fig. 7(c)).

Ulva spp. and are buoyant because of their hollow pipe structures (Kim et al., 1991) and thus light thalli, wide surface area, and air locked between bodies that are stacked together. They can remain submerged in the water column near the surface as sunken algal (SA) masses. The number SA masses is higher in converging waters than in diverging waters (Lü and Qiao, 2008).

It seems that floating green algae sink as a result of the air emitted over time or because of sea water disturbances. For example, many of the algal masses were removed during and after Typhoon Cham-hom (Fig. 4(j)) due to water disturbance.

Blooming refers to the state where the number of algae reproducing is higher than that of the SA.

Nutrients are crucial for algal reproduction. Algae can reproduce rapidly along the Chinese coast because of the high nutrient levels in those waters. On the other hand, limited reproduction and sinking may be more common in the middle of the Yellow Sea because of the significantly lower amounts of nutrients (Wang et al., 2003). Kim et al. (2011) reported that green algal mats observed in the southeastern Yellow Sea in 2009 were old and less active. These mats may have assumed such a state because they moved through the middle of the Yellow Sea, where nutrients were lacking.

However, green tide observed moving through the CDW, an area containing highly concentrated nutrients, may have been able to reproduce with few limitations

(Choi et al., 2010).

Moreover, it has been found that green tide tend to gather along the boundary of two water masses with different densities (Fig. 8). The development of the Jindo cold pool prevented the inflow of green tide from China in to the coastal region of Jeollanam-do.

However, islands outside of the influence of the Jindo cold pool, notably many archipelagos off the southwestern coast of Korea, may be susceptible to the influx of the algae. In contrast, green tide will easily flow to Jeju Island where the coastal water is unlikely to be developed. As Jeju Island has a great number of incoming and outgoing ships and is highly developed in terms of tourism, it would likely be one of the islands most severely damaged by green tides that move through the Yellow Sea.

Ulva spp. can grow rapidly in optimal water temperatures and nutrient supplies (Liu et al., 2009;

Luo et al., 2012). An appropriate environment for the growth of green tide can be provided by nutrient-rich cold water pulled up to the surface layer by upwelling, strong tidal currents, and southerly and southeasterly winds (Lee et al., 2011). SST images show that the surface waters along the Chinese coast were 1 to 2˚C colder than the open sea from May through August of 2015 (Fig. 9). The findings of Kim et al. (1991) and Luo et al. (2012) indicated that U. prolifera relative growth rate increases as the water temperature increases from 5 to 15˚C, with a peak growth rate occurring at 15˚C. These algae stopped growing at water temperatures between 25˚C and 30˚C in the experiment of Kim et al. (1991), whereas they kept growing at a rate of 16-21% per day even at 30˚C in the experiment of Luo et al. (2012). In an experiment on the growth of eight types of green tide-forming marine algae, except for U. prolifera, most of them showed a very low growth rate in water temperatures between 25 to 30˚C (Taylor et al., 2001).

Most green tide that move to the East China Sea tend

to sink. However, the green tide that move to the coast

(11)

of the Korean Peninsula eventually become stacked up on the coast and have led to problems similar to those experienced in China. Monitoring green tides by using satellites and ships will be necessary for building a better understanding of the bloom formation and degradation processes, and this information may be useful for the design of future mitigation programs. The authors hope that the results of this study will be effectively applied to such activities.

Further research should be carried out modeling the development and movement of the algae in China. Son et al. (2015) hypothesized that green tide will be recurrent, but that their severity will increase or decrease depending on environmental factors (nutrients, temperature, typhoons, etc.). Lastly, green tide moving to the Korean Peninsula may increase with changes to residual flow, particularly tidal residual currents and wind-driven currents. These points should be explored in further detail in future research.

5. Conclusion

The Chinese coast has been receiving much attention regarding the green tides that occur on the Yellow Sea.

The data from this study confirm that portions of these green tides can move to the southwestern shores of the Korean Peninsula, Jeju Island, and the East China Sea through the Yellow Sea. Scientific research is needed to clarify the inter-country movement of green tides, one of the Harmful Algal Blooms (HABs). The efficiency of natural disaster monitoring will be increased by combining a geostationary orbit satellite and a high-resolution polar orbit satellite.

Acknowledgment

This study was part of a project entitled “Research on the characteristics of marine ecosystems and oceanographic observations in Korean waters,” funded

through a grant from the NIFS (R2017049). We would like to express our gratitude to Jae-Hyun Ahn and Boram Lee, researchers at KIOST KOSC, who helped with data processing, and Sang Il Kim, a researcher at NIFS, who gave valuable advice.

References

Austin, R.W., 1974. Inherent spectral radiance signatures of the ocean surface. In: Ocean Color Analysis, Scripps Institute of Oceanography, La Jolla, CA, pp. 2-1-2-20.

Choi, D.L., J.H. Noh, J.H. Ryu, J.H. Lee, P.K. Jang, T.H. Lee and D.H. Choi, 2010. Occurrence of green macroalgae (Ulva prolifera) blooms in the northern East China Sea in summer 2008, Ocean and Polar Research, 32(4): 351-359.

Cui, T.W., J. Zhang, L.E. Sun, Y.J. Jia, W. Zhao, Z.L.

Wang and J.M. Meng, 2012. Satellite monitoring of massive green macroalgae bloom (GMB): Imaging ability comparison of multi-source data and drifting velocity estimation, International Journal of Remote Sensing, 33: 5513-5527.

Gordon, H.R., J.W. Brown and R.H. Evans, 1988.

Exact Rayleigh scattering calculations for use with the Nimbus-7 Coastal Zone Color Scanner, Applied Optics, 27(5): 862-871.

Hu, C., 2009. A novel ocean color index to detect floating algae in the global oceans, Remote Sensing of Environment, 113: 2118-2129.

Hu, C., D. Li, C. Chen, J. Ge, F.E. Muller-Karger, J.

Liu, F. Yu and M.X. He, 2010. On the recurrent Ulva prolifera blooms in the Yellow Sea and East China Sea, Journal of Geophysical Research, 115: C05017.

Huo, Y., J. Zhang, L. Chen, M. Hu, K. Yu, Q. Chen, Q.

He and P. He, 2013. Green algae blooms caused

by Ulva prolifera in the southern Yellow Sea:

(12)

Identification of the original bloom location and evaluation of biological processes occurring during the early northward floating period, Limnology and Oceanography, 58(6): 2206- 2218.

Keesing, J.K., D. Liu, P. Fearns and R. Garcia, 2011.

Inter-and intra-annual patterns of Ulva prolifera green tides in the Yellow Sea during 2007- 2009, their origin and relationship to the expansion of coastal seaweed aquaculture in China, Marine Pollution Bulletin, 62: 1169- 1182.

Kim, J.H., E.J. Kang, M.G. Park, B.G. Lee and K.Y.

Kim, 2011. Effects of temperature and irradiance on photosynthesis and growth of a green-tide-forming species (Ulva linza) in the Yellow Sea, Journal of Applied Phycology, 23:

421-432.

Kim, K.Y., Y.S. Ahn and I.K. Lee, 1991. Growth and morphology of Enteromorpha linza (L.) J. Ag.

and E. prolifera (Müller) J. Ag. (Ulvales, Chlorophyceae), Algae, 6(1): 31-45.

Komatsu, T., S. Mizuno, A. Natheer, A.

Kantachumpoo, K. Tanaka, A. Morimoto, S.T.

Hsiao, E.A. Rothausler, H. Shishidou, M. Aoki and T. Ajisaka, 2014. Unusual distribution of floating seaweeds in the East China Sea in the early spring of 2012, Journal of Applied Phycology, 26: 1169-1179.

Lee, J.H., I.C. Pang, I.J. Moon and J.H. Ryu, 2011. On physical factors that controlled the massive green tide occurrence along the southern coast of the Shandong Peninsula in 2008: A numerical study using a particle-tracking experiment, Journal of Geophysical Research, 116: C12036.

Lee, K.H. and S.H. Lee, 2012. Monitoring of floating green algae using ocean color satellite remote sensing, Journal of the Korean Association of Geographic Information Studies, 15(3): 137-

147.

Lee, S.H. and R.C. Beardsley, 1999. Influence of stratification on residual tidal currents in the Yellow Sea, Journal of Geophysical Research, 104(C7): 15,679-15,701.

Liu, D., J.K. Keesing, Q. Xing and P. Shi, 2009.

World’s largest macroalgal bloom caused by expansion of seaweed aquaculture in China, Marine Pollution Bulletin, 58: 888-895.

Liu, D., J.K. Keesing, Z. Dong, Y. Zhen, B. Di, Y. Shi, P. Fearns and P. Shi, 2010. Recurrence of the world’s largest green-tide in 2009 in Yellow Sea, China: Porphyra yezoensis aquaculture rafts confirmed as nursery for macroalgal blooms, Marine Pollution Bulletin, 60: 1423- 1432.

Liu, D., J.K. Keesing, P. He, Z. Wang, Y. Shi and Y.

Wang, 2013. The world’s largest macroalgal bloom in the Yellow Sea, China: Formation and implications, Estuarine, Coastal and Shelf Science, 129: 2-10.

Luo, M.B., F. Liu and Z.L. Xu, 2012. Growth and nutrient uptake capacity of two co-occurring species, Ulva prolifera and Ulva linza. Aquatic Botany, 100: 18-24.

Lu, X. and F. Qiao, 2008. Distribution of sunken macroalgae against the background of tidal circulation in the coastal waters of Qingdao, China, in summer 2008, Geophysical Research Letters, 35: L23614.

Min, S.H., D.H. Kim and H.J. Yoon, 2010. Temporal and Spatial Analysis of SST in the Northeast Asian Seas Using NOAA/AVHRR data, Journal of the Korea Institute of Marine Information & Communication Sciences, 14(12): 2818-2826.

Moon, J.E., Y.H. Ahn, J.H. Ryu and P. Shanmugam,

2010. Development of Ocean Environmental

Algorithms for Geostationary Ocean Color

Imager (GOCI), Korean Journal of Remote

(13)

Sensing, 26(2): 189-207.

MBC News, 2013. [This time, the Chinese giant green algae… Jeju island twice the size ‘no measures’]. MBC News website. Accessed online at http://imnews.imbc.com/replay/2013 /nwdesk/article/3292634_18585.html NIFS, 2015a. Large Sargassum horneri found in the

Yellow Sea and off the South West coast of Jeju. NIFS website. Accessed online at:

http://www.nifs.go.kr/bbs?id=insmaterial&flag

=pre&boardIdx=2029&site=&gubun=A NIFS, 2015b. Southern Yellow Sea waters Ulva prolifera

appearance information (marine data Breaking News, No. 4686). NIFS website. Accessed online at http://www.nifs.go.kr/bbs?id=newfish&flag=p re&boardIdx=66330)

Qiao, F.L., G.S. Wang, X.G. Lü and D.J. Dai, 2011.

Drift characteristics of green macroalgae in the Yellow Sea in 2008 and 2010, Chinese Science Bulletin, 56(21): 2236-2242.

Rouse, J.W., R.H. Haas, J.A. Schell and D.W. Deering, 1973. Monitoring vegetation systems in the Great Plains with ERTS, Third ERTS Symposium, NASA SP-351: 309-317.

Shi, W. and M. Wang, 2009. Green macroalgae blooms in the Yellow Sea during the spring and summer of 2008, Journal of Geophysical Research, 114,

Son, Y.B., J.E. Min and J.H. Ryu, 2012. Detecting massive green algae (Ulva prolifera) blooms in the Yellow Sea and East China Sea using Geostationary Ocean Color Imager (GOCI) data, Ocean Science Journal, 47(3): 359-375.

Son, Y.B., B.J. Choi, Y.H. Kim and Y.G. Park, 2015.

Tracing floating green algae blooms in the Yellow Sea and the East China Sea using GOCI satellite data and Lagrangian transport simulations, Remote Sensing of Environment, 156: 21-33.

Taylor, R., R.L. Fletcher and J.A. Raven, 2001.

Preliminary studies on the growth of selected

‘green tide’ algae in laboratory culture: Effects of irradiance, temperature, salinity and nutrients on growth rate, Botanica Marina, 44: 327-336.

Wang, B.D., X.I. Wang and R. Zhan, 2003. Nutrient conditions in the Yellow Sea and the East China Sea, Estuarine, Coastal and Shelf Science, 58:

127-136.

Wang, X.H., L. Li, X. Bao and L.D. Zhao, 2009.

Economic cost of an algae bloom cleanup in China’s 2008 Olympic sailing venue, Eos, Transactions American Geophysical Union, 90(28): 238-239.

Wang, Z., J. Xiao, S. Fan, Y. Li, X. Liu and D. Liu, 2015. Who made the world’s largest green tide in China? - an integrated study on the initiation and early development of the green tide in Yellow Sea, Limnology and Oceanography, 60:

1105-1117.

Xing, Q., C. Hu, D. Tang, L. Tian, S. Tang, X.H. Wang, M. Lou and X. Gao, 2015. World’s Largest Macroalgal Blooms alter Phytoplankton Biomass in Summer in the Yellow Sea: Satellite Observations, Remote Sensing, 7, 12297- 12313.

Xing, Q. and C. Hu, 2016. Mapping macroalgal blooms in the Yellow Sea and East China Sea using HJ- 1 and Landsat data: Application of a virtual baseline reflectance height technique, Remote Sensing of Environment, 178: 113-126.

Zhang, J., Y. Huo, H. Wu, K. Yu, J.K. Kim, C. Yarish, Y. Qin, C. Liu, R. Xu and P. He, 2014. The origin of the Ulva macroalgal blooms in the Yellow Sea in 2013, Marine Pollution Bulletin, 89: 276-283.

Zhao, J., P. Jiang, Z.Y. Liu, W. Wei, H.Z. Lin, F.C. Li,

J.F. Wang and S. Qin, 2013. The Yellow Sea

green tides were dominated by one species,

Ulva (Enteromorpha) prolifera, from 2007 to

2011, Chinese Science Bulletin, 58: 2298-2302.

수치

Fig. 2.  Laboratory-based  reflectance  measurements  of  U.
Fig. 4.  Chronological images showing the development process of green tides, from their initial appearance on May 16, 2015 to their final disappearance on August 5, 2015 as observed via GOCI NDVI images
Fig. 6.  Area of green tide detected from Fig. 4. The threshold applied as >0.
Fig. 8.  Green tides concentrated at the boundary of turbid waters and the open sea. (a) GOCI NDVI image from May 20, 2015 (a magnification of Fig
+2

참조

관련 문서