How Smart Workers Cope With Techno-Invasion Stress in Work Domain
Yong-Young Kim
Professor, Division of International Business, Konkuk University
스마트워크 사용자의 업무 영역에서 기술침해 스트레스 대응방안에 관한 연구
건국대학교 국제비즈니스학부 경영학과 교수 김용영
Abstract With diffusion of Smart Work, a problem has been raised that Smart Work makes the boundary between work and nonwork blur, and may cause technostress. In order to find out whether Smart work copes with techno-invasion stress in work domain, we need to understand the precedence factors influencing on job satisfaction and the role of boundary management strategy which Smart Workers actively choose. This paper developed a research model containing a causal relationship among four factors, nonwork-to-work interference, job autonomy, job commitment, and job satisfaction, and the moderation effect of boundary management strategy. The findings show that overall hypotheses were accepted based on the pooled data, but three hypotheses test on job satisfaction by boundary management strategy type differed. These results suggest that in accordance with the boundary management strategy of Smart Work users, different change management need to be prepared.
Key Words : Smart Work, Technostress, Techno-Invasion, Coping, Boundary Management Strategy, Job Satisfaction
요 약 스마트워크가 확산되면서 업무와 비업무의 경계가 모호해 지고 있으며, 이로 인해 테크노스트레스가 유발되고 있다. 그러나 테크노스트레스는 수동적으로 그 결과를 받아들이기 보다는 일과 비업무의 경계를 능동적으로 조절함으 로써 극복될 수 있다. 스마트워크 환경에서 업무/비업무 영역이 모호해지면서 발생하는 업무 영역에서 기술침해로 인 한 스트레스에 대한 대응전략을 파악하기 위해 직무 만족도에 영향을 미치는 요인과 스마트워크 참여자가 적극적으로 선택하는 경계관리전략의 역할을 이해할 필요성이 있다. 본 논문은 비업무의 업무 간섭, 직무 자율성, 직무 몰입, 직무 만족 간의 인과관계와 경계관리전략 유형별 조절 효과를 담은 연구 모델을 개발했다. 스마트워크 참여자를 대상으로 수집된 설문을 분석한 결과, 전체 5개 가설이 채택되었으나, 경계관리전략 유형별로 나눠 검증한 결과는 각 유형에 따라 직무만족에 영향을 주는 3개 가설의 채택과 기각이 상이하게 나타났다. 이러한 결과는 스마트워크 사용자의 경계 관리전략에 따라 차별적인 변화관리를 마련할 필요가 있다는 점을 시사한다.
주제어 : 스마트워크, 테크노스트레스, 기술침해 스트레스, 대응전략, 경계관리전략, 직무만족
*This paper was supported by Konkuk University in 2020.
*Corresponding Author : Yong-Young Kim([email protected]) Received January 21, 2021
Accepted March 20, 2021 Revised March 2, 2021
Published March 28, 2021
1. Introduction
Smart Work is a sophisticated ICT-enabled version of telecommuting to perform tasks conveniently and efficiently anytime, anywhere.
Korean government has pushed for Smart Work pursuing an objective of ‘work-life balance(WLB) with a change of work style’ since 2010. Most of the previous research points to individuals being passive reactive to technostress, but they lacks interest in coping strategies. Individuals crossing work and nonwork domains pursue a boundary management strategy that proactively forms each domain through negotiation and communication[1].
These coping strategies allow individuals to mitigate negative factors, such as technostresses, that could be caused by cross-domain invasions[2]. Therefore, it is necessary to study the personal coping strategies to actively respond to technostress.
In addition, previous research tends to focus on the negative effects of technostress in nonwork areas[3,4] and emphasizes that technostress is a damage to individuals. However, technostress does not only have a negative impact on personal privacy and also on the workplace. In a Smart Work environment where the domains of work and nonwork are blurred, Smart Workers may experience a reduction in their job satisfaction due to cross-domain permeability, which may lead to reduced job performance. There is a possibility that Smart Workers can use the ambiguous boundary between work and nonwork as an opportunity. In other words, they may want to benefit from using this ambiguity for the purpose of dealing with their own personal affairs in the work domain.
Even though job satisfaction is maintained in the work domain, how Smart Workers respond to these Smart Work environments may differ.
There is also a need for an organization adopting Smart Work to understand different paths according to different coping strategies and to
consider responding strategies that can be actively managed by the organization. While the previous research that has focused on nonwork domain, we need to understand the coping strategies that Smart Workers have in response to technostress focusing on the work domain.
Therefore, we need to understand leading factors and mechanism in which job satisfaction is achieved according to the boundary management strategy of Smart Work users. In this study, we will address two research issues :
(1) What are the leading factors that affect job satisfaction for Smart Work users?
(2) What boundary management strategies do Smart Workers use in order to actively cope with blurring boundary stress?
2. Literature Review 2.1 Technostress
Technostress is a new term combining technology and stress, presented by Brod[5]. He defined technostress as “a modern disease of adaptation caused by an inability to cope with the new computer technologies in a healthy manner”. Caro & Sethi[6] said that for those who use technology, it can be stress, and users’
experience of stress depends on their personal characteristics, coping mechanism, or adaptive capabilities. Weil & Rosen[7] extends the existing definition of technostress to “any negative effect on human attitudes, thoughts, behaviors, and psychology that directly or indirectly results from technology”. Recently, technostress is viewed as
“the phenomenon of stress experienced by end users in organizations as a result of their use of ICTs”[8].
Today organizational members face a
technostress phenomenon as follows[8]: (1) In
modern organizations, members use ICT to do
most of their work, and therefore must address a
variety of ICT devices and applications; (2) ICT
devices and applications that are constantly being developed and applied to the job require a lot of knowledge and learning costs to adapt to each new level; (3) ICT is changing not only the working environment of the organization but also the corporate culture.
There are five types of technostress triggers[9], which mean stimuli, events, and demands that include technology[10]: overload, invasion, complexity, insecurity, and uncertainty. The Smart Work environment is most closely related to techno-invasion, because the time spent with family has been increased while the time to learn new skills has been reduced due to the violation of personal life. However, it is necessary to consider the situation of opposition in the work domain. It is a situation in which the task is intruding into nonwork domain, but a reverse techno-invasion situation in which personal work can disturb job satisfaction due to intrusion into the work domain. In this study, we want to define the reverse technology-invasion situation as a blurring boundary stress in work domain.
2.2 Boundary Management as Coping Strategies The main purpose of the coping strategies is to reduce the technostress that members are receiving and to minimize the negative consequences of stress[11,12]. In general, there are two types of response strategies: problem- focused and emotion-focused. Problem-focused coping refers to a coping that finds out what causes stress and takes action to eliminate or avoid sources of such stress. On the other hand, emotion-focused coping refers to a coping to reduce or eliminate emotional distress associated with a stress situation[13].
There is criticism that a wide range of categories, such as problem- and emotion-focused classifications, preclude important differences that exist within the category[14]. Skinner et al.[15] asserts the need for a specific coping strategy that is disaggregated to fit the situation
rather than a broad range of response categories, such as “problem-focused versus emotion-focused”
or “access versus avoidance”.
In this context, a boundary management strategy is required as an active coping strategy against reverse techno-invasion in a Smart Work environment where work and nonwork boundaries are ambiguous. Analysis of appropriate coping strategies utilized by individuals can be expected to effectively reduce the technostress of the organization members of the organization.
Boundary management strategy based on boundary theory in Smart Work environment can be seen as a major coping strategy for organization members to reduce blurring boundary stress in work domain.
Boundary management strategy means the strategy used to construct, maintain and adjust social boundaries between work and nonwork[16]. Boundary management strategy can be shown along a segmentation-integration continuum[1,16,17], which was intended to provide a means to understand how an individual negotiates with various domains[16]. When work and nonwork areas are fully integrated, there is no distinction between work and nonwork activities, and, furthermore, it is not clear when and where activities take place.
Permeability and flexibility form boundary strength, but permeability is a necessary condition[18] for boundary management and a key factor in shaping boundary strength. The reason is that the permeability reflects the degree to which an individual is physically located in one area, but psychologically and behaviorally involved in the activities of another[1].
Permeability can be asymmetric[19]. Perlow[20]
reported that workers had a strong work
boundary and a weak family boundary. More
studies on work interference with nonwork have
been accomplished than on nonwork
interference with work[21,22] and it shows
asymmetric permeability in a way. Oh et al.[23]
also investigated the asymmetric nature of permeability and empirically verified that individuals had strong work boundary and relatively weak nonwork boundary. Given the bi-directional permeability between work and nonwork domains, the four types of boundary management strategies can be derived. This includes the segmentation and integration types of boundary management strategy presented by existing research[1, 16].
Taking into account of ‘asymmetric permeability’, the framework includes two more types of boundary management strategy: ‘nonwork-oriented’
strategy that maintains the strength of nonwork boundary and ‘work-oriented’ strategy that maintains the strength of work boundary.
Nonwork-oriented and work-oriented boundary management strategies can be viewed as a boundary management strategy that individuals can take in ambiguous domains that are not specifically presented on the existing segmentation-integration continuum.
3. Research Model & Hypotheses 3.1 Research Model
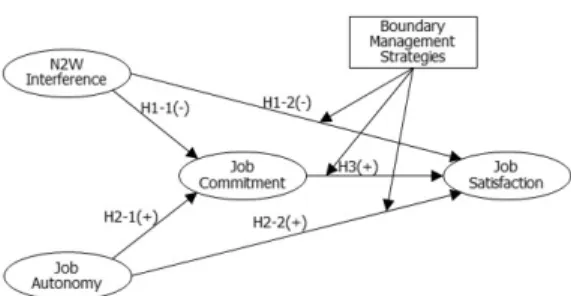
In this study, the research model proposed to verify the boundary management strategy for Smart Work users through literature review is shown in Fig. 1. Considering the purpose of Smart Work pursuing convenient and efficient work process anytime and anywhere, we wanted to identify the impact of nonwork-to-work interference, job commitment, and job autonomy on job satisfaction for Smart Work users. On the premise of ‘asymmetric permeability’ between work and nonwork domains, the model classifies the boundary management strategies used by Smart Work users into four types (integration- oriented, work-oriented, nonwork-oriented, segmentation-oriented), and also look at the
moderating effects of the boundary management strategy.
Fig. 1. Research Model
3.2 Hypotheses Building
Techno-invasion, one of five types of technostress factors refers to a situation where new technology invades personal life, spending less time with family, while learning new skills has increased[9,10]. This stress is related to the work-to-nonwork interference, which acts as a lowering factor for life satisfaction. On the other hand, nonwork-to-work interference can be viewed as a reverse techno-stress when considering a work/nonwork bidirectional interference, which is a factor that undermines job satisfaction.
If personal tasks are handled in the work area in a Smart Work environment where cross-domain boundaries are ambiguous, they can interfere with the performance of duties.
Interference from nonwork to work domain may reduce job commitment. In addition, interference from nonwork to work domain can negatively affect the job satisfaction of Smart Work users.
This leads to the following Hypotheses 1-1 and 1-2.
H 1-1. Nonwork-to-work interference will have negative impacts on job commitment.
H 1-2. Nonwork-to-work interference will
have negative impacts on job
satisfaction.
According to the job demand-resource theory, workers can use job resources to adjust job demands and promote individual growth and development[24-26]. Job resources are one of the most important factors because Smart Work allows users to be given the space and time management discretion to adjust task requirements and use it as an individual development opportunity. Job autonomy is a major factor in job resources.
Job autonomy is defined as “the degree to which the job provides substantial freedom, independence, and discretion to the employee in scheduling the work and in determining the procedures to be used in carrying it out”[27]. The reason why job autonomy is important for Smart Work users is because they have the discretion to perform their tasks independently.
Job autonomy is closely related to the discretion of time and space provided to users of Smart Work as well as the autonomy of task itself. For example, they think to have the authority to initiate, perform, and complete tasks through job autonomy[28,29]. Job autonomy also includes autonomy over time and space as well as the autonomy for the task itself[30]. The autonomy of time has been called flexible time or scheduling flexibility, and the autonomy of places has been referred to as telework or flexible places[31].
Job autonomy given to users of Smart Work can increase job commitment. Previous studies[32-34] found positive relationships between job autonomy and job commitment for telecommuting workers. Specifically, it has been demonstrated that job commitment increases when time and place[35] are given free discretion. Therefore, the following hypothesis is established :
H 2-1: Job autonomy will have positive influence on job commitment.
Several researchers[36,37] have found that job autonomy among task characteristics helps to give meaning to the job itself and that it has a positive effect on job satisfaction. When an individual has a high degree of autonomy, his or her satisfaction level increases[38]. Smart Work users will be expected to be more satisfied with their jobs because of increased autonomy in the use of ICT in their own discretion. Job autonomy is an important factor because ICT’s development increases the chance of leaving the main workplace, which can affect job satisfaction.
Therefore, the following assumptions were established :
H 2-2: Job autonomy will have positive effects on job satisfaction.
According to social identity theory, people want to act in ways consistent with their own identity[39], and tend to invest resources in roles they strongly identify[40]. People who are more likely to identify work roles tend to invest more time and effort in work-related activities[41].
When the degree of identity to a role is high, an individual forms a domain in a way that increases the likelihood of being committed in that role[42]. This job commitment tends to lead to job satisfaction. Boswell &
Olson-Buchanan[43] cite ‘job commitment’ as an
important factor in describing the use of ICT in
the work/nonwork domains. Job commitment is
being conceptualized with the importance or
centrality of one's work role in the concept of
individual self[44]. Fenner & Renn[45] found that
workers with a high degree of engagement
positively affect job satisfaction by extending
working hours and focusing on tasks. Smart work
users covered in this study are expected to
perform tasks at a relatively greater degree of
discretion than before, thereby increasing job
satisfaction. Therefore, the following hypothesis
is established :
H 3: Job commitment will have positive effects on job satisfaction.
Valcour & Hunter[46] suggest that the use of ICT may increase the permeability of work/nonwork domains and obscure boundaries The spatial, temporal, and psychological overlap of roles in both work and nonwork domains indicate concern that boundaries between work and nonwork domains are blurred. The consequences of blurred boundaries can reduce job satisfaction. In addition, it may lead to overwork[47] or cause severe stress[48].
According to the Boundary Theory[1], Smart Work users actively control the work/nonwork boundaries. If differences in task satisfaction occur between boundary management strategies, there may be differences in each type of boundary management in the degree to which both job autonomy and job commitment affects job satisfaction. Therefore, the following hypothesis can be established:
H 4: According to the boundary management strategy, the impact of nonwork-to-work interference, job autonomy, job commitment on job satisfaction will be different.
4. Methodology 4.1 Samples
The subject of this study is users with experience using Smart Work. Specifically, users who recognize that the boundaries between work and nonwork domains are ambiguous due to Smart Work and are building their own boundary management strategies. This study explores how nonwork-to-work interference, job commitment, and job autonomy affect job satisfaction and whether differences occur under each boundary management strategy.
Company T, one of the leading ICT companies
in Korea, has been operating Smart Work since 2010 was selected. Among the Smart Work users at Company T, the survey was conducted specifically targeting users who worked at home or at Smart Work Center.
For the purpose of empirical study, a survey was based on the previous literature and was developed that is appropriate for the subject and context. Prior to this survey, experts’ opinion was consulted and the final questionnaire was prepared to reflect the opinions of the persons in charge from Company T. Afterwards, the online survey site was used to survey the employees of Company T for two weeks.
Prior to the beginning of the survey, we asked respondents whether they had a Smart Work experience and collected data from people with a Smart Work experience. The final number of surveys collected was 351. However, other than the 30 that responded insincerely, such as selecting only one number or writing a survey with a certain pattern, 321 were used for statistical analysis.
Description
(n=321) Samples
(persons) Ratio (%)
Gender Male 255 79.4
Female 66 20.6
Age
25-30 49 15.3
31-40 126 39.2
41-50 128 39.9
> 51 18 5.6
Tenure
Less than 10 Years 164 51.1
11-20 Years 128 39.9
Over 21 Years 29 10.0
Table 1. Demographics
Demographics are shown in Table 1. Male
respondents were 255 (79.4%), and female were
66 (20.6%). Many respondents were in their 40s
(39.9%), and 126 respondents were in their 30s,
thus, it was shown that majority of respondents
were between 30s and 40s. For the tenure years
with the company, 51.1% of respondents were
Construct Item Loadings (t-value) M(SD) α C.R. AVE Interference N2W
I1 .853
(28.516) 2.424
(1.214) .817 .891 .731
I2 .819
(23.421)
I3 .892
(47.224)
Autonomy Job
A1 .920
(74.682) 5.190
(1.287) .927 .948 .820
A2 .922
(68.014)
A3 .894
(53.103)
A4 .885
(50.376)
Commitment Job
C1 .887
(63.847)
5.174
(1.356) .927 .945 .775
C2 .904
(86.682)
C3 .903
(73.145)
C4 .846
(50.077)
C5 0.860
(50.992) Satisfaction Job
S1 .937
(119.747) 5.364
(1.220) .889 .931 .819
S2 .840
(39.285)
S3 .934
(96.019) Suggested
Criteria >.7(>2.0) >.7 >.7 >.5 Note: M mean, SD standard deviation, α Cronbach’s alpha, C.R. composite reliability, AVE average variance extracted Table 2. Mean, Reliability, and Convergent Validity less than 10 years. Such distribution is similar to
the ratio that is indicative to that of the figures which were produced from employers of company T.
4.2 Measurement
Questionnaires were developed to measure six constructs used in the hypotheses test : work-to-nonwork[49,50] and nonwork-to-work permeability[49], nonwork-to-work interference[51,52], job commitment[44,52], job autonomy[34,53], job satisfaction[54,55]. All of the survey items were chosen from the previous research where reliability and validities were verified, and slightly modified pertinent to the research context. All the items were measured on a 7 point Likert scale.
4.3 Asymmetric Permeability Test
A paired t-test was used to check the asymmetry between work and nonwork boundary of those who use the Smart Work. Averages of work-to-nonwork permeability and nonwork-to-work permeability were 4.835 and 3.723 respectively, and average difference between two constructs is 1.112. The paired t-test revealed that the t-value for each paired sample was 11.479 (.000), indicating that the paired sample had statistically significant differences at the 99% confidence level.
These results may be interpreted as an asymmetric relationship for each paired sample.
In other words, Smart Work users may take a permeability from work to nonwork higher than the reverse. These results indicate that asymmetrical relationships between work and nonwork domains raised in previous studies[22,56] also occur in Smart Work situations.
The median value for work-to-nonwork permeability and nonwork-to-work permeability is equal to 4. Applying this criterion, the entire sample (n=321) was divided into four types:
integration-oriented (n=83), work-oriented (n=89), nonwork-oriented (n= 85), and segmentation-oriented (n=64).
4.4 Reliability and Validity
As shown on Table 2, descriptive statistics such as averages, standard deviations, and ranges of each construct are calculated. Averages and standard deviations of each construct are not distorted and distribution of responses is even.
To validate the internal consistencies of measurement items of each construct, Cronbach’s alpha was used and the reliability of each construct were tested. If Cronbach’s alpha is over .7, the reliability of the measurement instrument can be validated[57].
Through structural equation modeling(SEM),
composite reliability and average variance
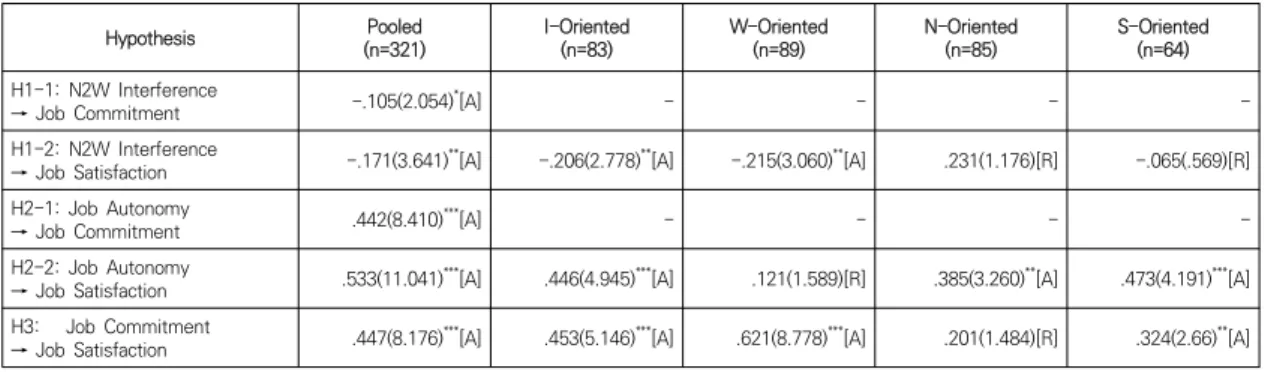
Hypothesis Pooled
(n=321) I-Oriented
(n=83) W-Oriented
(n=89) N-Oriented
(n=85) S-Oriented
(n=64) H1-1: N2W Interference
→ Job Commitment -.105(2.054)
*[A] - - - -
H1-2: N2W Interference
→ Job Satisfaction -.171(3.641)
**[A] -.206(2.778)
**[A] -.215(3.060)
**[A] .231(1.176)[R] -.065(.569)[R]
H2-1: Job Autonomy
→ Job Commitment .442(8.410)
***[A] - - - -
H2-2: Job Autonomy
→ Job Satisfaction .533(11.041)
***[A] .446(4.945)
***[A] .121(1.589)[R] .385(3.260)
**[A] .473(4.191)
***[A]
H3: Job Commitment
→ Job Satisfaction .447(8.176)
***[A] .453(5.146)
***[A] .621(8.778)
***[A] .201(1.484)[R] .324(2.66)
**[A]
Note: I-Oriented stands for in[A] means that the hypothesis is accepted, while [R] does that the hypothesis is rejected; the hypothesis is accepted at significance level of .05(
*), .01(
**), .001(
***)
Table 4. Results of Hypotheses Test Using Pooled and Each Type Data Set extracted(AVE) are calculated to confirm the
reliabilities of each construct once again. Every value is higher than recommended criterion (Composite reliability over .70, AVE over .5).
Confirmatory factor analysis is performed to verify the convergent validity. Generally if loaded value is over .707 or t-value is over 2.0[58], then convergent validity is verified. all of the loaded values are over .707.
Average variance extracted (AVE) is used to verify discriminant validity[59]. As shown on Table 3, diagonal elements of square root of AVE are over .5, and over correlation coefficients in the related rows and columns. Thus, discriminant validity is verified.
1 2 3 4
1. F2W Interference .855
a2. Job Autonomy -.244
b.905 3. Job Involvement -.212 .467 .880
4. Job Satisfaction -.301 .574 .630 .905
a
(diagonal) square rood of AVE
b