Analysis of Pathogenic Microorganism's Contamination on Cultivation Environment of Strawberry and Tomato in Korea
Soh-Young Oh, Ki-Woong Nam1, Won-Il Kim2, Mun Haeng Lee3, and Deok-Hoon Yoon*
Research Institute of International Agriculture, Technology and Information, Hankyong National University, Anseong 456-749, Korea
1Department of Horticulture, Hankyong National University, Anseong 456-749, Korea
2Microbial Safety Team, National Academy of Agricultural Science, RDA, Jeonju 565-851, Korea
3Buyeo Tomato Experiment Station, Chungnam Agricultural Research and Extension Services, Buyeo 323-814, Korea
(Received: November 12 2014, Revised: November 26 2014, Accepted: November 26 2014)
The purpose of this study was to analyze microbial hazards for cultivation environments and personal hygiene of strawberry and tomato farms at the growth and harvesting stage. Samples were collected from thirty strawberry farms and forty tomato farms located in Korea and tested for Staphylococcus aureus and Bacillus cereus. To investigate the change in the distribution of the S. aureus and B. cereus, a total of 4,284 samples including air born, soil or medium, mulching film, harvest basket, groves and irrigation water etc. were collected from eight strawberry farms and nine tomato farms for one year. As a result, total S. aureus and B. cereus in all samples were detected. Among the total bacteria of strawberry farms, S. aureus (glove: 0~2.1 Log CFU/100 cm2, harvest basket:
0~3.0 Log CFU/100 cm2, soil or culture media: 0~4.1 Log CFU/g, mulching film: 0~3.8 Log CFU/100 cm2), B.
cereus (glove: 0~2.8 Log CFU/100 cm2, harvest basket: 0~4.8 Log CFU/100 cm2, soil or culture media: 0~5.3 Log CFU/g, mulching film: 0~4.5 Log CFU/100 cm2) were detected in all samples. The total bacteria of tomato farms, S. aureus (glove: 0~4.0 Log CFU/100 cm2, harvest basket: 0~5.0 Log CFU/100 cm2, soil or culture media: 0~6.1 Log CFU/g, mulching film: 0~4.0 Log CFU/100 cm2), B. cereus (glove: 0~4.0 Log CFU/100 cm2, harvest basket:
0~4.3 Log CFU/100 cm2, soil or culture media: 0~5.9 Log CFU/g, mulching film: 0~4.7 Log CFU/100 cm2) were detected in all samples. The contamination of S. aureus and B. cereus were detected in soil, mulching film and harvest basket from planting until harvest to processing, with the highest count recorded from the soil. But S.
aureus and B. cereus were not detected in irrigation water samples. The incidence of S. aureus and B. cereus in hydroponics culture farm were less than those in soil culture. The amount of S. aureus and B. cereus detected in strawberry and tomato farms were less than the minimum amount required to produce a toxin that induces food poisoning. In this way, the degree of contamination of food poisoning bacteria was lower in the production environment of the Korea strawberry and tomato, but problems can be caused by post-harvest management method.
These results will be used as fundamental data to create a manual for sanitary agricultural environment management, and post-harvest management should be performed to reduce the contamination of hazardous microorganisms.
Key words: Tomato, Strawberry, B. cereus, S. aureus, Food safety
Microbial population of Bacillus cereus of strawberry farms (left) and tomato farms (right) of six or nine area at the growing stage. Unit : mean Log CFU/g, mL, 100 cm2 or plate.
1)
*Corresponding author : Phone: +82316784643, Fax: +82316784644, E-mail: [email protected]
§Acknowledgement: This study was carried out with the support of Cooperative Research Program for Agricultural Science & Technology Development (Project No. PJ009404), Rural Development Administration, Republic of Korea.
Introduction
최근 생활수준의 향상 및 건강에 대한 관심이 증가함에 따라 고품질의 신선식품에 대한 수요가 증가하고 있으며 (Bari et al., 2009; Samara and Koutsoumanis, 2009), 몇 몇 나라에서 발생한 과채류 또는 엽채류를 통한 식중독균의 감염사례는 신선채소의 안정성에 대한 관심을 증폭시키고 있다. 우리나라의 경우 딸기와 토마토 생산량의 약 90%가 생식용으로 이용되고 있으므로 (Cho et al., 2004; Leong et al., 2010; Park & Kim, 2011) 이들 과채류의 안전성확보는 매우 중요하다. 미국에서는 2008년 살모넬라균 식중독 사 건이 발생하여 대형유통업체, 식당 등에서 토마토 취급을 기피하기도 하였다 (CDC, 2008). 미국에서는 딸기에 E. coli O157:H7이 오염되어 10명의 사람에게 감염이 되고, 그 중 한 명이 사망하는 사고가 발생 하였으며 (FDA, 2011), 새 싹채소, 당근, 방울토마토, 호박 등의 과채류에서 Listeria monocytogenes와 Aeromonas spp.가 검출되었다 (Heaton
& Jones, 2008). 특히 농산물은 재배, 수확, 유통과정에서 많은 생물학적 유해 요소에 노출되어 있으며, 2005년 스페 인에서 수입한 양상추에서 검출된 S. typhimurium은 하수 를 관계수로 이용한 것이 원인으로 밝혀졌다 (Heaton &
Jones, 2008). 병원성 미생물은 과일과 채소를 씻는 과정에 서도 완벽히 제거되지 않으며, 다양한 종류의 병원성 미생 물이 식중독을 야기할 수 있다 (Beuchat, 1996). 국내에서 는 즉석섭취, 편의식품에 대해 대장균, 살모넬라, 장염비브 리오는 음성, 황색포도상구균은 1 g당 100 CFU/g 이하, 바 실러스 세레우스는 1 g당 1,000 CFU/g 이하, 세균수는 1 g 당 100,000 CFU/g 이하로 규정하고 있다 (KFDA Food Code, 2009). 일반적으로 신선채소류에 총균수는 104~106 CFU/g, 품질저하에 관계되는 미생물은 103 CFU/g, 그리고 101~103 CFU/g 수준의 부패균 Fluorescent pseudomonas 등이 존재 하는 것으로 보고한 바 있다 (Kim et al, 2004). 과채류에 쉽게 오염되는 미생물로 Listeria spp.와 Salmonella spp.는 토양 미생물로서 식물, 토양, 지표수 등 자연계에 널리 분포 하기 때문에 재배와 수확과정에 쉽게 오염되는 것으로 알려 져 있으며 (Kampelmacher, 1990), 실제로 셀러드 (Beuchat, 1996)와 토마토(Asplund & Nurmi, 1996; Beuchat & Brackett, 1991)에서 Listeria monocytogenes, L. monocytogenes, Salmonella typhimurium 등이 검출된 바 있으며, 오렌지, 사과, 파인애 플 및 백포도에서 Salmonella, E. coli O157:H7, L. monocytogenes 가 -23°C에서 12주 동안 생존하였다고 보고하였다 (Oyarzabal et al., 2003). 미국에서 2005~2007년 사이 신선 농식품과 관련된 식중독 사고의 원인 식품으로는 콩, 양배추, 사과, 바나나, 숙주, 콩나물, 시금치, 당근, 딸기, 수박, 메론, 양 파 등 이었으며, 그 외에도 여러 채소나 과일을 혼합시킨 샐 러드 종류가 원인 식품으로 확인되었다 (CDC, 2008). 황색
포도상구균 (Staphylococcus aureus)은 자연 환경에 대한 저항성이 강하기 때문에 자연계에 광범위하게 분포하고 있 으며 사람이나 동물의 화농성 병소에 존재할 뿐만 아니라 건강한 사람과 동물의 피부 등에도 상재하고 있어 식품과 인체에 오염될 가능성이 매우 높다 (Cho et al., 2011). Bacillus cereus는 토양, 물 등 자연계 도처에 퍼져있는 그람 양성 간 균으로 독소형 식중독균 중 하나이다. 최근 들어 분유, 된 장, 떡 등에 오염이 확인되면서 규제가 강화되고 있다. B. cereus 는 쌀, 향신료, 육류, 난가공품, 유가공품 등 다양한 가공식 품과 익히지 않고 섭취하는 식품에 널리 분포하고 있다. 처 음으로 B. cereus에 의한 식중독이 보고된 것은 1950년경 노르웨이였으며, 원인 식품은 하루 전에 미리 만들어져 상 온 보관된 바닐라 소스였다 (Koo, 2009).
대표적인 과채류인 딸기와 토마토는 신선한 상태로 섭취 하기 때문에 병원성 미생물이 오염되었을 경우 식중독을 야 기 할 수 있다. 본 연구는 국내 딸기와 토마토 주산지의 생산환 경에서 독소형 식중독 균인 Bacillus cereus와 Staphylococcus aureus의 분포양상 및 오염도를 조사하여 딸기의 재배, 수 확 과정에서 미생물적 안전성을 평가하고 주요 관리방법을 모색하고 해결방안을 제시하고자 한다.
Materials and Methods
시료채집 2013년 2월부터 6월까지 국내 딸기와 토마토 의 재배, 생산단계 환경의 유해미생물 오염도 조사를 유해 경북 소재 1지역 (4개 농가), 경남 소재 2지역 (10개 농가), 전북 소재 1지역 (4개 농가), 전남 소재 1지역 (4개 농가) 충 남 소재 1지역 (8개 농가)으로 총 5개 지역 (30 농가)의 딸기 주산단지와 강원, 경기를 비롯한 6개도 9개 시·군의 토마토 주산단지 (40 농가)에서 시료를 채집하였으며, 모두 비닐하 우스시설재배 농가였다. 재배 방법에 따라 토양 또는 배지 50 g, 관개용수 50 mL을 각각 멸균된 채집통과 채수통에 채취한 후 즉시 냉장박스에 보관하여 실험실로 이송하였다.
피복재 표면, 수확장갑, 수확바구니, 작업대 등의 표면미생 물은 3M E-swab kit (3M, St Paul, USA)를 이용하여 10ⅹ 10 cm 면적의 표면미생물을 채집하였다. 또한 온실내 공중 낙하균을 조사하기 위하여 일반세균과 유해균 검출을 위한 선택배지를 5분간 노출시켰다가 다시 회수하였다. 모든 시 료는 냉장보관하여 실험실로 이송 후 12시간 이내에 분석에 사용하였다. 각 농가별로 시료당 3반복으로 분석하였다.
시기별 시료 채집 딸기와 토마토 생산환경에서 유해
미생물의 발생현황을 모니터링 하기 위하여 2013년 2월부 터 2014년 3월까지 충남 소재의 딸기와 토마토 각각 8, 9 곳 의 동일한 농가에서 매월 1회씩 시료를 채집하였다. 한 농 가 당 토양 또는 배지, 피복재 표면, 수확바구니, 수확장갑,
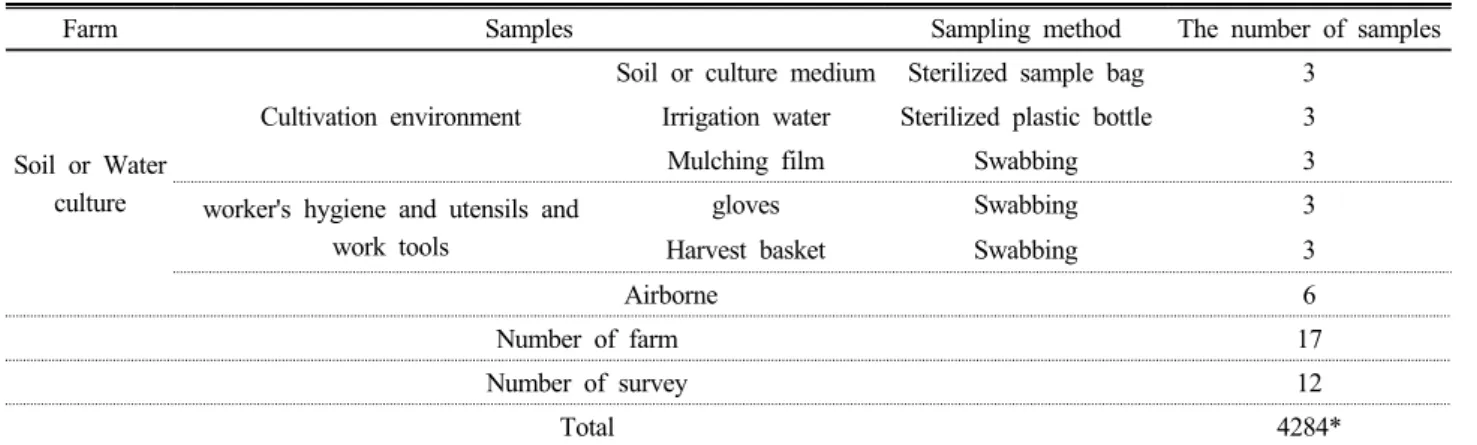
Table 1. Samples collected from strawberry and tomato farms for 1 year for the microbial assessment.
Farm Samples Sampling method The number of samples
Soil or Water culture
Cultivation environment
Soil or culture medium Sterilized sample bag 3 Irrigation water Sterilized plastic bottle 3
Mulching film Swabbing 3
worker's hygiene and utensils and work tools
gloves Swabbing 3
Harvest basket Swabbing 3
Airborne 6
Number of farm 17
Number of survey 12
Total 4284*
*Total: Number of sample per farm(24)ⅹnumber of farm(17)ⅹnumber of survey(12)
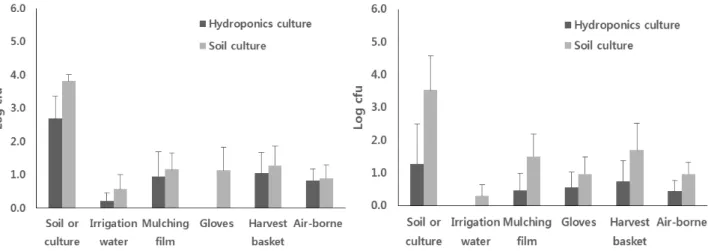
Fig. 1. Microbial population of Bacillus cereus of strawberry farms (left) and tomato farms (right) of six or nine area at the growing stage. Unit : mean Log CFU/g, mL, 100 cm2 or plate.
공중낙하균, 작업대 등 6가지 샘플을 3반복으로 시료를 수 집하여 총 4,284점의 시료를 분석하였다 (Table 1). 모든 시 료는 냉장보관하여 실험실로 이송 후 12시간 이내에 분석하 였다.
유해미생물 오염도 조사 채집한 시료의 Bacillus cereus 와 Staphylococcus aureus의 오염도를 정량적으로 분석하 였다 (Kim et al., 2013). B. cereus 오염도 조사를 유해 균질 화한 희석용액 100 μL를 3개의 Mannitol Egg Yolk Polymyxin Agar에 각각 분주하여 도말하였다. 37°C 배양기에서 24시 간 동안 배양한 후 분홍색에 lethicinase 작용으로 집락주위 에 밝은 환 (clear zone)이 나타나는 단일 집락수를 계수하 였다. S. aureus 오염도 조사를 유해 균질화한 희석용액을 100 μL씩 3개의 Baird-Parker (BP, OXOID, UK)에 각각 분 주하여 도말한 후 37°C의 배양기에서 48시간 동안 배양 후 검고 lethicinase 작용으로 집락주위에 밝은 환 (clear zone) 이 나타나는 단일 집락을 계수하였다. 최종 동정은 계수한 평판에서 전형적인 집락을 선발하여 NA배지에 접종하고 37°C 에서 24시간 배양한 후 VITEK® 2 (BIOMERIEUX, France) 을 사용하였고 대조군으로 S. aureus 표준 균주 ATCC 25923 을 사용하였다.
Results and Discussion
딸기와 토마토 재배, 생산환경에서 B. cereus의 분포를 조사한 결과 모든 조사 지점에서 검출되었다 (Fig. 1). 딸기 의 경우 수경재배의 배지, 관개수, 피복재, 수확장갑, 수확 바구니, 공중낙하균조사에서 각각 3.02±1.18 Log CFU/g, 0.37±0.45 Log CFU/mL, 0.83±0.66 Log CFU/100 cm2, 0.90±
0.78 Log CFU/100 cm2, 1.58±0.94 Log CFU/100 cm2, 0.50±0. Log CFU/plate/5 min의 B. cereus가 검출되었고, 토경재배의 경우 토양, 관개수, 피복재, 수확장갑, 수확바구 니, 공중낙하균조사에서 각각 4.85±0.11 Log CFU/g, 0.28
±0.34 Log CFU/mL, 1.63±0.91 Log CFU/100 cm2, 2.20±0.98 Log CFU/100 cm2, 1.95±0.97 Log CFU/100 cm2, 0.50±0.27 Log CFU/plate/5 min의 B. cereus가 검출되었다. 토마토의 경우 수경재배의 배지, 관개수, 피복재, 수확장갑, 수확바구 니, 공중낙하균조사에서 각각 4.69±0.32 Log CFU/g, 0.14±0.
Log CFU/mL, 2.80±0.99 Log CFU/100 cm2, 2.27±0.99 Log CFU/100 cm2, 2.40±0.27 Log CFU/100 cm2, 0.46±0.10 Log CFU/plate/5 min의 B. cereus가 검출되었고, 토경재배의 경우 토양, 관개수, 피복재, 수확장갑, 수확바구니, 공중낙 하균조사에서 각각 4.21±0.83 Log CFU/g, 0.21±0.22 Log
Fig. 2. Microbial population of Staphylococcus aureus of strawberry farms (left) and tomato farms (right) of six or nine area at the growing stage. Unit : mean Log CFU/g, mL, 100 cm2 or plate.
CFU/mL, 2.95±0.84 Log CFU/100 cm2, 2.30±0.93 Log CFU/100 cm2, 2.78±0.98 Log CFU/100 cm2, 0.50±0.26 Log CFU/plate/5 min 의 B. cereus가 검출되었으며, 재배 방법에 따른 B. cereus의 발생량 차이는 없는 것으로 나타 났다.
딸기와 토마토 재배, 생산환경에서 S. aureus의 분포를 조 사한 결과 모든 조사 지점에서 검출되었다 (Fig. 2). 딸기의 경우 수경재배의 배지, 관개수, 피복재, 수확장갑, 수확바구니, 공중낙하균조사에서 각각 2.7±0.68 Log CFU/g, 0.20±0.24 Log CFU/mL, 1.0±0.75 Log CFU/100 cm2, 0.00±0.00 Log CFU/100 cm2, 1.05±0.62 Log CFU/100 cm2, 0.84±0.32 Log CFU/plate/5 min의 S. aureus가 검출되었고, 토경재배 의 경우 토양, 관개수, 피복재, 수확장갑, 수확바구니, 공중 낙하균조사에서 각각 3.82±0.20 Log CFU/g, 0.57±0.44 Log CFU/mL, 1.17±0.50 Log CFU/100 cm2, 1.13±0.70 Log CFU/100 cm2, 1.28±0.59 Log CFU/100 cm2, 0.90±0.39 Log CFU/plate/5 min 의 S. aureus가 검출되었다. 토마토의 경 우 수경재배의 배지, 관개수, 피복재, 수확장갑, 수확바구니, 공중낙하균조사에서 각각 1.28±1.23 Log CFU/g, 0.00±0.00 Log CFU/mL, 0.46±0.52 Log CFU/100 cm2, 0.55±0.48 Log CFU/100 cm2, 0.73±0.64 Log CFU/100 cm2, 0.44±0.32 Log CFU/plate/5 min의 S. aureus가 검출되었고, 토경재배 의 경우 토양, 관개수, 피복재, 수확장갑, 수확바구니, 공중 낙하균조사에서 각각 3.53±1.04 Log CFU/g, 0.29±0.35 Log CFU/mL, 1.50±0.68 Log CFU/100 cm2, 0.96±0.53 Log CFU/100 cm2, 1.69±0.82 Log CFU/100 cm2, 0.97±0.36 Log CFU/plate/5 min의 S. aureus가 검출되어, 토경재배보 다 수경재배시 1/2 이상 S. aureus가 적게 검출되었다. 토 양 또는 수경재배 배지에서 가장 높은 수준으로 검출되었으 며 피복재, 수확바구니, 수확 장갑 순이었다. 관개수에서도 검출되었으나 매우 낮은 수준이었으며 지역에 따른 편차가 매우 컸다. 모든 조사 지점에서 독소를 생성하기 위한 최저
수준인 6 Log CFU/g 이하로 검출되었으나 과실에 오염될 경우 저밀도의 미생물이라도 유통, 소비과정에서 증식 할 가능성이 있기 때문에 생산과정에서 이들의 밀도를 낮추기 위한 관리 방안이 필요할 것으로 여겨진다. Beuchat et al.
(1996)은 S. aureus는 하나 이상의 독소를 형성해서 식중독 을 일으키는 독소형 식중독으로서, 상대적으로 많은 균주들 이 항생제에 내성을 가지는 경우가 많으며, 신선채소의 17.7~
24.0%에서 검출되었으며, 이 균이 식품 취급자의 손에서 유 래되었다고 발표하였다. 또한 Jung et al. (2005)은 한국에 서 생산된 상추 중 37%에서 S. aureus가 검출되었다고 보고 하였다.
딸기재배농가의 토양내 B. cereus밀도는 토경의 경우 연 평균 5.03±0.21 Log CFU/g으로 시기 또는 작물의 유무와 관계없이 일정 밀도가 유지되었다. 이 결과는 B. cereus나 Clostridium spp.가 토양에서 빈번하게 검출된다는 Brackett
& Splittsoesser (2001)의 보고와 일치하며, 또한 이들은 농 산물에서 B. cereus의 오염 수준과 빈도가 높은 이유는 농 산물은 토양과 접촉이 가능하기 때문이라고 하였다. 수경재 배의 경우 작물의 생육, 수확기에는 평균 4.62±0.20 Log CFU/g이었으나 작물이 없는 휴지기에는 검출되지 않았다 (Table 2). 휴지기의 이러한 차이는 수경의 경우 양액의 공 급이 없어 배지내 수분 및 양분이 없고, 7~8월의 고온이 지 속되는 기간이기 때문으로 판단된다.
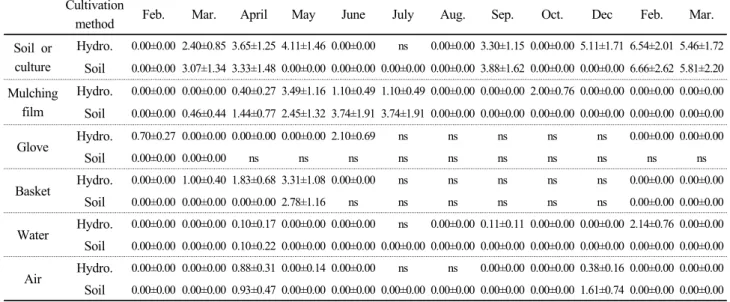
S. aureus의 경우 재배방법과 관계없이 온도가 증가하 고, 작물의 휴지기에 접어드는 5월부터 8월까지 토양 또는 배지내 밀도가 급격히 감소하였다 (Tabel 3). 일반적으로 S.
aureus의 증식과 독소 생산에 염, pH, 온도, 수분, 경쟁적 미생물 등의 환경인자들이 영향을 끼친다고 보고되어 있으 며 (Noleto & Bergdoll, 1980; Troller, 1986; Utermann &
Muller, 1992), 일반적으로 경쟁력이 약하기 때문에 경쟁미 생물이 존재하지 않는 상태에서 증식이 잘되는 것으로 알려 져 있으므로 딸기의 생육기간 중 S. aureus의 밀도변화는
Table 2. Microbial population of B. cereus in samples collected from strawberry farms for one year. Unit : mean ± standard deviation; Log CFU/g, mL, 100 cm2, fruit or plate. NS: No sampling; Do not used season.
Cultivation
method Feb. Mar. April May June July Aug. Sep. Oct. Dec Feb. Mar.
Soil or culture
Hydro. 4.60±0.00 4.93±1.58 4.33±1.41 5.30±1.70 4.10±1.34 ns 0.00±0.00 4.78±1.58 4.78±1.58 5.74±1.90 3.57±1.28 4.10±1.37 Soil 4.40±1.80 5.03±1.94 4.81±1.99 5.43±2.04 3.88±1.69 5.40±1.98 4.60±1.69 6.09±2.58 5.18±2.09 6.17±2.55 5.34±2.23 4.07±1.66 Mulching
film
Hydro. 0.00±0.00 0.00±0.00 0.00±0.00 4.33±1.40 4.22±1.42 4.22±1.42 0.00±0.00 0.00±0.00 3.85±1.27 0.00±0.00 0.00±0.00 3.40±1.22 Soil 2.22±1.02 0.00±0.00 3.27±1.40 0.00±0.00 3.54±1.48 3.54±1.48 0.00±0.00 0.00±0.00 2.18±0.93 0.00±0.00 0.00±0.00 0.00±0.00 Glove Hydro. 0.00±0.00 0.00±0.00 2.74±0.90 0.00±0.00 2.70±0.87 ns ns ns ns ns 2.30±0.78 0.00±0.00
Soil 2.00±0.98 0.00±0.00 ns ns ns ns ns ns ns ns ns ns
Basket Hydro. 0.00±0.00 0.00±0.00 2.54±0.90 4.69±1.58 0.00±0.00 ns ns ns ns ns 0.00±0.00 3.10±1.12
Soil 0.00±0.00 1.40±0.76 3.06±1.07 3.00±1.27 ns ns ns ns ns ns 0.00±0.00 0.00±0.00
Water Hydro. 0.00±0.00 0.00±0.00 0.00±0.00 0.00±0.00 0.00±0.00 ns 0.00±0.00 0.00±0.00 0.00±0.00 0.00±0.00 0.00±0.00 0.40±0.20 Soil 0.00±0.00 0.00±0.00 0.00±0.00 0.00±0.00 0.00±0.00 0.00±0.00 0.00±0.00 0.00±0.00 0.00±0.00 0.00±0.00 0.00±0.00 0.37±0.20 Air Hydro. 0.00±0.00 0.00±0.00 0.05±0.08 0.69±0.38 0.00±0.00 ns ns 0.00±0.00 0.32±0.10 0.10±0.09 0.00±0.00 1.44±0.53 Soil 0.00±0.00 0.00±0.00 1.28±0.60 0.00±0.00 0.24±0.14 0.30±0.00 0.30±0.00 1.10±0.13 0.90±0.29 0.00±0.00 1.07±0.52 0.00±0.00
Table 3. Microbial population of S. aureus in samples collected from strawberry farm for one year. Unit : mean ± standard deviation; Log CFU/g, mL, 100 cm2, fruit or plate. NS: No sampling; Do not used season.
Cultivation
method Feb. Mar. April May June July Aug. Sep. Oct. Dec Feb. Mar.
Soil or culture
Hydro. 0.00±0.00 2.40±0.85 3.65±1.25 4.11±1.46 0.00±0.00 ns 0.00±0.00 3.30±1.15 0.00±0.00 5.11±1.71 6.54±2.01 5.46±1.72 Soil 0.00±0.00 3.07±1.34 3.33±1.48 0.00±0.00 0.00±0.00 0.00±0.00 0.00±0.00 3.88±1.62 0.00±0.00 0.00±0.00 6.66±2.62 5.81±2.20 Mulching
film
Hydro. 0.00±0.00 0.00±0.00 0.40±0.27 3.49±1.16 1.10±0.49 1.10±0.49 0.00±0.00 0.00±0.00 2.00±0.76 0.00±0.00 0.00±0.00 0.00±0.00 Soil 0.00±0.00 0.46±0.44 1.44±0.77 2.45±1.32 3.74±1.91 3.74±1.91 0.00±0.00 0.00±0.00 0.00±0.00 0.00±0.00 0.00±0.00 0.00±0.00 Glove Hydro. 0.70±0.27 0.00±0.00 0.00±0.00 0.00±0.00 2.10±0.69 ns ns ns ns ns 0.00±0.00 0.00±0.00
Soil 0.00±0.00 0.00±0.00 ns ns ns ns ns ns ns ns ns ns
Basket Hydro. 0.00±0.00 1.00±0.40 1.83±0.68 3.31±1.08 0.00±0.00 ns ns ns ns ns 0.00±0.00 0.00±0.00
Soil 0.00±0.00 0.00±0.00 0.00±0.00 2.78±1.16 ns ns ns ns ns ns 0.00±0.00 0.00±0.00
Water Hydro. 0.00±0.00 0.00±0.00 0.10±0.17 0.00±0.00 0.00±0.00 ns 0.00±0.00 0.11±0.11 0.00±0.00 0.00±0.00 2.14±0.76 0.00±0.00 Soil 0.00±0.00 0.00±0.00 0.10±0.22 0.00±0.00 0.00±0.00 0.00±0.00 0.00±0.00 0.00±0.00 0.00±0.00 0.00±0.00 0.00±0.00 0.00±0.00 Air Hydro. 0.00±0.00 0.00±0.00 0.88±0.31 0.00±0.14 0.00±0.00 ns ns 0.00±0.00 0.00±0.00 0.38±0.16 0.00±0.00 0.00±0.00 Soil 0.00±0.00 0.00±0.00 0.93±0.47 0.00±0.00 0.00±0.00 0.00±0.00 0.00±0.00 0.00±0.00 0.00±0.00 1.61±0.74 0.00±0.00 0.00±0.00
이러한 내·외적 요인들의 영향으로 사료된다.
재배방법과 관계없이 장갑, 수확바구니, 공기중 B. cereus 와 S. aureus 밀도는 생육 또는 수확기에만 검출되어 전반 적으로 매우 낮은 수준을 유지하였으며 농업용수에서는 거 의 검출되지 않았다 (Table 2, Table 3). 조사 지점에서 유 해균의 분포는 재배방법에 따른 차이보다는 각 농가별 관리 수준과 밀접한 관계가 있었다.
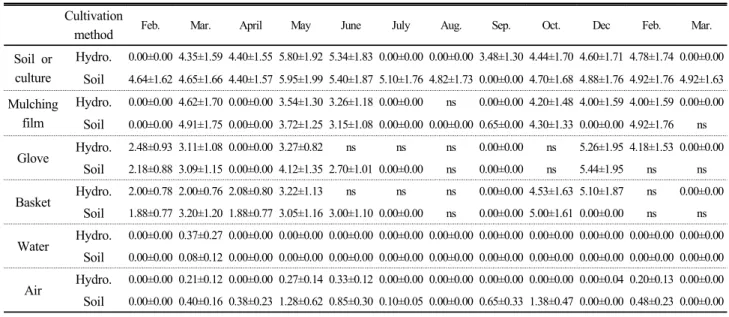
토마토 수경재배 농가의 재배기간중 6~8월은 동계 재배 후 휴지기 또는 하계 재배 정식 시기로 과실의 수확은 하지 않는 시기였으며, 7~8월에는 농가에 따라 소독제가 포함된 물로 배지를 세척하였다. 토경재배 농가는 8~9월에 휴지기 또는 하계 수확 후 소독 및 동계 정식기로 수확물이 없었다.
수경재배농가의 경우 배지의 소독 및 하계 정식기인 6월 하
순부터 9월 중순까지 유해균의 밀도가 급격히 감소하였다 가 정식 후 증가 하였다. B. cereus의 밀도는 휴지기인 8월 중순~9월 중순을 제외하고는 수경배지 평균 3.38±0.65 Log CFU/g, 토경평균 4.53±0.43 Log CFU/g으로 유지 되 었으나, S. aureus의 밀도는 소독이 이루어지는 휴지기 뿐 만 아니라 토양 또는 배지의 온도가 25°C이하로 떨어지는 10월부터 밀도가 급격히 감소하여 15°C이하로 유지되는 12 월까지 검출되지 않았다 (Table 4, Table 5).
토마토 ․ 딸기 생산환경의 토양, 피복재, 대기온도와 유해 미생물의 발생량의 상관관계를 분석하였다 (Fig. 3, Fig. 4).
분석 시 토양 또는 배지에 소독제를 처리한 농가는 제외하 였다. B. cereus와 S. aureus 모두 온도가 높아질수록 발생 량이 적어져 음의 상관관계가 있었다. 특히 생산환경 중 가
Table 4. Microbial population of B. cereus in samples collected from tomato farms for one year. Unit : mean ± standard deviation;
Log CFU/g, mL, 100 cm2, fruit or plate. NS: No sampling; Do not used season.
Cultivation
method Feb. Mar. April May June July Aug. Sep. Oct. Dec Feb. Mar.
Soil or culture
Hydro. 0.00±0.00 4.35±1.59 4.40±1.55 5.80±1.92 5.34±1.83 0.00±0.00 0.00±0.00 3.48±1.30 4.44±1.70 4.60±1.71 4.78±1.74 0.00±0.00 Soil 4.64±1.62 4.65±1.66 4.40±1.57 5.95±1.99 5.40±1.87 5.10±1.76 4.82±1.73 0.00±0.00 4.70±1.68 4.88±1.76 4.92±1.76 4.92±1.63 Mulching
film
Hydro. 0.00±0.00 4.62±1.70 0.00±0.00 3.54±1.30 3.26±1.18 0.00±0.00 ns 0.00±0.00 4.20±1.48 4.00±1.59 4.00±1.59 0.00±0.00 Soil 0.00±0.00 4.91±1.75 0.00±0.00 3.72±1.25 3.15±1.08 0.00±0.00 0.00±0.00 0.65±0.00 4.30±1.33 0.00±0.00 4.92±1.76 ns Glove Hydro. 2.48±0.93 3.11±1.08 0.00±0.00 3.27±0.82 ns ns ns 0.00±0.00 ns 5.26±1.95 4.18±1.53 0.00±0.00
Soil 2.18±0.88 3.09±1.15 0.00±0.00 4.12±1.35 2.70±1.01 0.00±0.00 ns 0.00±0.00 ns 5.44±1.95 ns ns Basket Hydro. 2.00±0.78 2.00±0.76 2.08±0.80 3.22±1.13 ns ns ns 0.00±0.00 4.53±1.63 5.10±1.87 ns 0.00±0.00
Soil 1.88±0.77 3.20±1.20 1.88±0.77 3.05±1.16 3.00±1.10 0.00±0.00 ns 0.00±0.00 5.00±1.61 0.00±0.00 ns ns Water Hydro. 0.00±0.00 0.37±0.27 0.00±0.00 0.00±0.00 0.00±0.00 0.00±0.00 0.00±0.00 0.00±0.00 0.00±0.00 0.00±0.00 0.00±0.00 0.00±0.00
Soil 0.00±0.00 0.08±0.12 0.00±0.00 0.00±0.00 0.00±0.00 0.00±0.00 0.00±0.00 0.00±0.00 0.00±0.00 0.00±0.00 0.00±0.00 0.00±0.00 Air Hydro. 0.00±0.00 0.21±0.12 0.00±0.00 0.27±0.14 0.33±0.12 0.00±0.00 0.00±0.00 0.00±0.00 0.00±0.00 0.00±0.04 0.20±0.13 0.00±0.00 Soil 0.00±0.00 0.40±0.16 0.38±0.23 1.28±0.62 0.85±0.30 0.10±0.05 0.00±0.00 0.65±0.33 1.38±0.47 0.00±0.00 0.48±0.23 0.00±0.00
Table 5. Microbial population of S.aureus in samples collected from tomato farms according to one year. Unit : mean ± standard deviation; Log CFU/g, mL, 100 cm2, fruit or plate. NS: No sampling; Do not used season.
Cultivation
method Feb. Mar. April May June July Aug. Sep. Oct. Dec Feb. Mar.
Soil or culture
Hydro. 0.00±0.00 3.83±1.37 5.18±1.86 6.16±2.28 3.52±1.38 4.00±0.00 0.00±0.00 4.47±1.69 0.00±0.00 0.00±0.00 6.72±2.19 6.13±2.24 Soil 0.00±0.00 4.01±1.41 5.24±1.94 6.70±2.36 2.92±1.22 5.47±1.95 4.07±1.41 3.60±1.03 0.00±0.00 0.00±0.00 6.74±2.19 6.48±2.26 Mulching
film
Hydro. 1.43±0.54 0.00±0.00 0.00±0.00 4.48±1.71 3.01±1.12 0.00±0.00 ns 0.00±0.00 0.00±0.00 0.00±0.00 0.00±0.00 0.00±0.00 Soil 1.00±0.46 3.72±1.35 1.76±0.77 4.45±1.46 0.00±0.00 0.00±0.00 0.00±0.00 0.00±0.00 4.20±1.51 0.00±0.00 0.00±0.00 ns Glove Hydro. 1.30±0.51 1.65±0.69 0.00±0.00 0.00±0.00 ns ns ns 0.00±0.00 ns 4.93±1.77 0.00±0.00 0.00±0.00
Soil 1.90±0.65 1.90±0.70 0.00±0.00 4.30±1.54 1.70±0.65 2.74±0.99 ns 0.00±0.00 ns 4.48±1.58 ns ns Basket Hydro. 1.82±0.55 2.20±0.51 1.45±0.58 4.37±1.53 ns ns ns 0.00±0.00 0.00±0.00 0.00±0.00 ns 0.00±0.00
Soil 1.86±0.59 2.26±0.64 0.00±0.00 4.46±1.54 1.22±0.57 2.00±0.81 ns 0.00±0.00 0.00±0.00 0.00±0.00 ns ns Water Hydro. 0.00±0.00 0.00±0.00 0.00±0.00 0.00±0.00 0.00±0.00 0.00±0.00 0.00±0.00 0.80±0.34 0.00±0.00 0.00±0.00 0.00±0.00 0.00±0.00
Soil 0.00±0.00 0.00±0.00 0.00±0.00 0.00±0.00 0.00±0.00 0.00±0.00 0.00±0.00 0.18±0.20 0.00±0.00 0.00±0.00 0.00±0.00 0.00±0.00 Air Hydro. 0.00±0.00 0.00±0.14 0.00±0.00 0.00±0.00 0.94±0.41 0.00±0.00 0.00±0.05 0.15±0.19 0.00±0.00 0.68±0.36 0.00±0.00 0.00±0.00 Soil 0.00±0.00 0.49±0.17 0.00±0.00 0.11±0.09 0.65±0.28 0.00±0.00 0.00±0.00 0.00±0.00 0.00±0.00 0.00±0.06 0.00±0.00 0.00±0.00
Fig. 3. Correlations between B. cereus (left) and S. aureus (right) occurrence in the strawberry farm at the growing stage and temperature(soil or culture, fruit, mulching film) surveyed. The coefficient between the temperature and B. cereus occurrence was calculated as 0.10. The correlation coefficient between the temperature and the incidence of S. aureus was determined as 0.24.
Fig. 4. Correlations between B. cereus (left) and S. aureus (right) occurrence in the tomato farm at the growing stage and temperature(soil or culture, fruit, mulching film) surveyed. The coefficient between the temperature and B. cereus occurrence was calculated as 0.12. The correlation coefficient between the temperature and the incidence of S. aureus was determined as 0.29.
장 오염율이 높은 지점이 토양 또는 배지였던 바 토양 또는 배지의 열소독으로 이들 유해균을 감소 또는 멸균 시킬 수 있을 것으로 예상되었다.
농산물의 생물학적 유해요소 오염원인으로는 가축, 야생 동물의 분변, 자연재해, 하수, 농장의 위생관리 부족, 취급 자에 의한 오염 등이 있으며, 미국의 경우 농산물의 재배, 수확, 유통에 이르기까지 미생물의 오염을 줄이기 위한 GAP 및 GMP 규정을 따르도록 하고 있으나 (US FDA), 우리나라 의 경우 구체적인 기준이 설정되지 않고 있다. Norman &
Wang (1961)은 오염된 관개용수의 사용은 수확된 농산물에 서 병원성 미생물의 검출률을 증가시킨다고 보고하였는데, 이는 농작물생산환경에서 작물로 유해미생물의 이행가능성 이 있다는 것을 의미한다. 본 연구에서 모든 조사 지점에서 유해균이 검출되었으므로 유통, 섭취 환경에 따라 병원성 미생물에 의한 안전에 영향을 미칠 수 있는 가능성이 존재 함이 확인 되었다. 토마토와 딸기와 같은 신선농산물은 일 반적으로 오염된 병원체를 사멸시키거나 감소시키는 가공 과정을 거치지 않기 때문에 B. cereus와 S. aureus같은 유 해미생물의 오염은 농산물의 유통 및 소비단계의 안전성에 영향을 미칠 수 있다. 따라서 농산물의 생산 및 유통과정에 서 유해미생물의 오염율을 낮출 수 있는 관리 방안의 모색 은 식중독사고의 위험을 감소시킬 수 있는 최선의 방법이 될 것이다. 본 연구 결과는 농산물 생산단계에서 유해미생 물 검출의 저감화를 위한 관리방안을 제시하기 위한 유해요 소 분석에 필요한 기초자료가 될 것이다. 그 결과 토양, 피 복재 등에서 비교적 높은 수준으로 존재하고 있는 것을 확 인 할 수 있었다.
Conclusions
본 연구는 생산단계의 토마토, 딸기 농업환경에서 유해 미생물의 오염도를 분석하였다. 생산단계의 조사지점별 유
해균 분포를 조사하기 위하여 생산량 상위 10%이내의 주산 단지의 딸기농가 30농가, 토마토 40농가를 선정하여 전국 조사를 실시하였다. 시기별 생산단계의 지점별 유해균 분포 를 조사하기 위하여 토마토와 딸기 주산지의 17농가를 대상 으로 1년 동안 총 4,284점의 시료를 수집하여 유해미생물의 오염도 변화를 조사하였다. 딸기 재배기간 중 B. cereus와 S. aureus의 발생량을 조사한 결과 휴지기에 감소하였다가 재배시기에 다시 증가하는 경향을 나타내었다. 토마토 재배 기간 중 B. cereus와 S. aureus의 발생량을 조사한 결과 B.
cereus는 토양 및 대기온도가 높은 7~8월에 감소하였다가 이후 다시 증가하는 경향을 나타내었다. S. aureus의 경우 고온기 뿐만 아니라 휴지기인 10~12월에 감소하였다가 정 식 이후 다시 증가하였다. B. cereus와 S. aureus 발생량과 온도와의 상관관계를 분석한 결과 딸기, 토마토 재배환경에 서 토양 및 피복재 표면 온도와 이들 균의 발생량은 음의 상 관관계가 있었으므로 토양 내 유해균은 휴지기에 열소독으 로 사멸 가능할 것으로 예상되었다.
References
Bari, M.L., D. Nei, K. Enomoto, S. Todoriki, and S. Kawamoto.
2009. Combination treatments for killing Escherichia coli 0157:H7 on alfalfa, radish, brocooli, and mung bean seeds. J.
Food Prot. 72:631-636.
Samara, A., and K.P. Koutsoumanis. 2009. Effect of treating lettuce surfaces with acidulants on the behavior of Listeria monocytogenes during storage at 5 and 20°C and subsequent exposure to simulated gastric fluid. Int. J. Food Microbiol.
129:1-7.
Cho, J.I., S.D. Ha, and K.S. Kim. 2004. Inhibitory effects of temperature, pH, and potassium sorbate against natural microflora in strawberry paste during storage. Korean J. Food Sci. Technol.
36:355-360.
Park, K.H., and S.H. Kim. 2011. A comparative study of consumer preference for strawberries in korea and singapore.
Korean J. Agric. Manag. Policy. 38:321-340.
Centers for Disease Control and Prevention. 2008. The United States annual listing of foodborne disease outbreaks. Available from: http://www.cdc.gov/foodborne outbreaks/outbreak data.htm.
Accessed Aug. 1.
FDA. 2011. Fresh strawberries from washington county farm implicated in E. coli O157 outbreak in NW Oregon. Available from: http://www.fda.gov/Safety/Recalls/ucm267667.htm. Accessed Aug. 16.
Heaton, J.C., and K. Jones. 2008. Microbial contamination of fruit and vegetables and the behaviour of enteropathogens in the phyllosphere: A review. J. Appl. Microbiol. 104:613-626.
Beuchat, L.R. 1996. Pathogenic microorganism associated with fresh produce. J Food Prot. 59:204-216.
KFDA Food Code 10-3-1-43. 2009. Korea Food and Drug Administration. Seoul, Korea.
Kim, J.S., O.K. Bang, and H.C. Chang. 2004. Examination of microbiological contamination of ready-to-eat vegetable salad.
J Food Hyg Safety. 19:60-65.
Kim, W.L., A.R. Jo, J.H. Lee, S.R. Kim, K.H. Parl, K.W. Nam, Y.H. Yoon, D.H. Yoon, S.Y. Oh, M.H. Lee, J.G. Ryu, and H.Y.
Kim. 2013. Survey of Microbial Contamination of Tomatoes at Farms in Korea. J. Fd Hyg. Safety. 28:324-329 .
Kampelmacher, E.H. 1990. Food‐borne listeriosis facts and fiction. In “Food‐borne Listeriosis”. Proceedings of a symposium, Wesbaden, FRG. Technomic Pub. Co. Inc. Lancaster, Basel.
Asplund, K., and E. Nurmi. 1991. The growth of Salmonella in tomatoes. Int Food Microbiol. 13:177-182.
Beuchat, L.R., and R.E. Brackett. 1991. Behavior of Listeria- monocytogenes inoculated into raw tomatoes and processed tomato products. Appl Environ Microbiol. 57:1367-1371.
Oyarzabal, O.A., M.C. Nogueira, and D.E. Gombas. 2003. Survival
of Escherichia coli O157:H7, Listeria monocyutogenes, and Salmonella in juice concentrate. J Food Prot. 66:1595-1598.
Cho, Y.S., J.Y. Lee, M.K. Lee, D.B. Shin, and K.M. Park. 2011.
Prevalence and Characterization of Staphylococcus aureus Pa- thogenic Factors Isolated from Various Foods in Korea.
Korean J. Food Sci. Tecnol. 43:648-654.
Koo, M.S. 2009. Bacillus cereus An Ambusher of Food Safety.
Bulletin of Food Technology. 22:587-600.
Jung, H.J., J.I. Cho, S.H. Park, S.D. Ha, K.H. Lee, C.H. Kim, H.S.
Song, D.H. Chung, M.G. Kim, K.Y. Kim, and K.S. Kim. 2005.
Genotypic and phenotypic characteristics of Staphylococcus aureus isolates from lettuces and raw milk. Korean J. Food Sci.
Technol. 37:134-141.
Brackett, R.E., and D.F. Splittsoesser, 2001. Compendium of methods for the microbiological examination of foods. 4th ed.
American Public Health Association, Washington, DC, USA.
515-552.
Noleto, A.L., and M.S. Bergdoll. 1980. Staphylococcal enterotoxin production in the presence of non-enterotoxigenic staphylococci.
Appl Environ Microbiol. 39:1167-1171.
Troller, J.A. 1986. Water relations of foodborne bacterial pathogen, An update review. J Food Prot. 49:656-670.
Utermann, F., and C. Muller. 1992. Influence of aw value and storage temperature on the multiplication and enterotoxin formation of staphylococci in dry-cured raw hams. Int. J Food Microbiol. 16:09-115.
U.S. Food and Drug Administration: Foodborne pathogenic mocroorganial and natural toxins handbook. http://www.cgsan.
fda.gov/cgi-bim/.
Norman, N.N., and L.L. Wang. 1961. Studies on the use of sewage effluent for irrigation of truck crops. J. Milk Food Technol. 24:44-47.