3차원 비대칭 철근콘크리트 구조물의 비선형 지진응답해석
임 현 규 1 ․이 영 근 1 ․강 준 원 1† ․지 호 석 2 ․조 호 현 2 ․김 문 수 2
1홍익대학교 토목공학과, 2한국원자력안전기술원 구조부지평가실
Nonlinear Seismic Analysis of a Three-dimensional Unsymmetrical Reinforced Concrete Structure
Hyun-Kyu Lim 1 , Young-Geun Lee 1 , Jun Won Kang 1† , Ho-Seok Chi 2 , Ho-Hyun Cho 2 and Moon-Soo Kim 2
1
Department of Civil Engineering, Hongik University, Seoul, 121-791, Korea
2
Department of Structural Systems & Site Safety Evaluation, Korea Institute of Nuclear Safety, Daejeon, 305-338, Korea
Abstract
This paper presents the seismic performance of a geometrically unsymmetrical reinforced concrete building considering torsional effect and material nonlinearity of concrete and steel. The reinforced concrete building is a structure for seismic performance evaluation in the SMART-2013 international benchmark program. Nonlinear constitutive models for concrete and steel were constructed, and their numerical performance was demonstrated by various local tests. Modal analysis showed that the first three natural frequencies and mode shapes were close to the experimental results from the SMART-2013 program. In the time history analysis for low-intensity seismic loadings, displacement and acceleration responses at sampling points were similar to the experimental results. In the end, nonlinear time history analysis was conducted for Northridge earthquake to predict the behavior of the reinforced concrete structure under high-intensity seismic loadings.
Keywords : reinforced concrete structure, seismic response, time history analysis, SMART-2013 international benchmark program
†Corresponding author:
Tel: +82-2-320-1601; E-mail: [email protected] Received June 17 2014; Revised July 23 2014 Accepted July 30 2014
Ⓒ 2014 by Computational Structural Engineering Institute of Korea
This is an Open-Access article distributed under the terms of the Creative Commons Attribution Non-Commercial License(http://creativecommons.
org/licenses/by-nc/3.0) which permits unrestricted non-commercial use, distribution, and reproduction in any medium, provided the original work is properly cited.
1. 서 론
최근 유한요소해석 기법이 발전하고 컴퓨터 하드웨어 시스 템이 급속히 발달함에 따라 철근콘크리트 구조물의 지진응답 계산 및 예측기술에도 큰 발전이 이루어졌다. 그러나 재료의 물성치, 재료 비선형성, 감쇠계수, 수치해석 방법 등에 따라 해석 결과에 큰 차이가 발생하는 것이 일반적인 현실이다.
따라서 실제 실험결과와 유사하게 구조물의 지진응답을 계산 하기 위해 비선형 재료모델 개발(Kwak et al., 2000;
2003; Lee et al., 2007), 시공간의 멀티스케일 모델링 (Chung et al., 2012), 시간적분 알고리즘의 개선(Yoon
et al., 2012) 등 다양한 노력이 이루어지고 있다.지난 10년간 서유럽의 여러 연구기관에서는 다양한 내진
특성을 가진 철근콘크리트 구조물에 대한 내진성능을 테스트 하고 동해석의 정확도 및 신뢰도를 평가하는 연구를 진행해 왔다. CASSBA(Comportement et Analyse Sismique des Structures en Béton Armé, 1992~1994) 벤치마크 프로그램에서 수행한 벽과 바닥판 철근콘크리트 구조물의 내 진성능 실험(Bisch et al., 1994)이나 SAFE(Structure Armées Faiblement Elancées, 1997~1998) 프로그램의 단순콘크리트 벽에 대한 동적 실험(Kotronis et al., 1999) 등은 이러한 연구의 대표적인 사례라고 할 수 있다.
이러한 철근콘크리트 구조물의 지진거동을 실험결과와 유사
하게 해석하기 위하여 SMART-2013(Seismic design and
best-estimate Methods Assessment for Reinforced
concrete buildings subjected to Torsion and non-
Material properties Concrete Steel Young’s modulus(MPa) 32,000 210,000
Poisson ratio 0.2 0.3
Compressive strength(MPa) 30 500
Tensile strength(MPa) 2.4 500
Density(kg/m3) 2,300 7,800
Table 1 Material properties of concrete and steel
(a) Concrete
(b) Steel
Fig. 1 Strain-stress curves of concrete and steel
Fig. 2 Reinforced concrete RVE(unit: mm)
linear effects) 프로젝트가 추진되었다(Richard et al.,
2012; 2013). 이 프로젝트는 실험 연구에 이은 벤치마크 해 석 프로그램으로 구성되어 있다. 실험 부분에서는 전형적인 원 자력발전 설비 구조물의 절반부를 1/4로 축소하여 설계 및 시 공하고 진동대 실험을 통해 지진하중에 대한 구조물의 저항력 과 구조물 내부의 장비에 미치는 지진력의 영향을 평가한다.
벤치마크 해석 프로그램에서는 지진하중 하에서 구조물의 3차 원 비선형 응답과 층별 응답스펙트럼을 계산하는 다양한 방법 을 평가하고, 구조물 내부의 장비에 발생하는 지진하중을 산정 하며, 참가자의 다양한 모델링 및 시뮬레이션 결과를 비교·평 가한다.
이 논문에서는 SMART-2013 벤치마크 프로젝트의 비대 칭 철근콘크리트 구조물에 대해 재료 비선형성과 3차원 비틀 림 하중을 고려한 지진응답의 계산방법과 수치해석결과를 소 개한다. 먼저 콘크리트와 철근의 비선형 재료모델을 구성하 고 인장, 압축, 휨, 전단하중 등에 대한 응력-변형도 해석을 통해 비선형 재료모델의 성능을 평가한다. 그리고 3차원 철 근콘크리트 구조물의 유한요소모델을 개발하고 모드해석, 선 형 및 비선형 시간이력해석을 수행하여 지진하중에 대한 3차 원 동적 거동을 계산한다.
2. 재료모델의 국부요소 테스트(local test)
SMART-2013 프로젝트에서는 콘크리트와 철근의 물성치 를 Table 1과 같이 제시하고 있다. 프로젝트 참가자들은 이 러한 재료의 물성치를 이용하여 재료의 비선형모델을 독립적 으로 선정한다. 본 논문에서는 Table 1의 물성치를 기본으 로 하여 콘크리트는 다중선형 등방성 변형경화 모델(multi- linear isotropic hardening model)을 사용하고 철근은 완 전탄소성 모델(elastic-perfectly plastic model)을 사용하 였다(Kachlakev et al., 2001). Fig. 1은 재료모델의 응력 -변형률 곡선을 나타낸다.
선정한 비선형 재료모델의 역학적 거동을 검증하고 그 적합 성을 확인하기 위해 대표부피요소(Representative Volume Element; 이하 RVE)에 대해 Table 2에 나타낸 6가지의 국 부요소 테스트를 상용유한요소해석 프로그램인 ANSYS를 사 용하여 수행하였다. 콘크리트의 RVE는 한 변이 1m인 정육면
체이고 철근콘크리트 RVE는 Fig. 2와 같은 직육면체이다. 모 든 RVE는 1개의 요소로 이루어지며 콘크리트는 ANSYS의 SOLID65(8절점 고체요소) 요소를 사용하였고 철근은 BEAM 188(2절점 보요소) 요소를 사용하였다.
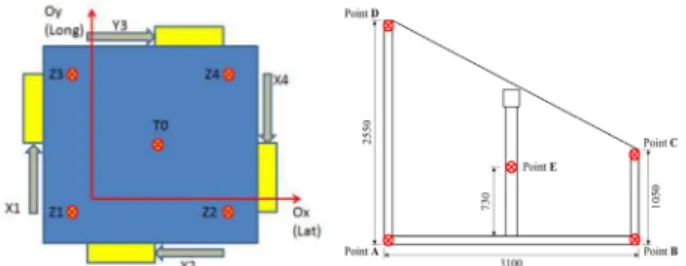
국부요소테스트 C.1과 C.2에서 콘크리트 RVE의 이축
(biaxial)압축 및 인장응답으로부터 항복면(yield surface)
과 파괴면(failure surface)을 구한 결과를 Fig. 3(a)에 나
타내었고, 철근콘크리트 RVE의 인장, 압축, 전단 및 휨에
대한 재료거동 특성을 평가하기 위하여 수행된 RC.1~RC.4
의 결과를 Fig. 3(b)~3(e)에 나타내었다. RC.2와 RC.3의
경우 변형률이 초기변형률(
=0.00028)을 초과하지 않아서
선형구간에서 반복 거동을 하였고, RC.1과 RC.4의 경우 변
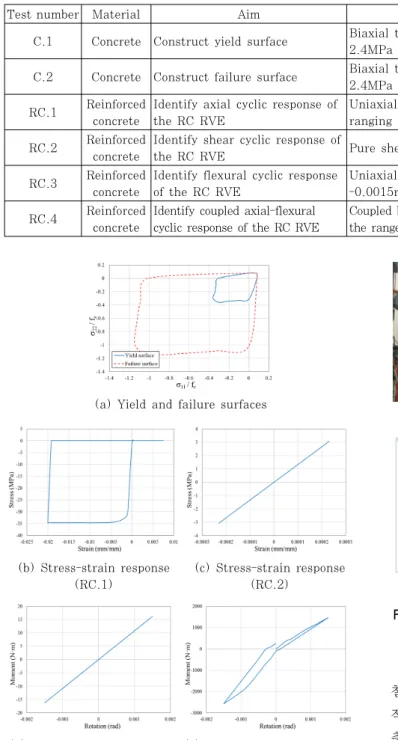
Test number Material Aim Loading conditions
C.1 Concrete Construct yield surface Biaxial tension/compression loading ranging from -10MPa to 2.4MPa
C.2 Concrete Construct failure surface Biaxial tension/compression loading ranging from -35MPa to 2.4MPa
RC.1 Reinforced concrete
Identify axial cyclic response of the RC RVE
Uniaxial cyclic tension/compression loading with the displacement ranging from -4mm to 1.5mm
RC.2 Reinforced concrete
Identify shear cyclic response of
the RC RVE Pure shear loading with the force ranging from -6KN to 6KN RC.3 Reinforced
concrete
Identify flexural cyclic response of the RC RVE
Uniaxial pure bending loading with the rotation ranging from -0.0015rad to 0.0015rad
RC.4 Reinforced concrete
Identify coupled axial-flexural cyclic response of the RC RVE
Coupled bending/tension loading with the rotation and displacement in the range of -0.0015rad~0.0015rad and -0.1mm~0.1mm, respectively Table 2 Configuration of local tests
(a) Yield and failure surfaces
(b) Stress-strain response (RC.1)
(c) Stress-strain response (RC.2)
(d) Moment-rotation response (RC.3)
(e) Moment-rotation response (RC.4)
Fig. 3 Local test results
(a) SMART-2013 structure (b) Plan view(unit: mm)
(c) 3D finite element model (d) Finite elements of rebar Fig. 4 SMART-2013 reinforced concrete structure and
its finite element model
형률이 초기변형률을 초과하여 비선형거동을 보였다. Fig.
3(b)의 응력-변형률 해석결과로부터 RVE가 본 연구에서 사 용한 콘크리트 재료모델의 응력-변형률 곡선을 반영하는 것 을 확인할 수 있고, 철근의 효과로 인하여 최대압축응력이 증가한 것을 알 수 있다.
3. SMART-2013 철근콘크리트 구조물의 수치모델링
SMART-2013 벤치마크 테스트에서 실험대상으로 하는 철근콘크리트 구조물은 Fig. 4(a)와 같다. 이 구조물은 전형 적인 원자력발전 설비구조물의 절반을 1/4규모로 제작한 3 층 높이의 비대칭 구조물이다. 구조물의 높이는 3.65m이고 슬래브의 비대칭 단면은 Fig. 4(b)에서 보듯이 사다리꼴 모 양으로서 윗변과 아랫변의 길이는 각각 1.05m, 2.55m이고, 높이는 3.10m이다. Table 1에 제시한 재료 물성치와 구조 물의 제원을 이용하여 Fig. 4(c)와 같이 3차원 유한요소해 석 모델을 생성하였다. 이 모델은 기초, 벽체, 슬래브, 보, 기둥, 철근, 진동대의 일곱 부분으로 구성된다. 기초, 벽체, 슬래브, 보, 기둥, 진동대는 SOLID65 요소로 모델링하였으 며, 철근은 BEAM188요소로 모델링하였다. 콘크리트와 철 근 요소는 절점을 공유하는 완전 부착상태로 설정하였다.
Fig. 4(d)는 철근의 유한요소 모델을 나타낸다.
4. 모드해석
SMART-2013 철근콘크리트 구조물의 고유진동수와 모드 형상을 결정하기 위하여 Block-Lanczos법에 기반한 모드해 석을 수행하였다. 구조물의 질량(11.5ton), 슬래브 위의 추 가질량(34.4ton), 진동대의 질량(25.0ton)을 고려하였으며, 경계조건으로서 진동대의 하중 재하 지점을 고정단으로 설정 하였다.
구조물의 모드해석을 수행하여 얻은 초기 3개 모드의 고 유진동수를 SMART-2013의 실험결과로부터 얻은 고유진동 수와 비교하여 Table 3에 나타내었고 각 모드별 형상을 Fig. 5에 나타내었다. 모드해석결과 고유진동수는 실험결과 로부터 얻은 진동수와 유사하였으며 모드형상은 모든 모드에 서 비틀림을 동반하는 형태로 나타났다.
Frequency(Hz)
Mode 1 Mode 2 Mode 3
Analysis 6.26 7.77 13.15
Experiment 6.28 7.86 16.50
Table 3 Comparison of natural frequencies obtained from modal analysis and experiments
(a) Mode 1
(b) Mode 2
(c) Mode 3
Fig. 5 Mode shapes for the first three modes
5. 시간이력해석
5.1 시간이력해석의 개요
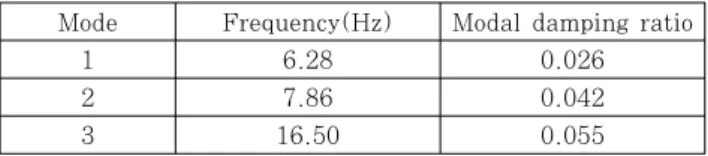
본 논문의 철근콘크리트 구조물에 대하여 진동대의 액츄에 이터(actuator) 위치에 변위의 시간이력으로 구성된 지진하중 을 적용하여 구조물의 변위 및 가속도 응답과 응답 스펙트럼을 산출하였다. 액츄에이터는 Fig. 6과 같이 진동대의 측면과 밑 면에 배치되어 있으며 수평방향 액츄에이터(X1, X4, Y2, Y3) 4개, 수직방향 액츄에이터(Z1, Z2, Z3, Z4)로 구성되어 있다. 이 8개의 액츄에이터에 변위제어 방식으로 지진하중의 시간이력을 입력하였다. 응답 계산 지점은 SMART-2013에 서 계측장비를 설치한 지점과 같은 위치로서 Fig. 6에 표시된 각 층 슬래브의 A~E지점에서 변위 및 가속도 시간이력응답을 계산하였다.
Fig. 6 Actuator locations and measurement points
5.2 감쇠행렬 결정
본 논문에서는 철근콘크리트 구조물의 동적 응답 감쇠효과 를 반영하기 위해 다음과 같이 강성행렬( )과 질량행렬( ) 의 선형조합으로 표현되는 Rayleigh 감쇠를 사용하였다.
(1)
여기서, 와 는 다음과 같이 임의의 두 개 모드의 고유진 동수와 감쇠비를 이용한 연립방정식의 해로 나타내어 진다.
(2)
위 식에서
과
은 각각 차 모드와 차 모드의 진동 수(rad/s)를 나타내고,
과
은 각 모드의 감쇠비를 나타 낸다. Table 4에 나타낸 1차 모드와 2차 모드의 고유진동수 값들을 이용하여 식 (2)로부터 Rayleigh 감쇠 파라미터
=-1.65, =0.002를 계산하였고, 이를 ANSYS에 적용하
여 감쇠효과를 반영하였다.
(a) Time history of (b) Frequency spectrum of (c) Time history of (d) Frequency spectrum of
Fig. 7 Low-intensity seismic loads; displacement time histories( and ) and their frequency spectrum
(a) Displacement in the
-direction
(b) Displacement in the
-direction
(c) Acceleration in the
-direction
(d) Acceleration in the
-direction Fig. 8 Comparison of numerical and experimental results at measurement point A of the 1-st floor
(a) Displacement in the
-direction
(b) Displacement in the
-direction
(c) Acceleration in the
-direction
(d) Acceleration in the
-direction Fig. 9 Comparison of numerical and experimental results at measurement point A of the 2-nd floor
(a) Displacement in the
-direction
(b) Displacement in the
-direction
(c) Acceleration in the
-direction
(d) Acceleration in the
-direction Fig. 10 Comparison of numerical and experimental results at measurement point A of the 3-rd floor Mode Frequency(Hz) Modal damping ratio
1 6.28 0.026
2 7.86 0.042
3 16.50 0.055
Table 4 Modal damping ratios determined by experiments
5.3 선형 시간이력해석
본 논문의 철근콘크리트 구조물에 대해 SMART-2013에
서 제공한 저강도 지진하중을 사용하여 선형 시간이력해석을 수행하였다. 이 저강도 지진하중은 각 액츄에이터 위치에서 PGA(Peak Ground Acceleration)가 0.1g인 변위의 시간 이력으로 구성되어 있다. Fig. 7은 이 지진하중의 변위 시간 이력과 주파수 스펙트럼을 나타낸다.
진동대에 배치된 8개의 액츄에이터에 변위제어 방식을 통
해 저강도 지진하중을 적용하여 시간이력해석을 수행한 결
과, 각 층 슬래브의 A~E지점에서 와 축 방향에 대해
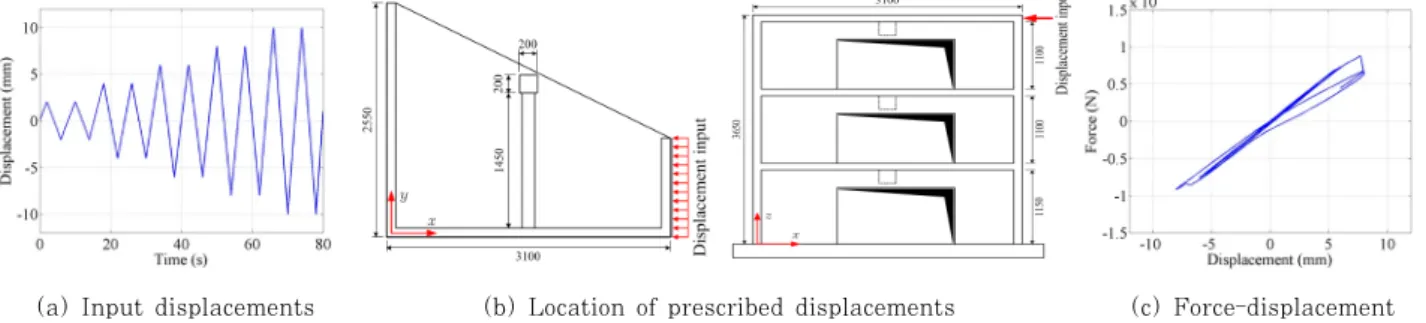
(a) Input displacements (b) Location of prescribed displacements (c) Force-displacement hysteresis loop Fig. 11 Loading history and hysteresis result of a quasi-static test
(a) Time history of (b) Frequency spectrum of (c) Time history of (d) Frequency spectrum of
Fig. 12 Northridge earthquake loads; displacement time histories( and ) and their frequency spectrum
(a) Displacement in the
-direction
(b) Displacement in the
-direction
(c) Acceleration in the
-direction
(d) Acceleration in the
-direction Fig. 13 Numerical results at measurement point A of the 1-st floor
SMART-2013의 실험결과와 유사한 변위 및 가속도 응답을 얻을 수 있었다. Fig. 8~10은 각 층 슬래브 A지점에서의 변위와 가속도 응답을 나타낸다.
5.4 구조물의 준정적 테스트
요소 단위에서 비선형 거동이 확인된 콘크리트와 철근의 재료모델을 사용할 때 철근콘크리트 구조물 전체의 비선형 거동이 나타나는지 확인하기 위해 준정적 테스트를 수행하였 다. 진동대의 하중 재하 지점을 고정단으로 설정하고 시간에 따라 단계적으로 증가하는 변위이력을 구조물의 3층 슬래브 옆면에 적용하였다. Fig. 11(a)는 준정적 테스트에 사용된 변위이력을 나타내고 Fig. 11(b)는 변위가 적용되는 위치를 나타낸다. 준정적 테스트 결과 Fig. 11(c)와 같은 하중-변위 이력을 얻을 수 있었는데, 하중 재하 방향으로 놓인 전단벽 으로 인해 큰 연성도가 나타나지 않지만 구조물 전체의 비선
형 거동을 확인할 수 있다.
5.5 비선형 시간이력해석
본 논문의 철근콘크리트 구조물에 대해 Northridge 지진 데이터를 적용하여 비선형 시간이력해석을 수행하였다. PGA 가 1.78g인 Northridge 지진하중을 선형 시간이력해석과 마찬가지로 액츄에이터 위치에 변위의 시간이력으로 적용하 였다. Fig. 12는 이 지진하중의 변위 시간이력과 주파수 스 펙트럼을 나타낸다.
진동대에 배치된 8개의 액츄에이터 위치에 변위제어 방식
을 통해 Northridge 지진하중을 적용하여 Fig. 13~15와
같이 각 층 슬래브의 A지점에서 와 축 방향의 변위 및 가
속도 응답을 계산하였다. 해석결과, 각 층 슬래브 A지점에서
최대 5mm의 변위가 발생하였고 구조물의 손상으로 인해 잔
류변형이 생기는 것을 확인할 수 있다. Fig. 16~18은 각
(a) Displacement in the
-direction
(b) Displacement in the
-direction
(c) Acceleration in the
-direction
(d) Acceleration in the
-direction Fig. 14 Numerical results at measurement point A of the 2-nd floor
(a) Displacement in the
-direction
(b) Displacement in the
-direction
(c) Acceleration in the
-direction
(d) Acceleration in the
-direction Fig. 15 Numerical results at measurement point A of the 3-rd floor
(a) -direction (b) -direction Fig. 16 Spectrum of maximum relative displacement
on the 1-st floor
(a) -direction (b) -direction Fig. 17 Spectrum of maximum relative displacement
on the 2-nd floor
(a) -direction (b) -direction Fig. 18 Spectrum of maximum relative displacement
on the 3-rd floor