․교신저자: 조충식 충남 천안시 두정동 621번지 대전대학교 부속천안한방병원 신계내과 TEL: 041-521-7531 FAX: 041-521-7007 E-mail: [email protected]
消平湯이 RIN-m5F 세포에서 인슐린 분비 및 유전자 발현에 미치는 영향
윤성식, 조충식
대전대학교대학원 한의학과 내과학교실
Effect of Sopyung-tang Extract on Insulin Secretion and Gene Expression in RIN-m5F Cells
Sung-sik Youn, Chung-sik Cho
Dept. of Oriental Medicine Graduate school, Dae-Jeon University ABSTRACT
Background :
At high glucose levels in β-cells, cell viability and insulin secretion are decreased by glucotoxicity. Sopyung -tang(SPT) had an effect on blood glucose level decrease and antioxidant enzyme activities in streptozotocin-induced diabetic rats.
Objectives :
This study performed a series of experiment to verify the effects of SPT extract on the cell viability, antioxidant enzyme activities, insulin secretion and insulin mRNA expression at hyperglycemic states of RIN-m5F.
Methods :
After treatment at various concentrations of SPT added to the RIN-m5F cells, cell viability by MTT assay, free radical-scavenging activity, SOD activity and insulin secretion were measured. Additionally, insulin-related gene expression was measured using real-time RT-PCR.
Results :
Compared to the control group, SPT extract showed considerable effects on RIN-m5F cell viability, DPPH radical-scavenging activity, superoxide dismutase (SOD) activity, insulin secretion and insulin-related gene expression.
Conclusions :
This study showed that SPT extract has an effect on β-cell cell viability, insulin secretion and insulin -related gene expression. Thus, SPT extract may be used for treatment of diabetes and its complications. Further mechanism studies of SPT seem to be necessary on the glucotoxicity and oxidative stress.
Key words : Glucotoxicity, Sopyung-tang(SPT), RIN-m5F, Insulin secretion, Gene expression
Ⅰ. 서 론
당뇨병은 포도당의 세포 내 흡수에 관여하는 호 르몬인 인슐린이 정상적으로 분비되지 못하거나 조직에서의 인슐린에 대한 감수성 감소로 포도당
의 혈액 내 농도가 증가하여 고혈당 상태가 지속 되는 만성 대사성 질환이다
1,2. 2008년 통계청의 발 표에 따르면, 당뇨병으로 인한 사망인구는 10만 명 당 20.7명으로 국내 사망원인 중 5위를 차지하였고, 40대의 경우 5.8명, 50대의 경우 17.2명, 60대의 경 우 53.6명으로 연령에 따라 사망률이 증가하였다
3.
당뇨병에서 나타나는 고혈당은 여러 기관의 구
조적, 기능적 독성을 일으켜 당뇨병성 망막병증,
신병증, 신경병증, 대혈관 질환 등의 합병증을 유
발하고, 고혈당이 지속될수록 췌장 β-cell의 기능이 악화되어 인슐린의 분비가 줄어들게 된다
4-6.
최근 당뇨병 동물모델과 당뇨병 환자에서 고혈 당으로 인한 대사이상으로 reactive oxygen species (ROS)가 증가되는 것으로 밝혀졌고
7-9, oxidative stress가 당뇨병에서 혈관합병증의 발생에 중요한 역할을 하는 것으로 보고되었다
10. 또한, 인슐린 분 비 감소는 췌장 β-cell의 양과 밀접한 관련이 있고, 이러한 β-cell의 apoptosis를 촉진하는 기전으로 고 혈당에 의한 당독성
11,12, 지방산에 의한 지질독성
13,14
, ROS에 의한 oxidative stress 등이 알려져 있
다
15. 특히, oxidative stress는 당독성, 지질독성 등 여러 가지 자극들의 마지막 단계로 직간접적으로 β -cell의 apoptosis와 관련되고, 인슐린 저항성을 유 발함이 밝혀져 최근 주목받고 있다
16.
최근 한의학에서도 oxidative stress에 대한 췌장 β -cell 보호효과에 관심이 증대되어 각 본초들의 항산화작용 비교연구
17, 당뇨 백서에서의 항산화작 용에 대한 연구
18-21, 포도당 독성에 대한 RIN-m5F 세포의 인슐린 분비와 α-glucosidase 활성 억제에 미치는 영향에 대한 연구
22등이 이루어지고 있다.
본 연구에 사용된 消平湯은 이미 streptozotocin 으로 유발된 당뇨쥐의 췌장 β-cell 활성 및 항산화 효소활성에 작용하여 고혈당으로 인한 oxidative stress 생성을 감소시키는 것으로 밝혀졌다
23. 하지 만 아직까지 消平湯이 인슐린 분비 및 유전자 발 현에 미치는 효과에 대한 연구는 밝혀지지 않았다.
이에 저자는 消平湯이 포도당 독성에 대한 RIN-m5F 세포 보호와 인슐린 분비 및 유전자 발 현에 미치는 영향을 관찰하여 유의한 결과를 얻었 기에 보고하는 바이다.
Ⅱ. 실 험
1. 재 료 1) 약 재
본 실험에 사용한 消平湯( Sopyung-tang , SPT)
의 처방 1첩의 내용과 용량은 다음과 같으며 사용 한 약재는 대전대학교 부속한방병원에서 구입한 후 정선하여 사용하였다(Table 1).
Herb Galenical name Amount (g) 蒼 朮 Rhizoma of Atractylodes
japonica KOIDZ. 8
牧丹皮 Cortex of Paeonia suffruticosa
ANDR. 6
白 朮 Radix of Atractylodes
macrocephal KOIDZ. 6 陳 皮 Pericarpium of Ciyrus unshiu
MARKOVICH 6
當 歸 Radix of Angelica gigas NAKAI 4 赤芍藥 Radix of Paeonia lactiflora PALL. 4 桃 仁 Semen of Prunus Persica(L.)
BATSCH 4
厚 朴 Cortex of Magnolia officinalis
REHD. et WILS. 4
甘 草 Radix of Glycyrrhizae uralensis
FISCH. 4
梔 子 Fructus of Gardenia jasminoides for. grandiflora MAKINO. 3 黃 芩 Radix of Scutellaria baicalensis
GEORGI. 3
貝 母 Bulbus of Fritillaria cirrhosa
D.DON. 4
桔 梗 Radix of Platycodon
grandiflorum(JACQ.) A. DC. 4 靑 皮 Viride Pericarpium of Citri
reticulata BLANCO. 4 車前子 Semen of Plantago asiatica L. 4 Total amount 68(g) Table 1. Prescription of Sopyung-tang (SPT)
2) 시약 및 세포주
Cell culture는 FBS(Gibco-BRL, Grand Island, U.S.A.), RPMI1640(Gibco-BRL, Grand Island, U.S.A.), 10mM HEPES, 2mM L-glutamine, 1mM sodium pyruvate, 100U/㎖ penicillin, 100μg/㎖
streptomycin, 50μM 2-mercaptoethanol, D-PBS
dulbecco's phosphate buffered saline(GIBCO BRL Life Technology, Grand Island, U.S.A.), potassium phosphate dibasic, potassium phosphate monobasic, trypsin-EDTA(GIBCO BRL, U.S.A.), p-Nitrophenyl a-D-glucopyranoside, PIPES buffer (0.1M, pH 6.8), alpha-glucosidase, isopropanol 3-(4,5-dimethylthiazol -2yl)-2,5-diphenyl-2H-tetrazolium bromide(MTT), NaOH, Dimethyl Sulfoxide(DMSO), isopropyl alcohol은 Sigma(U.S.A.) 제품을 사용하였고, trizol (Life Technologies, Gaithersburg, MD), Superscript II reverse transcriptase(Life Technologies, Gaithersburg, MD), iQ SYBR green supermix(Bio-Rad Laboratories, Inc., Hercules, CA), 기타 일반 시약은 특급 시약 을 사용하였다. Rat insulin radioimmunoassay (RIA) kit(Linco Research, Inc., St. Charles, MO) 는 Acetonitrile(Merck사, HPLC용)을 사용하였다.
RIN-m5F 췌장 β-cell 유래 세포주는 ATCC (Manassas, VA)에서 구입하였다.
3) 기 기
본 실험에는 열탕추출기(대웅, Korea), rotary vacuum evaporator(Büchi B-480, Switzerland), freeze dryer(EYELA FDU-540, Japan), CO2 incubator (Forma scientific Co., U.S.A.), clean bench(Vision scientific Co., Korea), autoclave(Sanyo, Japan), micro-pipet(Gilson, France), water bath(Vision scientific Co., Korea), vortex mixer(Vision scientific Co., Korea), spectrophotometer(Shimazue, Japan), centrifuge(Sigma, U.S.A.), deep-freezer(Sanyo, Japan), thermocycler system(MWG Biotech., Germany), ice-maker(Vision scientific Co., Korea), homogenizer (OMNI, U.S.A.), plate shaker(Lab-Line, U.S.A.) 및 ELISA reader(Molecular Devices, U.S.A.), C18 역상 HPLC columne(Hypersil, U.S.A.), HPLC (Shimazu, Japan)등을 사용하였다.
2. 방 법 1) 검액 조제
SPT 68g을 증류수 1,000㎖에 넣고 2시간 동안 가 열한 후 여과하여 얻은 액체성분을 rotay vacuum evaporator에서 감압 농축하여 약리성분을 추출하 였다. 농축된 용액을 freeze dryer로 동결 건조하여 7.6g의 분말을 얻었다. 얻어진 분말은 냉동고(-2 0℃)에 보관하면서 사용 시에는 필요한 농도로 phosphate buffer에 희석 후, 0.22㎛ 필터링하여 사 용하였다.
2) SPT의 High Performance Liquid Chromatography (HPLC) 분석
SPT의 수용성 성분을 분석하기 위하여 C18역상 HPLC columne을 장착한 HPLC를 사용하였다. 전체 분석시간은 30분으로 이동상의 구성은 초기 5분 동 안 H
2O를 흘려주었고, 이후 20분 동안은 acetonitrile gradient를 하여 acetonitrile을 100%까지 올렸으며, 그 상태를 5분간 지속하였다. 214㎚에서의 흡광도 를 측정하여 시료의 양을 확인하였다.
3) RIN-m5F 세포의 배양
췌장 β-cell 유래 세포주인 RIN-m5F 세포는 10% FBS, 10mM HEPES, 2mM L-glutamine, 1mM sodium pyruvate, 100U/㎖ penicillin, 100μg/
㎖ streptomycin을 혼합한 RPMI 1640 Media에서 5% CO
2-95% air, 37℃에서 배양하였다. 배양액은 3~4일 간격으로 교대하였고 세포들은 trypsin- EDTA를 사용하여 떼어낸 후 계대배양하였다.
4) MTT를 이용한 세포 증식 측정
배양한 세포를 0.25% trypsin-EDTA을 사용하 여 분리한 후, PBS으로 3회 세척한 다음, 96-multiwell에 2×10
4cells/well의 세포수가 되도록 산정하여 사용하였다. 세포는 FBS가 들어있는 RPMI배양액에서 SPT을 각각 다양한 농도(2, 4, 6, 8, 12μg/㎖)로 처리한 후 48시간 동안 배양하였다.
이후 50㎍/㎖ MTT[3-(4,5-dimethylthiazol-2-yl) -2,5-diphenyl tetrazolium bromide]를 처리하여 반 응시킨 다음 microplate reader로 570nm에서 측정 하였다.
5) 1,1-diphenyl-2-picrylhydrazyl(DPPH) free radical
-scavenging 활성 측정
SPT의 free radical 소거 활성은 stable radical인 DPPH에 대한 환원력을 측정한 것으로, SPT을 phosphate buffer에 녹여 다양한 농도(0.1, 1, 10, 100㎍/㎖)로 처리한 후 100㎕에 200mM DPPH 900㎕를 섞고 상온에서 10분간 방치 후, eppendorf tube에서 96-well plate의 각 well에 분주하여 O.D 517mm에서 측정하였다.(Blank : phosphate buffer, Control : phosphate buffer+DPPH)
Free radical scavenging activity (%)
= (1-
)× 100 6) SOD(superoxide dismutases) 활성 측정 실험 96-well plate의 각 well에 다양한 농도(0.1, 1, 10, 100μg/㎖)의 SPT 20㎕를 첨가한 후 Reagent solution 200㎕를 넣고 마지막으로 Enzyme working solution을 넣어준 후, 37℃에서 20분간 반응시킨다.
ELISA reader를 이용하여 O.D 450mm에서 측정하 여, SOD activity(inhibition rate, %)를 계산하였다.
SOD 활성을 측정하는 nitrobultetrazolium(NBT) 을 이용한 method는 formazan dye의 물에 대한 난용 성과 환원된 xanthine oxidase와의 상호작용하는 단 점을 가지고 있다. 그래서 본 연구에서는 tetrazolium salt를 이용하여 SOD에 의한 환원으로 수용성의 WST-1(2-(4-Iodophenyl)-3-(4-nitrophenyl)-5-(2,4 -disulfophenyl)-2H-tetrazolium, monosodium salt) 를 형성하여 SOD activity를 측정하였으며, 측정은 SOD Assay kit(Dojindo, Japan)로 하였다.
7) RIN-m5F 세포에서 미치는 인슐린 분비 측정 RIN-m5F 세포를 well 당 3.0×10
5개로 12-well plate에 분주하여 완전배지에서 3일간 배양한 후 SPT과 동일한 D-PBS를 첨가하여 1~2일간 배양 하였다. SPT을 함유한 배지에서 배양한 후 modified Kreb's ringer bicarbonate 완충액(KRBB -HEPES, 134mmol/L NaCl, 4.8mmol/L KCl, 1mmol/L CaCl
2, 1.2mmol/L MgSO
4, 1.2mmol/L KH
2PO
4, 5mmol/L NaHCO
3, 10mmol/L HEPES,
1mg/㎖ BSA, pH 7.4)로 2회 세척하고 5mM, 20mM의 포도당을 함유한 KRBB-HEPES 완충액 으로 바꾸어 1시간 배양한 후, 상층액을 취하여 4℃에서 10분간 원심분리하여 상층액을 모아 -20℃
에 보관하였다. 분비된 인슐린의 양을 rat insulin RIA kit로 측정하였다. 각 well의 세포 단백질의 농도를 측정하여 각 단위 그램 단백질 당 인슐린 분비량을 계산하였다.
8) 역전사 중합효소 연쇄반응을 이용한 인슐린 합성 측정
RIN-m5F 세포를 well 당 3.0×10
5개로 6-well plate에 분주하여 5mM, 20mM의 포도당 배지와 SPT을 함유한 배지(6, 12㎍/㎖)에서 48시간 동안 배양하였다. KRBB-HEPES 완충액으로 2회 세척 하고 1시간 동안 배양한 후, 각각 5mM, 20mM의 포도당을 함유한 KRBB-HEPES 완충액으로 배양 한 다음 trizol로 총 RNA를 추출하였다. 세포에 1
㎖의 trizol 용액을 첨가한 후 실온에서 5분 동안 배양하고 trizol 용액 1㎖당 0.2㎖의 chloroform을 첨가하여 4℃에서 15분 동안 12,000×g로 원심 분리 하였다. 상층부의 액상 부위를 새로운 튜브에 옮겨 담은 후 0.5㎖의 isopropyl alcohol을 첨가하고 실온 에서 15분간 배양하고 4℃에서 10분간 12,000×g로 다시 원심 분리하였다. Superscript II reverse transcriptase를 이용하여 RNA를 역전사하여 cDNA 를 얻은 후 iQ SYBR green supermix를 이용하여 β -actin에 대한 중합효소 연쇄반응을 시행하였다.
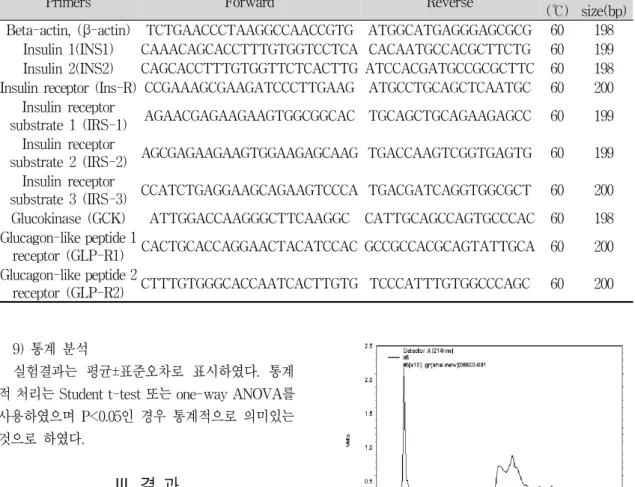
각 유전자 발현 정도를 real-time RT-PCR을 이 용해 측정하였다. 각각의 유전자들의 염기 서열은 Table 2와 같다. 각 sample의 추출된 RNA에 2X SYBR Green Master Mix(Bio-Rad) 25㎕와 각각 의 유전자들과 10pM forward and reverse primers 를 1㎕씩 첨가하여 각각 50㎕ 반응이 이루어졌으며 95℃에서 10분 후 30초간 40cycle을 돌린 다음 60℃
에서 30초, 72℃에서 30초 동안 반응을 일으켰다. β
-actin mRNA을 control로, target mRNA를 정량하
여 유전자 발현을 비교하였다.
Primers Forward Reverse Tm
(℃) Product size(bp) Beta-actin, (β-actin) TCTGAACCCTAAGGCCAACCGTG ATGGCATGAGGGAGCGCG 60 198
Insulin 1(INS1) CAAACAGCACCTTTGTGGTCCTCA CACAATGCCACGCTTCTG 60 199 Insulin 2(INS2) CAGCACCTTTGTGGTTCTCACTTG ATCCACGATGCCGCGCTTC 60 198 Insulin receptor (Ins-R) CCGAAAGCGAAGATCCCTTGAAG ATGCCTGCAGCTCAATGC 60 200
Insulin receptor
substrate 1 (IRS-1) AGAACGAGAAGAAGTGGCGGCAC TGCAGCTGCAGAAGAGCC 60 199 Insulin receptor
substrate 2 (IRS-2) AGCGAGAAGAAGTGGAAGAGCAAG TGACCAAGTCGGTGAGTG 60 199 Insulin receptor
substrate 3 (IRS-3) CCATCTGAGGAAGCAGAAGTCCCA TGACGATCAGGTGGCGCT 60 200 Glucokinase (GCK) ATTGGACCAAGGGCTTCAAGGC CATTGCAGCCAGTGCCCAC 60 198 Glucagon-like peptide 1
receptor (GLP-R1) CACTGCACCAGGAACTACATCCAC GCCGCCACGCAGTATTGCA 60 200 Glucagon-like peptide 2
receptor (GLP-R2) CTTTGTGGGCACCAATCACTTGTG TCCCATTTGTGGCCCAGC 60 200 Table 2. Sequences of Primer Set
9) 통계 분석
실험결과는 평균±표준오차로 표시하였다. 통계 적 처리는 Student t-test 또는 one-way ANOVA를 사용하였으며 P<0.05인 경우 통계적으로 의미있는 것으로 하였다.
Ⅲ. 결 과
1. SPT의 HPLC 분석 결과
C18역상 HPLC를 사용하여 SPT의 수용성 성분 을 분석하였다. 역상 HPLC 분석 결과 앞부분의 수용 성분을 확인하였다(Fig. 1).
Fig. 1. Analysis of HPLC profile of SPT.
Water extracts were subjected to C18 column Chromatography on acetonitrile linear gradient (line)over a 30min period at a flow rate of 1㎖
/min. Absorbance was monitored at 214nm.
2. Cell viability에 미치는 영향
저농도 포도당(5mM) 처리군의 경우, SPT을 함
유하지 않은 배지에서 RIN-m5F 세포를 배양한 군
(대조군)과 비교하여 SPT 2㎍/㎖에서 0.65±4.71%,
SPT 6㎍/㎖에서 3.73±5.23%, SPT 12㎍/㎖에서
-2.18±1.03%로 세포 증식에 영향을 미치지 않는 것 으로 확인되었다(Fig. 2).
고농도 포도당(20mM) 처리군의 경우, SPT 2㎍/㎖
에서 2.14±2.41%, SPT 6㎍/㎖에서 4.67±4.55%, SPT 12㎍/㎖에서 19.77±5.71%로 SPT 농도에 따라 세포 증식에 영향을 미치며, 대조군과 비교하여 유 의한 결과가 있었다(Fig. 2).
Fig. 2. Effects of SPT on proliferation.
Proliferation was determined after culturing 2×10⁴ cells per well without(control) or with various concentration(2~12㎍/㎖) of SPT for 48hours using MTT assay. (A) Cells were cultured with 5mM glucose. (B) Cells were cultured with 20mM glucose. Data represent the mean±SD (n=3). (*
: p<0.05)
저농도 포도당(5mM)에서 SPT(-)군은 0.55±2.97%, SPT(+)군은 -2.18±1.03%로 유의한 차이는 없었다 (Fig. 3).
고농도 포도당(20mM)에서 SPT(-)군은 -13.64±
2.35%, SPT(+)군은 19.77±5.71%로 유의성 있게 증가하여 SPT가 고농도 포도당(20mM)에서 세포 증식에 영향을 주는 것으로 확인되었다(Fig. 3).
Fig. 3. Additional effects of SPT on proliferation of RIN-m5F cells determined by MTT assay.
Proliferation was determined after culturing 2×10⁴ cells per well without or with 12㎍/㎖ SPT for 48hours using MTT assay. (* : p<0.05) SPT(-) : Addition of low glucose or high glucose to RIN-m5F cells without SPT.
SPT(+) : Addition of low glucose or high glucose to RIN-m5F cells with 12㎍/㎖ SPT.
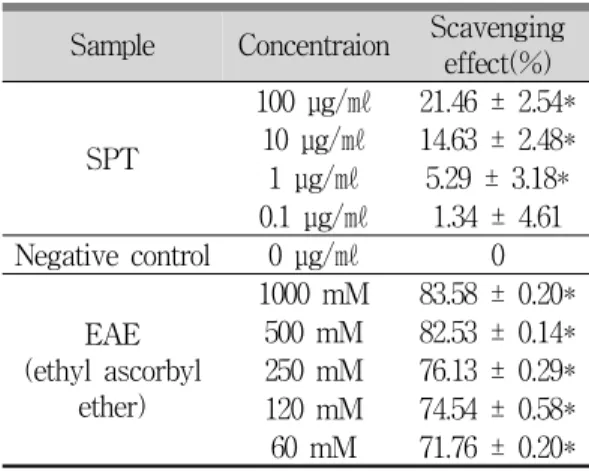
3. DPPH 라디칼 소거 작용에 대한 실험 결과 DPPH를 이용한 유리 라디칼 소거 반응에서 SPT 은 농도 의존적 항산화 작용을 보였다(Table 3).
SPT의 DPPH 라디칼 소거 작용은 SPT 1μg/㎖
에서 5.29±3.18%, 10μg/㎖에서 14.63±2.48%, 100μg/㎖
에서 21.46±2.54%로 대조군에 비하여 농도 의존적 으로 유의성 있게 항산화능이 증가하였다(Table 3).
Sample Concentraion Scavenging effect(%)
SPT
100 μg/㎖ 21.46 ± 2.54*
10 μg/㎖ 14.63 ± 2.48*
1 μg/㎖ 5.29 ± 3.18*
0.1 μg/㎖ 1.34 ± 4.61 Negative control 0 μg/㎖ 0
(ethyl ascorbyl EAE ether)
1000 mM 83.58 ± 0.20*
500 mM 82.53 ± 0.14*
250 mM 76.13 ± 0.29*
120 mM 74.54 ± 0.58*
60 mM 71.76 ± 0.20*
Each value is mean±SD (n>3). (* : p<0.05) Free radical scavenging activity (%)
= (1-
)× 100
Table 3. Effect of SPT on DPPH Radical-Scavenging
Activity
4. SOD 활성 측정에 대한 실험 결과
SPT 0.1μg/㎖에서 15.05±0.24%, 1μg/㎖에서 42.3 3±5.64%, 10μg/㎖에서 73.62±1.36%, 100μg/㎖에서 75.82±0.06%로 농도 의존적으로 대조군에 비하여 유의성 있게 증가하였다(Fig. 4).
Fig. 4. Effect of SPT on the Superoxide dismutase (SOD) activity.
The effect of SPT on SOD activity was determined using BTB method. Data represent the mean±
SD (n=3). (* : p<0.05)
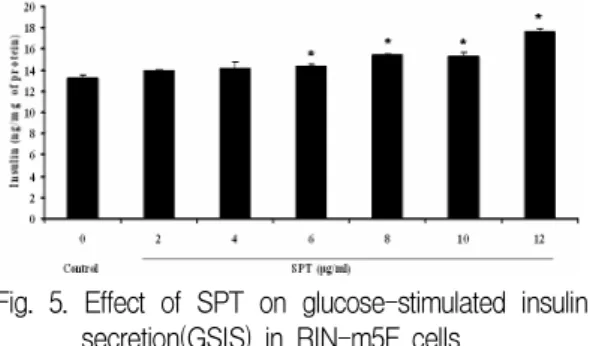
5. 포도당 자극과 SPT에 의한 인슐린 분비에 미치 는 영향
인슐린 분비량은 대조군의 경우, 저농도 포도당 (5mM)에서 19.32±0.26ng/mg protein/1h이었고, 고농 도 포도당(20mM)에서 13.00± 0.11ng/mg protein/1h 로 인슐린 분비량은 감소하였다(Fig. 5).
고농도 포도당(20mM)에서 SPT 6㎍/㎖에서 14.38±0.15ng/mg protein/1h, SPT 12㎍/㎖에서 17.65
±0.42ng/mg protein/1h로 대조군에 비하여 인슐린 분비량의 유의성 있는 증가가 확인되었다(Fig. 5).
Fig. 5. Effect of SPT on glucose-stimulated insulin secretion(GSIS) in RIN-m5F cells.
Secretion was determined after culturing 3.0×10⁵ cells per well without(control) or with various concentration(2~12㎍/㎖) of SPT for 48hours.
Cells were cultured in KRBB-HEPES containing 20mM glucose for 1hours. Insulin amount was measured by rat insulin RIA kit. Data represent the mean±SD (n=3). (* : p<0.05)
6. SPT이 인슐린 분비 관련 유전자 발현에 미치는 영향
1) Insulin-1
INS-1 mRNA 발현은 대조군에서 0.44±0.04였고, SPT 6㎍/㎖에서 0.80±0.09, 12㎍/㎖에서 0.82±0.03로 대조군에 비하여 유의성 있게 증가하였다(Fig. 6).
Fig. 6. Effect of SPT on INS-1 mRNA expression.
Expression was determined after culturing 6-well plate without(control) or with various concentration (6, 12㎍/㎖) of SPT for 48 hours. Cells are cultured with 20mM glucose. Expression levels were analyzed by real-time RT-PCR. Using β-actin mRNA as a control, target mRNA expression was quantified and compared. Data represent the mean±SD (n=3). (* : p<0.05)
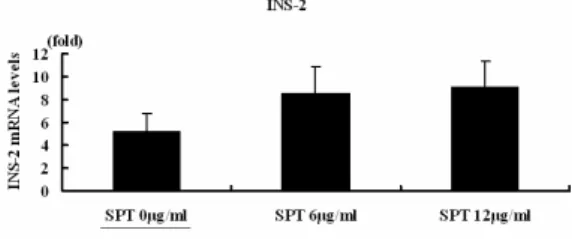
2) Insulin-2
INS-2 mRNA 발현은 대조군에서 5.24±2.40였고,
SPT 6㎍/㎖에서0.80±0.09, 12㎍/㎖에서 0.82±0.03로
대조군에 비하여 증가하였으나 유의성은 없었다
(Fig. 7).
Fig. 7. Effect of SPT on INS-2 mRNA expression.
Expression was determined after culturing 6-well plate without(control) or with various concentration (6, 12㎍/㎖) of SPT for 48 hours. Cells are cultured with 20mM glucose. Expression levels were analyzed by real-time RT-PCR. Using β -actin mRNA as a control, target mRNA expression was quantified and compared. Data represent the mean±SD (n=3).
3) Insulin receptor substrate 1
IRS-1 mRNA 발현은 대조군에서 4.88±1.52였고, SPT 6㎍/㎖에서 13.09±0.06, 12㎍/㎖에서 14.64±0.89 로 대조군에 비하여 유의성 있게 증가하였다(Fig. 8).
Fig. 8. Effect of SPT on IRS-1 mRNA expression.
Expression was determined after culturing 6-well plate without(control) or with various concentration (6, 12㎍/㎖) of SPT for 48 hours. Cells are cultured with 20mM glucose. Expression levels were analyzed by real-time RT-PCR. Using β -actin mRNA as a control, target mRNA expression was quantified and compared. Data represent the mean±SD (n=3). (* : p<0.05)
4) Insulin receptor substrate 2
IRS-2 mRNA 발현은 대조군에서 9.56±1.77였고, SPT 6㎍/㎖에서 43.65±16.29, 12㎍/㎖에서 45.04±1.89
로 대조군에 비하여 유의성 있게 증가하였다(Fig. 9).
Fig. 9. Effect of SPT on IRS-2 mRNA expression.
Expression was determined after culturing 6-well plate without(control) or with various concentration (6, 12㎍/㎖) of SPT for 48 hours. Cells are cultured with 20mM glucose. Expression levels were analyzed by real-time RT-PCR. Using β-actin mRNA as a control, target mRNA expression was quantified and compared. Data represent the mean±SD (n=3). (* : p<0.05)
5) Insulin receptor substrate 3
IRS-3 mRNA 발현은 대조군에서 14.93±4.26였 고, SPT 6㎍/㎖에서 23.80±7.01, 12㎍/㎖에서 27.65
±8.15로 대조군에 비하여 증가하였으나 유의성은 없었다(Fig. 10).
Fig. 10. Effect of SPT on IRS-3 mRNA expression.
Expression was determined after culturing 6-well plate without(control) or with various concentration(6, 12㎍/㎖) of SPT for 48 hours.
Cells are cultured with 20mM glucose. Expression levels were analyzed by real-time RT-PCR.
Using β-actin mRNA as a control, target mRNA expression was quantified and compared.
Data represent the mean±SD (n=3).
6) Insulin receptor
Ins-R mRNA 발현은 대조군에서 0.046±0.021였 고, SPT 6㎍/㎖에서 0.017±0.002, 12㎍/㎖에서 0.016
±0.065로 대조군에 비하여 유의성 있게 감소하였다 (Fig. 11).
Fig. 11. Effect of SPT on Ins-R mRNA expression.
Expression was determined after culturing 6-well plate without(control) or with various concentration(6, 12㎍/㎖) of SPT for 48 hours.
Cells are cultured with 20mM glucose. Expression levels were analyzed by real-time RT-PCR.
Using β-actin mRNA as a control, target mRNA expression was quantified and compared.
Data represent the mean±SD (n=3). (* : p<0.05)
7) Glucokinase
GCK mRNA 발현은 대조군에서 0.027±0.004였 고, SPT 6㎍/㎖에서 0.028±0.008, 12㎍/㎖에서 0.025
±0.001로 대조군에 비하여 유의한 변화는 관찰되지 않았다(Fig. 12).
Fig. 12. Effect of SPT on GCK mRNA expression.
Expression was determined after culturing 6-well plate without(control) or with various concentration(6, 12㎍/㎖) of SPT for 48 hours.
Cells are cultured with 20mM glucose. Expression levels were analyzed by real-time RT-PCR.
Using β-actin mRNA as a control, target mRNA expression was quantified and compared.
Data represent the mean±SD (n=3).
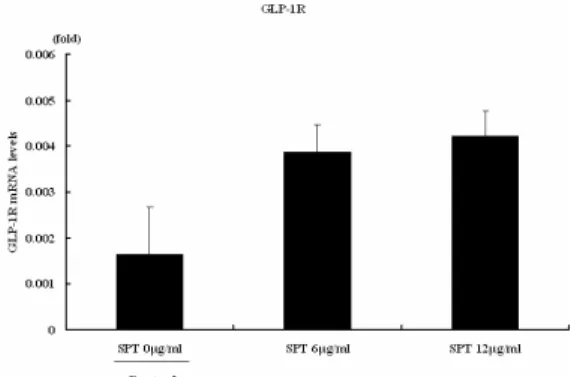
8) Glucagon-like peptide 1 receptor
GLP-1R mRNA 발현은 대조군에서 0.0016±
0.0005였고, SPT 6㎍/㎖에서 0.0038±0.0005, 12㎍/㎖
에서 0.0042±0.0015로 대조군에 비하여 증가하였으 나, 유의성은 없었다(Fig. 13).
Fig. 13. Effect of SPT on GLP-1R mRNA expression.
Expression was determined after culturing 6-well plate without(control) or with various concentration(6, 12㎍/㎖) of SPT for 48 hours.
Cells are cultured with 20mM glucose. Expression levels were analyzed by real-time RT-PCR.
Using β-actin mRNA as a control, target mRNA expression was quantified and compared.
Data represent the mean±SD (n=3).
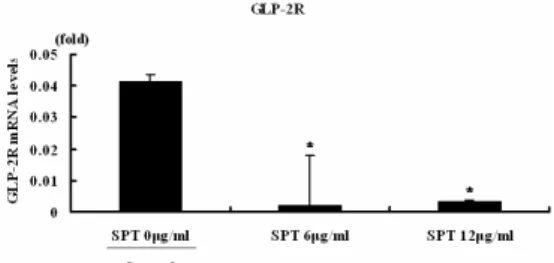
9) Glucagon-like peptide 2 receptor
GLP-2R mRNA 발현은 대조군에서 0.041±
0.0150였고, SPT 6㎍/㎖에서 0.0021±0.0002, 12㎍/㎖
에서 0.0032±0.0050로 대조군에 비하여 유의성 있게
증가하였다(Fig. 14).
Fig. 14. Effect of SPT on GLP-2R mRNA expression.
Expression was determined after culturing 6-well plate without(control) or with various concentration(6, 12㎍/㎖) of SPT for 48 hours.
Cells are cultured with 20mM glucose. Expression levels were analyzed by real-time RT-PCR.
Using β-actin mRNA as a control, target mRNA expression was quantified and compared.
Data represent the mean±SD (n=3). (* : p<0.05)