Vol.33, No.9 pp. 635~644, 2009 (ISSN-1598-5725)
Optimum Design of the Power Yacht Based on Micro-Genetic Algorithm
Joo-Shin Park*, Yun-Young Kim†
* Senior Engineer, Structure Research Part, Marine Research Institute, Samsung Heavy Industries Co., Ltd, Korea
†Research Professor, Division of Marine System Engineering, Mokpo National Maritime University, Korea
Abstract : The optimum design of power yacht belongs to the nonlinear constrained optimization problems. The determination of scantlings for the bow structure is a very important issue with in the whole structural design process. The derived design results are obtained by the use of real-coded micro-genetic algorithm including evaluation from Lloyd’s Register small craft guideline, so that the nominal limiting stress requirement can be satisfied. In this study, the minimum volume design of bow structure on the power yacht was carried out based on the finite element analysis. The target model for optimum design and local structural analysis is the bow structure of a power yacht. The volume of bow structure and the main dimensions of structural members are chosen as an objective function and design variable, respectively. During optimization procedure, finite element analysis was performed to determine the constraint parameters at each iteration step of the optimization loop. optimization results were compared with a pre-existing design and it was possible to reduce approximately 19 percents of the total steel volume of bow structure from the previous design for the power yacht.
Key words : real-coded micro-genetic algorithm; buckling; minimum volume design.
†Corresponding author: Yun-Young Kim, [email protected] 061)240-7217
* [email protected] 061)240-7217
1. Introduction
In the present paper, analysis of ship’s local strength is performed. The optimised design results are produced with the aid of Real-coded Micro-Genetic Algorithm (RμGA) and Lloyd’s Register small craft guideline, so that the nominal limiting stress requirement can be satisfied.
RμGA is proposed to achieve the parameterisation study for optimum configurations of the bow structure without handling any of penalty functions. Micro-Genetic Algorithm (μGA) explores in a small population with some genetic operators to find the global optimum solution-spaces (Kim et al., 2004). RμGA offers the advantage that the continuous parameters can gradually adapt to the fitness landscape over the entire search space whereas parameter values in binary implementations are limited to a certain interval and resolution. The proposed approach has the robustness of parallel exploration and asymptotic convergence with real value parameters. Therefore, RμGA can help in avoiding the premature convergence and search for better global solution, because of its wide spread applicability, global perspective and inherent parallelism.
The range of the structural analysis is performed on bow structural model including collision bulkhead against slamming and panting impact load is adopted in the FEM general purpose program, ANSYS (2005). The direct
calculation of the ship’s structural response will be based on a three-dimensional finite element analysis, carried out in accordance with this developing procedure.
In general, ship structure while in service period is likely to suffer structural damage due to impact pressure actions arising from slamming and panting load (Sebastiani et al., 2001). For high speed craft of ordinary hull form with a Rule length (Lr), less than 50m, the minimum hull girder strength requirements are generally satisfied by scantlings obtained from local strength requirements. However, longitudinal strength calculations may be required at LR’s discretion, dependent upon the shape of ship, construction arrangement and proposed loading. Torsional stresses are typically small for mono hulls of ordinary form of Rule length, less than 75m, and can generally be ignored (Lloyd’s Register, 2003).
As a result, the current authors can use 3-dimensional FEM program for structural strength analysis of power yacht based on the optimum design results.
Therefore, it has been concluded that the proposed RμGA
is an effective optimization tool for solving the optimum
design of bow structure of an actual power yacht within a
suitable computational time frame. The optimization results
were compared with a pre-existing design and it was
possible to reduce approximately 19 percents of the total
steel volume of bow structure for power yacht.
2. Real-coded micro-genetic algorithm
2.1 Real-coded GA versus binary-coded GA Genetic Algorithm (GA) had a great measure of success in search and optimization problems. The reason for a great part of its success is in the ability to exploit the information accumulated about an initially unknown search space in order to bias subsequent searches into useful subspaces.
The binary representation meets certain difficulties when dealing with continuous and/or discrete search spaces with large dimensions. One difficulty is the Hamming cliffs associated with certain strings from which a transition to a neighbouring solution requires the alteration of many bits.
The other difficulty is the inability to achieve a great numerical precision in the optimal solution (Herrera et al., 1998). A highlighted advantage of the Real-coded Genetic Algorithm (RGA) is the capacity for the local tuning of the solutions. For example, Legendre-Gaussian mutation allows the tuning to be produced in a more suitable and faster way than in the Binary-coded Genetic algorithm (BGA), where the tuning is difficult because of the Hamming cliff effect.
2.2 Micro-genetic algorithms
Real-coded Micro-Genetic Algorithm (RμGA) is one of the optimization methods with multi-point approaches. Starting with a number of candidate solutions, the multi-point approach updates one or more solutions in a synergetic manner in the hope of steering the population towards the optimum. A solution is directly represented as a vector of real-parameter decision variables. Starting with a population of such solutions (usually randomly created), a set of genetic operators (such as crossover and mutation) is performed to create a new population in an iterative manner.
Initial Structures
* Steer Population
* Search Population
Evaluate Steer Population
Update Steer & Search Population
Sort Steer & Search Population
Select Operator
Generate & Evaluate Offspring
Update Search Population
Evolve Steer Population
Sort Steer & Search Population
Measure Statistics
Terminal Condition ?
Optimum Results Yes
No Initial Structures
* Steer Population
* Search Population
Evaluate Steer Population
Update Steer & Search Population
Sort Steer & Search Population
Select Operator
Generate & Evaluate Offspring
Update Search Population
Evolve Steer Population
Sort Steer & Search Population
Measure Statistics
Terminal Condition ?
Optimum Results Yes
No
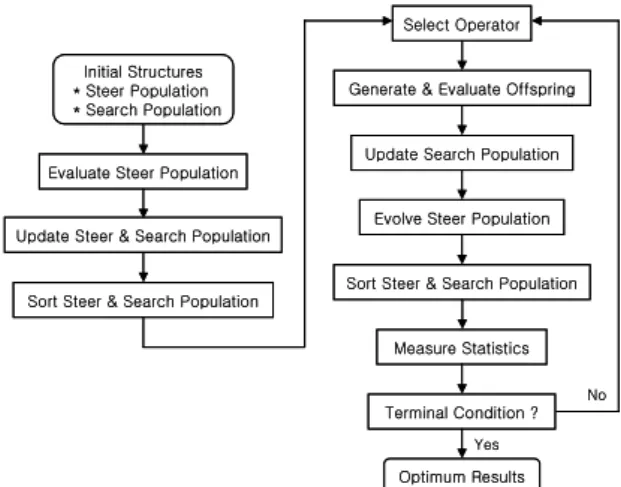
Fig. 1 Main skeleton of the proposed real-coded micro-genetic algorithm
RμGA offers the advantage that the continuous parameters can gradually adapt to the fitness landscape over the entire search space whereas parameter values in binary implementations are limited to a certain interval and resolution. RμGA blurs the distinction among genotype and phenotype, since in many problems the real number vector already embodies a solution in a natural way. The proposed algorithm has the robustness of parallel exploration and asymptotic convergence with real value parameters. The main skeleton of the RμGA is illustrated in Fig. 1.
2.3 Reproductive procedure
RμGA finds the global optimum solution by maintaining two types of populations as follows: search population and steering population (Michalewicz, 1994; Kim et al., 2006).
Initial populations, consisting of seven chromosomes, are generated in a random fashion to serve as the starting feasible solution-spaces. The populations, satisfying the engineering design constraints, serve as a reservoir of information about the environment and as a basis for generating new trials. The search population, which satisfies linear constraints of the problem, is a population for searching the solution-spaces in each generation. A development of the search population influences evaluations of individuals in the steering population, satisfying all constraints. At each generation step, a feasible search-space is searched by making steering points from the search points.
Some steering points are moved into the population of search points, where they undergo transformation by specialised operators. That is, the fitter chromosome is selected to produce offspring, which inherit the best characteristics of the parents, for the next generation schedule.
In the reproductive procedure of RμGA, the main challenge is how to use a pair of decision variable vectors to create a new pair of offspring vectors or how to perturb a decision variable vector to a mutated vector in a meaningful manner.
That is, the most important skill is how to make a reproductive plan for better searching technique due to the small population size. Therefore, multiple genetic operators are adopted for exploration of new solution-spaces.
2.4 Genetic operator
Due to an increasing interest in solving real-world
optimization problems using evolutionary algorithms,
researchers have developed a number of RGA. In such
studies, the main research effort is spent on developing an
efficient recombination operator. Such recombination
operators use probability distributions around the parent
solutions to create offspring.
As a result of the modified genetic representation, RμGA requires customisation of the standard mutation and crossover operators. In general, the distinction between a crossover and a mutation operator lies mainly in the number of parent solutions used in the perturbation process. If only one parent solution is used, it should be called a mutation operator.
Since most crossover operators do not use any fitness information for global optimum, there is no reason for a crossover operator to steer the search in any particular direction. The best that a crossover operator can do is to keep the mean of the offspring population the same as that of the parent population and alter the population variance.
The crossover operator creates each decision variable of offspring vectors from one or more parent vectors at a time with a probability. A gene with real value is mutated in a dynamic range.
The proposed RμGA for analysis and design of bow structure consists of 5 types of genetic operators: heuristic crossover, arithmetic crossover, boundary mutation, metropolis mutation and Legendre-Gaussian mutation. For the convenience of understanding of the following algorithms, some definitions are delineated as follows:
Parents : ⋯ ⋯ (1) Offspring : ⋯ ⋯
: Random number between the interval ,
: Unbiased coin flip with a value of zero or one,
: Parameter for parent solution,
: Parameter for offspring solution,
: i-th design variable in parent solution,
: i-th design variable in offspring solution,
: Index for selected solution.
2.4.1 Heuristic crossover operator
This operator, introduced by Wright (1991), is a unique crossover for the following reasons: (1) it uses values of the objective function in determining the direction of the search, (2) it produces only one offspring, and (3) it may produce no offspring at all. The operator generates a single offspring
by from parents . The parent is not worse than , i.e., ≤ for minimization problems and vice-versa for maximisation problems. It is possible for this operator to generate an offspring vector which is not feasible.
2.4.2 Arithmetic crossover operator
Arithmetic crossover (Michalewicz and Janikow 1991) generates an offspring by from parents . The random number is chosen by carefully calculating its maximum allowed value in all decision variables so that the resulting offspring does not exceed the lower or upper limits (domain constraints). This operator explores points in the search-space which belong to line connecting its parent, .
2.4.3 Boundary mutation operator
The diversity of the population should be kept to a certain minimal level during computation. This brings a negative effect of convergence deceleration that could be oppressive within large problem dimensions. This is why we have introduced boundary mutate operator (Michalewicz and Janikow 1991). The aim of this mutation is to grub the near neighbourhood of better chromosomes and so make searching for more and more precious solution faster. Therefore, the mutation is very good operator especially when best chromosomes have to contain vector with values near their boundary values. Boundary mutation works like uniform mutation, but replaces the value of the chosen vector with either the upper or lower bound for that vector (chosen randomly).
Let be a parent determined for mutation. If the -th component is the selected vector, the resulting offspring is
⋯ ⋯ , where is either or with equal probability ( and denote the new lower and new upper bound, respectively). The dynamic values ( and ) are easily calculated from the set of constraints.
2.4.4 Metropolis mutation operator
The idea of this operator, suggested by the current authors, is to use simulated annealing (SA) to achieve a fast convergence in search-spaces with feasible solutions.
Kirkpatrick et al. (1983) took the idea of the Metropolis
algorithm and applied it to combinatorial optimization
problems. SA is a technique that has attracted significant
attention, being suitable for optimization problems of large
scale, especially ones where a desired global extremum is
hidden among many, poorer, local extrema. That is, SA
introduces a more sophisticated way of moving from the
current solution to one of its neighbours, accepting with a
certain probability to move also when the quality of the new
solution is worst than the previous one.
Metropolis mutation generates an offspring from a parent by
(2)
Consider a huge number of particles of fixed volume at some temperature . Since the particles move, the system can be in various states. The probability that the system is in a state of certain energy is given by the Boltzmann distribution P rob ≈ exp . The energy state
is the fluctuation of the objective function value between an offspring and a parent in the optimization process. The quantity (Boltzmann’s constant) is a constant of nature that relates temperature to energy.
2.4.5 Legendre-gaussian mutation operator
This mutation, introduced by the current authors, consists in adding a random value from a Legendre-Gauss integral distribution to each element of an individual’s vector to create a new offspring. This operator is based on the Legendre-Gauss integral formula with a specified number of abscissae over the interval [-1,1]. If the gene is selected for this mutation from the set of movable genes, the resulting offspring is
(3)
where and are the newly specified limits (upper and lower, respectively) of the -th gene in each generation step. The limits are generated by and
. is the weigh of the designated evaluation point in the sum, and is the designated evaluation points. and are random numbers drawn uniformly from the interval [0,1]. This mutation is one of the operators responsible for the fine tuning capabilities of the system.
3. Volume minimization of bow structure
3.1 Design model for optimization and analysis In case of vessels up to 50m in length the structural design is mainly driven by local rather than global loads.
Structural analysis aims to examine a local strength for the
bow structure caused by slamming load and bottom impact load. The range of structural analysis, in this study, is limited to the collision BHD (Bulkhead), from frame space number 17 to 24 in bow structure.
During the finite element simulation, the finite element model does not model for superstructure because it does not influence the motion of bow structure. So, that is not included in the analysis. The targets for model are the structure below the main deck including outside plate and inner side plate, main deck, collision BHD and transverse web which are modeled using the commercial finite element program ANSYS. The four node thin shell element (type 63 in ANSYS element library) was used to model the plating of the vessel (i.e. hulls, decking, bulwarks, transverse bulkheads, frames, etc). Beam elements (beam 188) were used to model the stiffeners. This element is well suited to simulate thin and moderately thick shell components; it has both bending and membrane capabilities.
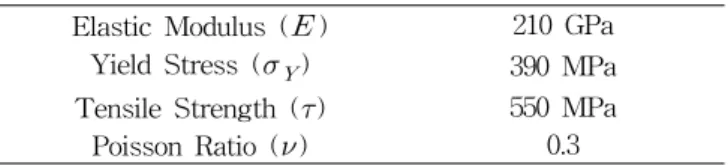
Table 1 Material properties of material
Elastic Modulus ( ) 210 GPa
Yield Stress ( ) 390 MPa
Tensile Strength ( ) 550 MPa
Poisson Ratio ( ) 0.3
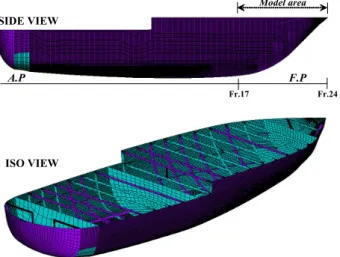
The large deflection capability is also included in the analyses. The size, type and number of elements were carefully selected to ensure that the effects of bending, shear and torsion of the hull beam was fully accounted for in the analysis. The mesh grading used was based on the spacing of both the frames and the longitudinal stiffeners. The longitudinal stiffeners have been modeled as precisely as possible, mainly in the zone where buckling phenomena were expected. Fig. 2 shows FE analysis model for HTS yacht.
The ship material is high tensile steel (AH40) and the particulars of material are indicated in Table 1.
In the present FE computations, the bow structure was assumed to be clamped boundary condition at frame space numbers 17 and 20 and symmetric condition of the bow model has been considered along the centerline of the bow model in order to reduce the number of degrees of freedom.
The two transverse end sections have been clamped. For the
local structural analysis, the bow structural model is to be in
equilibrium state (in balance) under any load combination for
all forces, thus the boundary supports have to satisfy the
following requirements.
A.P F.P Model area
Fr.17 Fr.24
SIDE VIEW
ISO VIEW
Fig. 2 Finite element model
1. The reaction forces at the boundary has to be minimised as much as possible
2. The whole model is without any rigid motion.
The design load, calculated from LR rule (Lloyd’s Register, 2003), is used. The hydrodynamic pressure due to relative motion has been taken as 10.7kN/㎡ and the pitching pressure due to pitching motion acting on the bottom shell of the hull is considered to have a value of 34.9kN/㎡.
The bottom impact pressure considered due to slamming is taken as 27.5kN/㎡ within frame space number from 17 to 20 and 30.04kN/㎡ between frame space numbers from 20 to 23, which is distributed below the design draft line. The impact pressure acting on the underside of the outside shell is taken as 11.5KN/㎡. The fore-body and bow slamming pressure at the load water line due to relative motion has been taken as 25.7kN/㎡ and the hydrostatic pressure acting on the bottom shell below chine-line or operating water-line is taken as 5.0kN/㎡.
3.2 hypotheses for preliminary design
In order to design the practical bow structure, the following hypotheses for preliminary design are considered ahead of the optimization procedure:
1. The Rules and Regulations of Lloyd's Register of Shipping are adopted (Lloyd’s Register, 2003).
2. All scantlings are rounded to the value of 0.5mm.
3. The scantling of the stiffening members is selected to satisfy the section modulus required from the Rules and Regulations of Lloyd's Register of Shipping (Lloyd’s Register, 2003).
4. All stiffeners of members uses the flat bar, except side
girder. Here, Side girder uses rolled angle bar.
With the above rules and regulations, the optimization procedure to determine the scantling calculates the section modulus, objective function and tuning of design variables etc.
3.3 Object function
In minimum volume design by using RμGA, the fitness evaluation involves defining an objective function against which each chromosome is evaluated for suitability under the consideration of environments. The objective function is mainly determined from the scantling design variables and the arranging geometric variables of a bow construction.
Therefore, the objective function is the total volume of all the members for the bow construction.
․
․
․
․
․
․
(4)
․ ․ ․
․ ․
․ ․
where,
: Sectional area of frame in transverse web frame
: Length of i-th frame in transverse web frame
: Total number of frames in transverse web frame
: Sectional area of beam in transverse web frame
: Length of j-th beam in transverse web frame
: Total number of beams in transverse web frame
: Sectional area of deck girder
: Length of k-th deck girder
: Total number of deck girders
: Sectional area of collision bulkhead stiffener
: Length of m-th collision bulkhead stiffener
: Total number of collision bulkhead stiffener
: Sectional area of center girder
: Length of center girder
: Sectional area of side girder
: Length of n-th side girder
: Total number of side girders
: total volume of shell, deck and bulkhead plating
3.4 Design variables
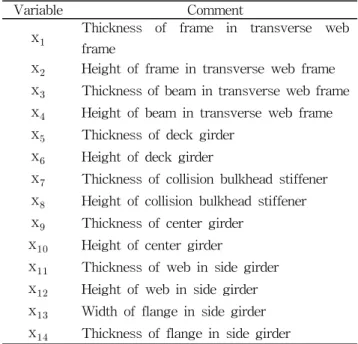
RμGA achieves the parameterisation study for optimum configurations of the bow structure. It can be carried out over the range of bow construction for a suitable sectional modulus likely to occur in structure. Design variables are the geometric beam configurations (thickness and height) of stiffeners, and listed in Table 2. The spaces of stiffeners are adopted as same value obtained from actual model ship.
Table 2 Design variables for bow construction design
Variable Comment
x Thickness of frame in transverse web frame
x Height of frame in transverse web frame x Thickness of beam in transverse web frame x Height of beam in transverse web frame x Thickness of deck girder
x Height of deck girder
x Thickness of collision bulkhead stiffener x Height of collision bulkhead stiffener x Thickness of center girder
x Height of center girder
x Thickness of web in side girder x Height of web in side girder x Width of flange in side girder x Thickness of flange in side girder
3.5 Linear/Nonlinear constraints
In scantling of longitudinal members, the rules of Lloyd’s Shipping are adopted as the design parameters in linear/nonlinear constraints. All design variables are not to be taken as less than 2.5 mm, except the design variables for center girder as 3.5 mm. These constraints are mentioned as follows:
≥ ⋯ (5)
where,
and
for all stiffeners of members
: Actual section modulus,
: Required minimum section modulus.
4. Computation results
4.1 Buckling capacity
A ship’s structure is a box girder structure composed of plates and stiffened plates. The main loads acting on the hull are bending moment, torsional moment and shear force which are produced by distributed lateral loads such as hull weight and cargo weight as well as the buoyancy and wave forces. Here, when compressive stress in structural members such as plates, stiffened plates, stiffeners etc. reaches a certain critical value, buckling takes place in the structural members. After buckling, deflection is gradually increased with increase the load or displacement, which causes by reduction in-plane stiffness.
In general, small craft keeps a sharp hull form in order to get a high speed better than that of commercial merchant vessel. Especially, bow structure interacts with several kinds of wave load and axial compression in the form of slamming and panting load.
y
B x
h
wt
wt
Flat bar
Fig. 3 Finite element model of stiffened plate
Fig. 3 shows the model for finite element analysis of a
stiffened flat plate. As shown by the dotted line in Fig. 3, a
finite element model covering a half span on sides of the
frame and the longitudinal stiffener is analyses. This model
is called the one bay stiffened plate model. Along three
boundaries of the model, symmetry condition was imposed
and clamped condition was imposed upon the edge adjacent
to upper deck panel. The in-plane displacement perpendicular
to the edge is set to be uniform to account for the continuity
of plating. The material is assumed to be elastic-perfectly
plastic, and the strain hardening is set as zero. Isotropic
hardening law is assumed employing von-Mises’s yield
condition. The assumed mechanical properties of the material are shown in Table 3.
Table 3 Material properties for stiffened flat plate
Material High Tensile Steel
Elastic Modulus ( ) 205.8 GPa
Poisson’ Ratio ( ) 0.3
Yield Stress ( y ) 352.8 Mpa
Hardening rate ( ) 0
4.2 Initial imperfections
A ship structure is constructed by connecting the members by welding, and the structural members are accompanied by initial imperfections such as initial distortion and welding residual stresses. In advanced ship structural design, load-carrying capacity calculations of ship plating should be performed considering the influences of post-weld initial imperfections. The characteristics of the post-weld initial imperfections are not completely understood. Actually, it is difficult to define the real magnitude and shape of initial imperfection. In this paper, magnitude of initial deflection proposed by Smith et al. (1988) is used. Smith suggested the following maximum values of representative initial deflections, and for plate and stiffener in flat stiffened plates in merchant vessel structures.
Plate :
for slight level
for averge level
for severe level
(6)
Stiffener :
for slight level
for averge level
for severe level
(7)
Where, and are the thickness and the length of the panel, respectively, and is the slenderness ratio of the local panel with yielding stress of . Using and in Equations (6) and (7), initial deflection of the following form is assumed in plating.
sin
(8)
Where, m and n represent the number of half-waves in x- and y-directions, respectively.
The shape of initial deflection in local panel is assumed to be the same with buckling mode. Magnitudes of are determined from the condition that the maximum magnitude
of initial deflection in buckling mode is equal to which corresponds to the slight level in Equation (6).
Initial deflection of the stiffener is assumed as
(9)
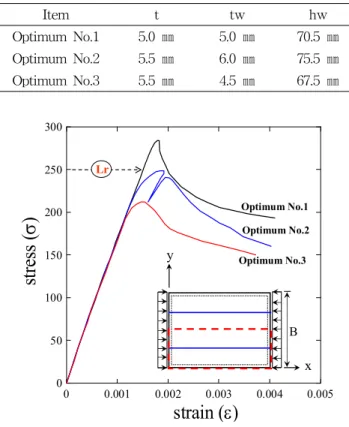
Which Equation (9) corresponds to the slight level in Equation (7). The assumed stiffened plate, as determined by the optimization, is shown in Table 4. The plate thickness is ranging from 5.0mm to 5.5mm, thickness of stiffener is from 4.5mm to 6.0 and height of stiffener is being varied from 67.5mm to 75.5mm.
Table 4 Geometrical data of stiffened plate
Item t tw hw
Optimum No.1 5.0 ㎜ 5.0 ㎜ 70.5 ㎜
Optimum No.2 5.5 ㎜ 6.0 ㎜ 75.5 ㎜
Optimum No.3 5.5 ㎜ 4.5 ㎜ 67.5 ㎜
0 0.001 0.002 0.003 0.004 0.005 0
50 100 150 200 250 300
strain (ε)
st re ss ( σ)
Optimum No.1 Optimum No.2 Optimum No.3 Lr
y
B x
Fig. 4 Relationships of stress and strain of stiffened plate subject to axial loading
Fig. 4 shows relationships of stress and strain varying dimension of stiffened flat plate in bow structure under axial compression. The dotted line is a result calculated by LR class rule, solid line represents the result of optimum three models.
It is observed that progressive collapse behavior of thinner
plate very greatly takes place it according to change of
dimension of stiffener. Especially, number 2 of optimum
model takes place snap-back equilibrium path after attained
the ultimate strength, and then rapidly reduced in-plane
rigidities. This is mainly induced by secondary buckling with change of deflection pattern from local buckling to web tripping. In general, flat-bar stiffener frequently takes place a tripping collapse due to lack of torsional rigidities. The model number 2 increased the web height comparing the others. It is easy to takes place a web buckling or tripping collapse which intended by geometrical problem.
x y z
Symmetric side
Symmetric side
Upper deck Bottom
(a) optimum No.1
x y z
Symmetric side Upper deck Bottom
Symmetric side (b) optimum No.2
x y z
Symmetric side
Symmetric side
Upper deck Bottom
(c) optimum No.3
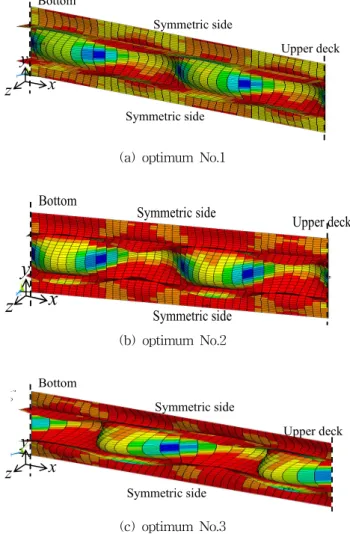
Fig. 5 Deformed shape and spreading equivalent stress
Fig. 5 shows total deformation and equivalent stress of stiffened plate at ultimate strength. The collapse behavior of optimum model number 1 is mainly governed by local panel buckling both plate and stiffeners. However, magnitude of deflection on the stiffener is small compared to model numbers 2 and 3. Optimum model number 1 has more than enough buckling strength against design loading.
In this paper, the design model for minimum volume optimization is the bow structure of high tensile steel yacht.
The design model is limited to the bow structure from frame 17 to 24 including the collision bulkhead. The volume of bow structure and the scantling of structural members are chosen
as the objective function and design variables, respectively.
The probability of obtaining the global minimum for RμGA is measured by running 500,000 independent trial iterations.
Fig. 6 shows the evolution process as the best-so-far fitness of the objective function at each generation step. As can be seen in Fig. 6, RμGA performed a rapid convergence tendency to near global optimum solution-spaces.
0 1 2 3 4 5
0 0.5 1 1.5 2 2.5 3
Number of Trials [ x 10
5] To ta l V ol u m e( m m
3) [ x 10
9]
Best Trials=439,336 Best Volume=76,179,167.34
Fig. 6 Evolution process
Table 5 optimization result Design
Variable
Initial Design (㎜)
Optimum Design (㎜)
x 7.0 6.0
x 120.0 95.5
x 4.0 3.0
x 52.0 49.0
x 4.0 3.0
x 62.0 53.5
x 4.0 4.0
x 85.0 70.5
x 6.0 5.5
x 130.0 92.5
x 4.0 5.0
x 75.0 67.5
x 70.0 72.5
x 5.0 5.0
Max Stress 94.25 MPa 134.25 MPa
Total Volume
(㎜) 90,653,209.1 76,179,167.3
Ratio 1.00 0.81
The local equivalent stress was found to varying from 40
to 125MPa on the bow structure, satisfying the Lloyd’s
Register criterion. These results are illustrated in Table 5.
The nominal limiting stress requirements for plating and primary/secondary stiffening members subjected to local loading conditions are given in terms of limiting stress coefficients (Dario and Massimo, 2001).
Table 6 indicates optimization results in comparison of initial design and optimum design. Table 7 is the results of structural analysis with collaboration work using optimization for bow structure. The maximum equivalent stress takes place about 34% comparing allowable stress by LR class rule on the bottom panel against impact load induced by slamming pressure.
Table 6 Result of the local structural analysis based on optimum design
Item
Bottom panels exposed to
slamming
292.50 125.8 0.43
Side structure 292.50 87.26 0.30
253.50 47.86 0.19
Main deck plating and stiffener
292.50 90.06 0.30
253.50 78.20 0.30
Collision BHD 253.50 122.3 0.48
292.50 105.1 0.34
- : Magnitude of the equivalent stress - : Shear stress in the x-y plane - : Limiting stress
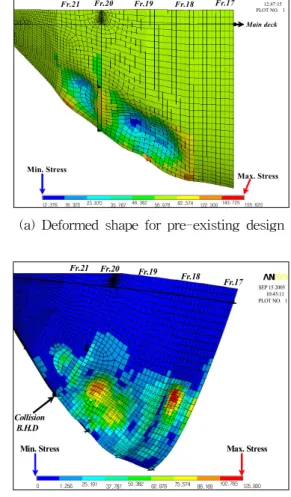
Fig. 7(a) shows the total deformed shape of pre-existing bow structure subjected to combined slamming and panting loads. The side shell and bottom plating takes place a large deflection on both sides based on the collision BHD at frame number 20. The maximum stress is being observed at the bottom shell plating after frame 20. At that time, large deflection takes place at side shell plating due to applied the impact loads. The minimum equivalent stress occurs at adjacent place between side plate and transverse web frame as indicated in Fig. 7(a).
Fig. 7(b) shows the equivalent stress and total deformation results to be considering optimum model. This result shows stress distribution after frame space number 20 under local impact load. In comparisons of pre-existing model with optimum model obviously appeared different results such as deflection shape, spreading of equivalent stress on the external plating against same loading as shown in Fig. 7(a, b), respectively.
155.620 12.376 18.320 23.870 35.787 48.382 56.978 82.574 122.300143.725
Max. Stress Min. Stress
Fr.20 Fr.19 Fr.18 Fr.17
Fr.21
Main deck AUG 22 2005
12:47:15 PLOT NO. 1
(a) Deformed shape for pre-existing design
125.800 0 1.256 25.191 37.787 50.382 62.978 75.574 88.169 100.765
Max. Stress Min. Stress
Collision B.H.D
Fr.17 Fr.18 Fr.19 Fr.20 Fr.21
SEP 15 2005 10:43:11 PLOT NO. 1
(b) Equivalent stress for optimum design Fig. 7 Finite element analysis for optimum design
In case of applied the dynamic pressure, equivalent stress is mainly observed on the side shell plating below draft line.
However, this stress level can be ignored comparing LR criterion as shown in Fig. 8. When consideration of isolated impact load, maximum equivalent stress takes place around centre girder and bottom plating in optimum bow structure.
Shear stress
Equivalent stress Equivalent stress
min max min max
min
max
min max
max