47 http://dx.doi.org/10.7850/jkso.2013.18.1.47
Free Access [Note]
HPLC-RTS (high performance liquid chromatography-retention time shift) 를 이용한 암모늄 이온의 안정동위원소 측정방법의 개선
안순모*·이지영·WAYNE S. GARDNER1 부산대학교 해양학과
1The University of Texas Marine Science Institute, Port Aransas, Texas, USA
Stable Isotope Measurement of Ammonium Using HPLC-RTS (high perfor- mance liquid chromatography-retention time shift)
SOONMO AN*, JIYOUNG LEE, AND WAYNE S. GARDNER1
Department of Oceanography, Pusan National University, Busan, Korea
1The University of Texas Marine Science Institute, Port Aransas, Texas, USA
생태계 질소 순환 연구에서 동위원소 추적자를 이용한 실험은 그 유용성에도 불구하고, 무기 질소의 안정동위원소 측정이 어려워 자료의 생산이 활발하지 못한 형편이다. Gardner et al. (1996)은 HPLC (high performance liquid chromatography)를 이용하여 비교적 간편하고 정밀하게 암모늄의 동위원소 비를 측정하는 방법을 개발해 질소순환 연구에 활발하게 활용하였다. 그러나 일반적이지 않은 syringe 펌프가 필요해 다른 실험실에 이 시스템이 도입되지 는 못하였다. 본 연구에서는 최신 HPLC 펌프 기술을 활용하여 Dr. Gardner 그룹 이후 최초로 암모늄 동위원소비 측정 시스템을 구축하였다. 표준시료 측정 결과 RTS (retention time shift)는 안정동위원소 비와 좋은 상관관계를 보였다. 이 시스템은 측정 자료를 디지털 형태로 변환하는 장치까지 갖추어 컴퓨터 프로그램을 이용한 다양한 자료 처리가 가능하다. 특히 Matlab®이용하여 retention time 계산에 peak 면적을 이용함으로써 측정의 정확성을 높이고, 직선 성을 향상할 수 있었다. 영산강 하구 해수를 가지고 실시한 15N-암모늄 첨가 실험에서 15N/14N 비율 변화를 HPLC-RTS법을 통해 측정하였으며, 식물성 플랑크톤에 의한 암모늄 섭취와 재광물화 과정을 각각 독립적으로 측정하는 것이 가능했다.
Despite the usefulness of nitrogen isotope tracer experiments in nitrogen cycling studies, there are not such many measurement data mainly due to the difficulties in analytical methods. Although Gardner et al. (1996) developed a relatively simple and accurate method that can measure ammonium isotope using HPLC and used it widely in various N dynamics studies, the technique was not adopted to other laboratories. An HPLC-RTS sys- tem using updated HPLC pumps that can perform the same measurements as that of Gardner et al. (1996) was built. The result of standard sample showed linear increase of RTS with the 15N proportions. Centroid retention times calculated with Matlab® program enhanced the linearity of the response. In a sea water incubation experi- ment spiked with 15NH4+, the uptake and regeneration of ammonium could be separately estimated using the temporal change of 15N/14N.
Key words: ammonium isotope, HPLC, retention time shift, nitrogen cycling
서 론
질소는 생체의 주요 성분으로 인산과 더불어 일차생산을 제한 하는 영양염으로서 생태계 생산성을 좌우하고 있다. 최근 들어 연 안을 비롯한 여러 수환경내에서 질소성분의 변환 및 순환과정에
대한 관심이 높아지고 있는데, 이는 비료 사용으로 인한 질소성분 과다 유입이 주요 원인이라 할 수 있다(Paerl and Huisman, 2009).
질소비료의 산업적 생산은 농업생산성을 비약적으로 높였다. 그러 나 동시에, 강, 호수, 연안 등 수환경의 무기질소 농도를 높여 유 해성 조류 대발생(HAB; harmful algal bloom)이나 무산소층 형성 (hypoxia)등 부영양화(eutrophication)와 관련된 환경 문제를 일으키고 있다(Boesch et al., 2009; Paerl and Huisman, 2009).
Received February 4, 2013; Revised February 12, 2013; Accepted February 12, 2013
*Corresponding author: [email protected]
수환경 내에 있는 질소가 생태계에 미치는 영향을 파악하기 위 해서는 무기질소와 유기질소의 순환과정을 자세히 살피는 것이 필 요하다. 일반적으로 수환경내에 존재하는 다양한 형태의 무기질소 (암모늄(NH4+), 질산(NO3-), 아질산(NO2-), 질소가스(N2), 이산화질 소(N2O))나 유기질소 농도의 정량 자료를 확보하는 것이 질소순 환연구의 기본이다. 그러나 농도만 측정하면 각 질소성분의 역동 적인 측면을 간과하기 쉬운데, 다양한 질소 성분은 생성(source)과 소 비(sink) 과정이 동시에 일어나며, 특정 시점의 무기 질소 농도는 동 적 평형(dynamic equilibrium)상태의 결과물일 뿐 그 평형상태를 일 으킨 source와 sink의 크기를 반영하지는 못한다(Fuhrman, 1987;
Lin et al., 2011). 이를 극복하기 위해서 질소의 안정동위원소 추 적자(15N)를 이용하여 각 과정을 측정하는 실험방법이 발달하였다 (Dugdale and Goering, 1967; Blackburn, 1979; Caperon et al., 1979;
Lin et al., 2011). 이들 실험에서는 무기질소(N2 가스, NH4+, NO3-, NO2-) 및 유기질소(용존 및 입자 형태) 성분에 존재하는 15N을 추 적자로 사용하여 시간에 따라 질소의 형태가 변하는 속도를 측정 하게 된다. 최근 들어 장비 및 기술의 발달에 따라 각 형태별로 질 소 안정동위원소 측정이 점점 일반화되고 있으나, 성분에 따라 측 정 난이도가 매우 다르다. 예를 들어, 입자성 유기질소의 경우 CHN-MS (carbon hydrogen nitrogen-mass spectrometer) 원소분 석기(elemental analyzer)가 널리 보급되면서 비교적 쉽게 측정이 가능하게 되었다. Membrane Inlet Mass Spectrometry (MIMS)를 이용해 용존 질소가스의 안정동위원소(29N2, 30N2)를 측정하는 기 술도 최근 들어 비약적으로 발달하였다(Kana et al., 1994; An et al., 2001). 그러나 NH4+, NO3-, NO2- 내의 안정동위원소를 측정하 는 것은 아직도 매우 힘든 편이다. 이중에서도 NH4+의 질소동위 원소 측정은 그 중요성에도 불구하고, IRMS (isotope ratio mass spectrometer) 처럼 고가의 장비가 필요하고 측정에 필요한 시료의 양이 많을 뿐만 아니라, 측정과정이 어려워 관련 실험이 많이 이 루어지지 못하고 있다(Sigman, 2001; Brandes et al., 2007). 최근 들어 해양환경에서 DNRA (dissimilatory nitrate reduction to ammonium) 나 ANAMMOX (anaerobic ammonium oxidation)와 같은 질소변환 과정이 새롭게 발견되거나 그 중요성이 재평가 받음으로써 암모 늄 안정동위원소 측정의 필요성은 점차 증가하고 있다(Brandes et al., 2007; Thamdrup, 2012).
Gardner et al. (1996)은 HPLC (high performance liquid chroma- tography)를 이용하여 암모늄 이온의 질소동위원소 비율을 측정하는 방법을 개발하였다. 이 방법은 높은 pH 조건에서 15NH4+의 이온 교환 칼럼 통과 속도가 14NH4+보다 느린 원리를 이용한다(Tanaka et al., 1989; Gardner et al., 1996). 이러한 속도 차이가 두 이온의 peak를 완전하게 분리하지는 못하지만, 동위원소 비율에 따른 peak 출현 시간 변화(retention time shift)를 이용하여 암모늄 이온의 동 위원소 비율을 측정하는 것이 가능하였다(Gardner et al., 1996).
이 방법은 수층과 퇴적층에서 일어나는 암모늄 관련 질소 변환과 정(암모늄 동화(assimilation), 유기물의 무기물화(ammonification), 질산화(nitrification 등)의 측정을 위해 활발하게 사용되었다(Heath et al., 1995; Gardner et al., 1996, 2000, 2004, 2006; An and Gardner, 2002; Lavrentyev et al., 2004; McCarthy et al., 2007a, 2007b; Gardner and McCarthy, 2009; Carini et al., 2010; James et al., 2011; Paerl et al., 2011; Hou et al., 2012; Smyth et al., 2013). 그러나 Dr Gardner
그룹 이외에 다른 실험실에서는 이 장비를 사용하지 못했는데, 주요 원인은 이 시스템에 사용되는 이동상(mobile phase)에 pulse가 없고 매우 안정적인 HPLC 조건을 유지할 수 있는 고가의 syringe pump가 필요했기 때문이다(Gardner et al., 1996). 최근 HPLC 펌프 기술의 발달, 특히 micro-volume plunger를 채택한 제품이 출시되어 펄스를 최 소화하는 기술(pulseless)이 일반화되었다. 본 연구에서는 Shimadzu 사의 micro-volume plunger 펌프(LC-10AS)와 형광검출기(RF- 10A)를 이용하여 Gardner et al. (1996)이 암모늄 안정동위원소 측 정방법이 개발한 후 17년만에 최초로 새로운 암모늄 안정동위원 소 측정 HPLC 시스템을 구축하였다. Syringe 펌프의 경우 일정 량(보통 260 ml)의 시약을 미리 충전하여 사용하기 때문에 한번에 약 12개의 시료만 측정할 수 있으나, Shimadzu 펌프의 경우 이러한 제약이 없다. 특히 이 연구에서 구축한 시스템은 Gardner et al.
(1996)의 방법과 달리 측정 자료를 디지털 형태로 확보할 수 있어 추후 다양한 형태의 자료 처리가 가능하다. 이렇게 구축한 시스템의 성능을 점검하기 위하여 영산강 하구에서 해수 배양 실험을 실시 하였다. 해수에 15NH4+를첨가한 후 시간에 따라 암모늄의 15N/14N 비율 변화를 측정하여 식물성 플랑크톤의 섭취와 재생산을 각각 추정하였다.
HPLC-RTS 시스템 구성
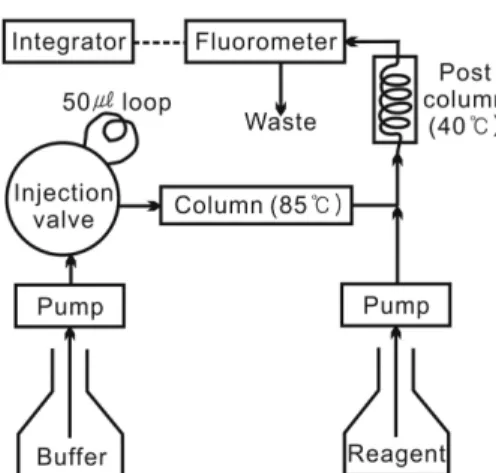
HPLC-RTS 시스템은 2대의 정량 펌프(Shimadzu LC-10AT, LC- 10AS), 오토 샘플러(Shimadzu SIL-10A), 시스템 컨트롤러(Shimadzu SCL-10A), 형광 검출기(Shimadzu RF-10A), 칼럼오븐(Waters CHM), 이온칼럼 등으로 구성된다(Fig. 1). 이 시스템에 사용한 이 온칼럼 충전재는 양이온 교환 레이진(5 um 구형 sulfonic acid; St.
John Associates)이며, 이온컬럼 전체 길이는 30 cm, 내경은 4 mm이 다(Gardner et al., 1996). 형광검출기에서 사용된 여기(excitation) 파장은 356 nm 이고, 방출(emission) 파장은 482 nm이다. 이동상 (mobile phase)으로 사용한 버퍼는 다음과 같이 준비하였다. 1리터 의 증류수에 12 g의 boric acid와 12 g의 NaCl, 0.8 g disodium ethylenediaminetetraacetic를 첨가한 후 NaOH로 pH를 조정하였 다. 이때 펌프 윤활유로 0.5 ml의 Brij 35를 첨가하였다. 버퍼는 섭씨 85도로 유지되는 칼럼을 분당 0.17ml의 속도로 통과한 후 OPA(o-phthalaldehyde) 시약과 섞이면서 발색한다. OPA 시약은
Fig. 1. Schematic diagram of the HPLC system for ammonium iso- tope analysis.
다음과 같이 마련하였다. 증류수 1리터에 boric acid 30 g을 첨가 하고, KOH를 이용하여 pH를 7로 조절한 후 10 ml의 메탄올과 0.5 ml 2-mercaptoethanol에 녹인 OPA를 섞었다. OPA와 버퍼를 합친 후 형광검출기로 들어가기 전에 섭씨 40도로 유지되는 약 1 m 길이 의 post column을 통과할 때 시료의 발색이 일어나게 된다(Gardner et al., 1996). 형광신호의 세기는 DA(digital analog) converter (dsChrome; DS Science inc.)를 거쳐 디지털 자료로 변환되었으며 , dsChrome-I (DS Science inc.) 소프트웨어를 이용하여 정량화하 였다.
크로마토그램(chromatogram)
시료의 RTS(retention time shift)는 자연상태의 안정동위원소비 (15N/14N=0.00365)만으로 이루어진 표준시료의 retention time과 측 정하고자 하는 시료의 retention time을 비교함으로써 측정한다. 자 연상태의 안정동위원소 비를 가진 4 µM의 내부 표준시료(internal standard)를 injection 한 후 정확히 7분 후에 측정시료를 injection 하였다. 이때 15N의 비율에 따라 이온 칼럼을 통과하는 속도가 달 라지기 때문에 내부 표준시료와 측정시료 사이에 7분 이상의 retention time이 나타나게 되며, 이를 정량화하여 안정동위원소의 비율을 구하였다. 본 분석에서 얻은 전형적인 크로마토그램은 Fig.
2와 같다. 약 15~23분 사이에 아미노산의 peak가 나타나며, 40 분 경에 표준시료의 암모늄 peak가 나타나고, 47분 이후에 시료의 peak가 나타난다(Fig. 2). 따라서, 한 시료의 분석에는 2번의 injection이 필요하며, 약 1시간의 분석시간이 필요하다. 한 개의 측정자료를 얻기 위해서는 3번의 반복 측정을 수행하며, 24시간 동안 약 8개의 측정자료를 분석하는 것이 가능하다(Gardner et al., 1996). 자동 시료 주입기를 이용하므로 시간은 오래 걸리지만 분 석은 용이한 편이다. 그러나 장시간 분석에서 시료의 오염과 변질 에 주의해야 한다.
RTS(retention time shift) 표준시료 분석
암모늄 농도에 따른 peak 면적 증가를 2~20 µM 농도의 표준 시료 분석을 통해 알아본 결과, 농도와 peak 면적은 선형 관계를 보였다(Fig. 3. R2>0.99). 안정동위원소비에 따른 RTS의 변화를 알 아보기 위하여 15N의 비율을 임의로 조성한 표준시료를 준비한 다음
이들 시료의 RTS를 측정하였다(Fig. 4). Gardner et al. (1996)은 암모늄 peak에서 형광 신호의 강도가 가장 강한 시점을 retention time으로 간주하는 것 보다는 전체 peak 면적의 절반에 해당하는 면적이 나타나는 시점(ctR; centroid retention time)을 retention time으로 잡았을 때 RTS와 15N 의 비율 사이에 좀 더 선형적 관계가 나타나는 것을 관찰하였다. 이에 따라 이들은 ctR 계산을 위하여 다음 식을 제안하였다.
(1)
여기에서 t=시각, I(t)=각 시각에서 신호의 세기, area=전체 peak의 면적을 나타낸다.
RTS 표준시료 분석에서는 dsChrome-I 프로그램이 제시하는 retention time (pRT; peak retention time; 형광 신호의 강도가 가장 강한 시점)과 함께 ctR을 구하여 비교하였다. ctR을 구하기 위해 HPLC의 디지털 분석 자료를 Matlab®프로그램을 이용하여 자료 변환 및 계산을 수행하였다. Matlab®프로그램에서 ctR을 계산할
ctR=∑tI t( )dt/area
Fig. 2. Chromatogram showing the separation of ammonium from amino acids. Peaks for internal standard and sample are indicated.
Fig. 3. Relationship between ammonium ion concentration (uM) and peak area in the HPLC-RTS system developed in this study.
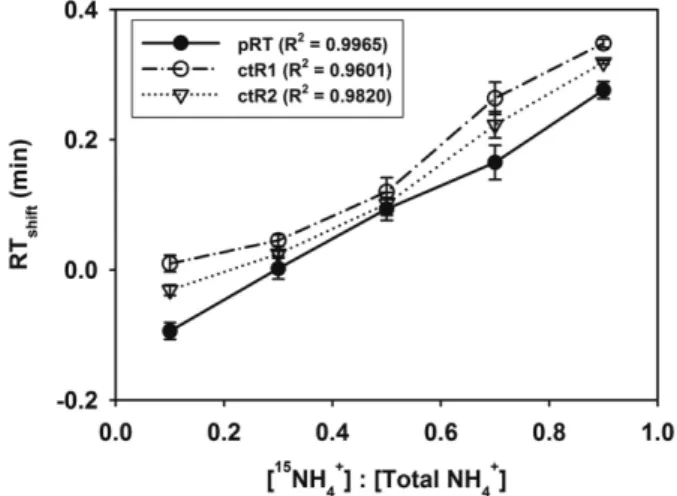
Fig. 4. RTS (min.) in different proportions of 15NH4+ in the total ammonium concentration. Centroid retention times (ctR) calculated in two different ways (ctR1, ctR2) are compared with the peak retention time (pRT) (see text for details).
때 두 가지 방법을 사용하였다. 첫 번째는 식 1을 이용하여 각 시 각에서 시각과 신호세기를 곱한 값을 전체 peak에서 적분한 다음 전체 peak 면적으로 나누어 구하였다(ctR1). 두 번째 방법은 특정 피크의 전체 면적을 구한 후에, 그 면적의 절반에 해당하는 시각을 찾는 루틴을 Matlab®을 통해 구현한 다음 ctR을 구하였다(ctR2).
Fig. 4에서 pRT, ctR1, ctR2를 비교하였다. 표준시료의 암모늄 내
15N/14N의 비율은 0.1, 0.3, 0.5, 0.7, 0.9를 사용하였으며, 각 시료는 3번 반복 측정하였다. 각 시료의 RTS는 -0.1~0.3분으로, 15NH4+ 90% 시료에서 자연상태의 안정동위원소를 갖는 시료에 비하여 약 24초의 RTS가 발생하였다(Fig. 4) 각 측정값 사이의 SE (standard error)는 0.3~2.6% 이내로, Gardner et al. (1996)의 결과와 유사하 였다. Gardner et al. (1996)의 시스템에서는 pRT의 경우 15N 비 율이 낮거나(30% 이하) 높을(70% 이상) 때 RTS 증가율이 낮아 전체적으로 동위원소 비율과 RTS가 S자 모양을 띠는 경향이 있 으며, ctR을 사용할 때 더 선형적인 관계를 보여주었다. 그러나 본 실험에서는 Gardner et al. (1996)과 달리 pRT의 직선성도 상당히 좋은 편이어서 S자 모양 왜곡은 나타나지 않았다. 오히려 식 1을 이용하여 ctR1을 구하면 SE는 약간 줄어 들고 RTS값에 음수가 없어지는 긍정적인 효과가 나타난 반면, 전반적인 직선성이 낮아져 동위원소 비율과 RTS사이의 관계가 S모양으로 왜곡되는 경향이 나타났다(Fig. 4). 이에 반해 두 번째 방법으로 구한 ctR (ctR2)에 서는 SE가 줄어들었을 뿐만 아니라 직선성도 증가하여 이 방법이 centroid retention time 계산에 더 적합하였다.
해수 배양시 암모늄의 15N/14N 변화
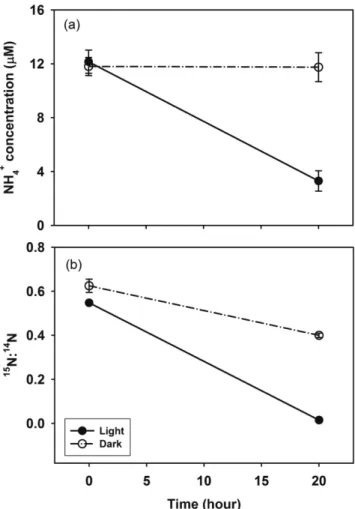
이 연구에서 구축한 HPLC-RTS 시스템을 이용하여 영산강 하 구의 해수 배양 실험에서 얻은 시료의 암모늄 동위원소 비를 측 정하였다. 2012년 8월 10일 영산강 하구둑 인근 정점에서 약 1리 터의 표층 해수를 채취한 후, 15NH4+를 주입하여 전체 최종 농도 가 12 µM이 되도록 하였다. 이를 빛이 통과하는 유리병(명배양) 과 통과하지 못하는 배양용기(암배양)에 담은 후 표층에 띄워 20 시간 동안 현장 배양하였다. 그런 다음 배양액을 GF/F로 여과하 여 배양 전후의 암모늄 농도와 안정동위원소 비의 변화를 측정하 였다(Fig. 5). 예상했던 바와 마찬가지로 광합성이 허용된 명배양 에서는 20시간 후 약 8 µM의 암모늄이 감소한 반면, 암배양에서는 암모늄이 감소하지 않았다(Fig. 5a). 동위원소비의 변화 측정 결과 를 통해 암배양에서 암모늄 농도가 감소하지 않는 이유는 암모늄 섭취가 없었기 때문이 아니라 섭취와 재생산이 거의 같은 크기로 일어났기 때문임을 알 수 있었다. 즉 암배양과 명배양 모두 15N의 비율이 감소하여 재생산이 활발하게 일어남을 시사하였다(Fig. 5b).
암모늄 농도 변화와 안정동위원소비 변화를 통해 식물성 플랑 크톤의 암모늄 섭취와 재생산율을 추정하였다. 각 항목의 추정식 은 다음과 같다(Blackburn, 1979).
(2) (3)
여기에서 P0=초기 NH4+ 농도, p(t)=시간 t의 NH4+ 농도, d=재생산 속도, i=섭취속도, R0=초기 15N 비율, R(t)=시간 t의 15N 비율, 15n=
자연상태의 15N 비율(0.365%)을 나타낸다.
명배양에서는 암모늄 섭취가 활발하여 시간당 약 1.6 µM이 감 소하였지만, 암배양에서는 섭취속도가 명배양 보다 절반 정도로 줄어들었다(Fig. 6). 재생산의 경우도 암배양보다 명배양에서 높은 값을 보였는데, 속도가 시간당 1.2 µM에 달하였다. 이처럼 source와 sink 과정이 동시에 일어나는 경우 단순히 암모늄 농도만 측정해 P t( ) P= 0+(d i–)t
Ln R t[ ( )–15n] Ln R0( –15n) d d i– ( ) --- LnP t( )
---P0 –
=
Fig. 5. Changes in (a) ammonium concentration and (b) 15N pro- portions in the ammonium ion over time in seawater incubation experiments with water samples of the Youngsan River Estuary.
Fig. 6. Ammonium uptake and regeneration rates during incubation experiments with seawater samples of the Yeongsan River Estuary.
서는 각 과정의 크기를 파악할 수 없다. 따라서 본 실험과 같이 동 위원소 추적자를 이용한 배양실험을 통해 각 과정의 상대적인 중 요성을 정량화하는 것이 필요하다.
결 론
최근에 성능이 개선된 HPLC 펌프를 이용하여 암모늄의 동위원 소비를 측정할 수 있는 시스템을 구축하였다. Syringe pump를 이 용하지 않아 시스템 구축비용을 줄였으며, 한번에 측정할 수 있는 시료 수 한계를 없애는 등의 개선을 이루었다. Matlab 프로그램을 이용하여 자료를 처리하였으며, 이를 통해 retention time 계산 과 정도 개선할 수 있었다. 측정 자료가 디지털 형태로 되어 있기 때 문에 향후 다양한 retention time 계산법을 시도하는 것이 가능할 것이며, 이를 통해 RTS를 더 정밀하게 계산할 수 있을 것으로 판 단한다.
사 사
이 논문은 부산대학교 자유과제 학술연구비(2년)에 의하여 연구 되었습니다. 건설적인 방향으로 심사를 해주신 강동진 박사와 강 대석 박사께 감사 드립니다.
참고문헌(References)
An, S. and W.S. Gardner, 2002. Dissimilatory nitrate reduction to ammonium (DNRA) as a nitrogen link, versus denitrification as a sink in a shallow estuary (Laguna Madre/Baffin Bay, Texas).
Mar. Ecol. Prog. Ser., 237: 41−50.
An, S., W.S. Gardner and T. Kana, 2001. Simultaneous measurement of denitrification and nitrogen fixation using isotope pairing with membrane inlet mass spectrometry analysis. Appl. Environ. Micro- biol., 67: 1171−1178.
Blackburn, T.H., 1979. Method for measuring rates of NH4+ turnover in anoxic marine sediments using a 15N-NH4+ dilution technique.
Appl. Environ. Microbiol., 37: 760−765.
Boesch, D.F., W.R. Boynton, L.B. Crowder, R.J. Diaz, R.W. Howarth, L.D. Mee, S.W. Nixon, N.N. Rabalais, R. Rosenberg, J.G. Sand- ers, D. Scavia and R.E. Turner, 2009. Nutrient enrichment drives Gulf of Mexico hypoxia. EOS, 90: 117−119.
Brandes, J.A., A.H. Devol and C. Deutsch, 2007. New developments in the marine nitrogen cycle. Chem. Rev., 107: 577−589.
Caperon, J., D. Schell, J. Hirota and E. Laws, 1979. Ammonium excretion rates in Kaneohe Bay, Hawaii; Measurement by a 15N iso- tope dilution technique. Mar. Biol., 54: 34−40.
Carini, S.A., M.J. McCarthy and W.S. Gardner, 2010. An Isotope dilution method to measure nitrification rates in the northern Gulf of Mexico and other eutrophic waters. Cont. Shelf Res., 30: 1795−
1801.
Dugdale, R.C. and J.J. Goering, 1967. Uptake of new and regener- ated forms of nitrogen in primary productivity. Contribution #6 from the Institute of Marine Science, 6: 196−206.
Fuhrman, J., 1987. Close Coupling between Release and Uptake of Dissolved Free Amino-Acids in Seawater Studied by an Isotope-
Dilution Approach. Mar. Ecol. Prog. Ser., 37: 45−52.
Gardner, W.S., P.A. St. John, C. Evans and J. Cavaletto,1996. HPLC retention-time-shift determination of nitrogen isotope ratios in enriched water. Am. Lab., (Distinguished Authors’ Issue) 28: 17C−17H.
Gardner, W.S., P.J. Lavrentyev, H.A. Bootsma, J.F. Cavaletto, F. Troncone and J.B. Cotner., 2000. Effects of natural light on nitrogen dynamics in diverse aquatic environments. Proceedings International Asso- ciation of Theoretical and Applied Limnology, 27: 64−73.
Gardner, W.S., P.J. Lavrentyev, J.F. Cavaletto, M.J. McCarthy, B.J.
Eadie, T.H. Johengen and J.B. Cotner., 2004. The distribution and dynamics of nitrogen and microbial plankton in southern Lake Michigan during spring transition 1999-2000. J. Geophys. Res., 109: 1−16.
Gardner, W.S., M.J McCarthy, S., An, D. Sobolev, K.S. Sell and D.
Brock, 2006. Nitrogen fixation and dissimilatory nitrate reduction to ammonium (DNRA) support nitrogen dynamics in Texas estu- aries. Limnol. Oceanogr., (Special issue on Eutrophication) 51:
558−568.
Gardner, W.S. and M.J. McCarthy, 2009. Nitrogen dynamics at the sediment–water interface in shallow, sub-tropical Florida Bay: why denitrification efficiency may decrease with increased eutrophi- cation. Biogeochemistry, 95: 185−198.
Heath, R.T., G.L. Fahnenstiel, W.S. Gardner, J.F. Cavaletto and Soon- Jin Hwang, 1995. Ecosystem-level effects of zebra mussels (Dre- issena polymorpha): An Enclosure Experiment in Saginaw Bay, Lake Huron. J. Great Lakes Res., 21: 501−516.
Hou, L.M., Lou, S.A. Carini and W.S. Gardner, 2012. Transformation and fate of nitrate near the sediment–water interface of Copano Bay.
Cont. Shelf Res., 35: 86–94.
James, T.J., W.S. Gardner, M.J. McCarthy and S.A. Carini, 2011.
Nitrogen dynamics in Lake Okeechobee: forms, functions, and changes.
Hydrobiologia 669: 199–212.
Kana, T.M., C. Darkangelo, M.D. Hunt, J.B. Oldham, G.E. Bennett and J.C. Cornwell, 1994. Membrane inlet mass spectrometer for rapid high-precision determination of N2, O2, and Ar in environ- mental water samples. Anal. Chem., 66: 4166−4170.
Lavrentyev, P.J., M.J. McCarthy, D.M. Klarer, F.J. Jochem and W.S.
Gardner, 2004. Microbial food web and nitrogen dynamics in a storm-driven LAKE ERIE wetland. Microbial Ecol., 48: 567−577.
Lin, Xiao, M.J. McCarthy, S.A. Carini and W.S. Gardner, 2011. Net, actual, and potential sediment-water interface NH4+ fluxes in the northern Gulf of Mexico (NGOMEX): Evidence for NH4+ limi- tation of microbial dynamics. Cont. Shelf Res., 31: 120−128.
McCarthy, M.J., W.S. Gardner, P.J Lavrentyev, K.M. Moats, F.J.
Jochem and D.M. Klarer, 2007a. Effects of hydrological flow regime on sediment-water interface and water column nitrogen dynamics in a Great Lakes coastal wetland (Old Woman Creek, Lake Erie), J. Great Lakes Res., 33: 219−231.
McCarthy, M.J., P.L. Lavrentyev, L. Yang, L. Zhang, Y. Chen, B. Qin and W.S. Gardner, 2007b. Nitrogen dynamics relative to microbial food web structure in a subtropical, shallow, well-mixed, eutrophic lake (Taihu Lake, China). Hydrobiologia (Special issue on Lake Taihu), 581: 195−207.
Paerl, H.W., Hai Xu, M.J. McCarthy, G. Zhu, B. Qin, Y. Li and W.S.
Gardner, 2011. Controlling harmful cyanobacterial blooms in a hyper-eutrophic lake (Lake Taihu, China): The need for a dual
nutrient (N & P) management strategy. Water Res., 45: 1973−1983.
Paerl, H.W. and J. Huisman, 2009. Climate change: a catalyst for global expansion of harmful cyanobacterial blooms. Env Micro- biol Reports, 1: 27−37.
Sigman, D.M., K.L. Casciotti, M. Andreani, C. Barford, M. Galanter and J.K. Bohlke, 2001. A bacterial method for the nitrogen iso- topic analysis of nitrate in seawater and freshwater. Anal. Chem., 73: 4145−4153.
Smyth, A.R., S.P. Thompson, K.N. Siporin, W.S. Gardner, M.J. McCarthy and M.F. Piehler, 2013. Assessing nitrogen dynamics throughout the estuarine landscape. Estuar. Coast., 36: 44−55.
Tanaka, N., K. Hosoya, K. Nomura, T. Yoshimura, T. Ohki, R. Yan- maoka, K. Kimata and M. Araki, 1989. Separation of nitrogen and oxygen isotopes by liquid chromatography. Nature, 341: 727−728.
Thamdrup, B., 2012. New Pathways and Processes in the Global Nitrogen Cycle Annu. Rev. Ecol. Evol. Syst., 43: 407−428.
2013년 2월 4일 원고접수 2013년 2월 12일 수정본 접수 2013년 2월 12일 수정본 채택 담당편집위원: 최만식