• 검색 결과가 없습니다.

Fundamental Considerations: Impact of Sensor Characteristics, Application Environments in Wireless Sensor Networks

N/A
N/A
Protected

Academic year: 2021

Share "Fundamental Considerations: Impact of Sensor Characteristics, Application Environments in Wireless Sensor Networks"

Copied!
17
0
0

로드 중.... (전체 텍스트 보기)

전체 글

(1)

Fundamental Considerations: Impact of Sensor Characteristics, Application Environments

in Wireless Sensor Networks

Dongmin Choi

, Ilyong Chung

††

ABSTRACT

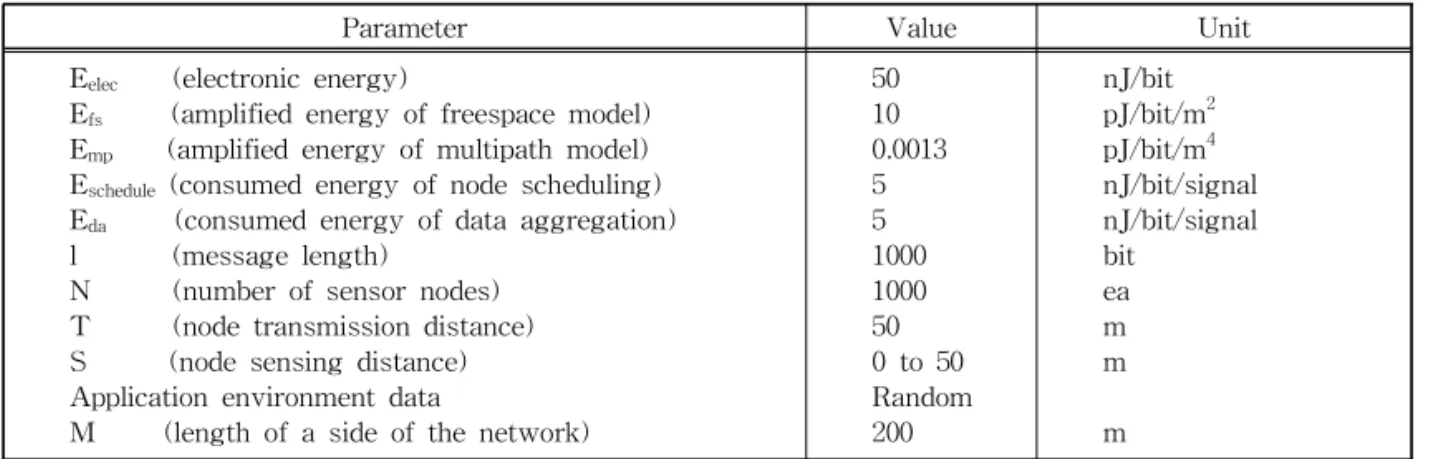
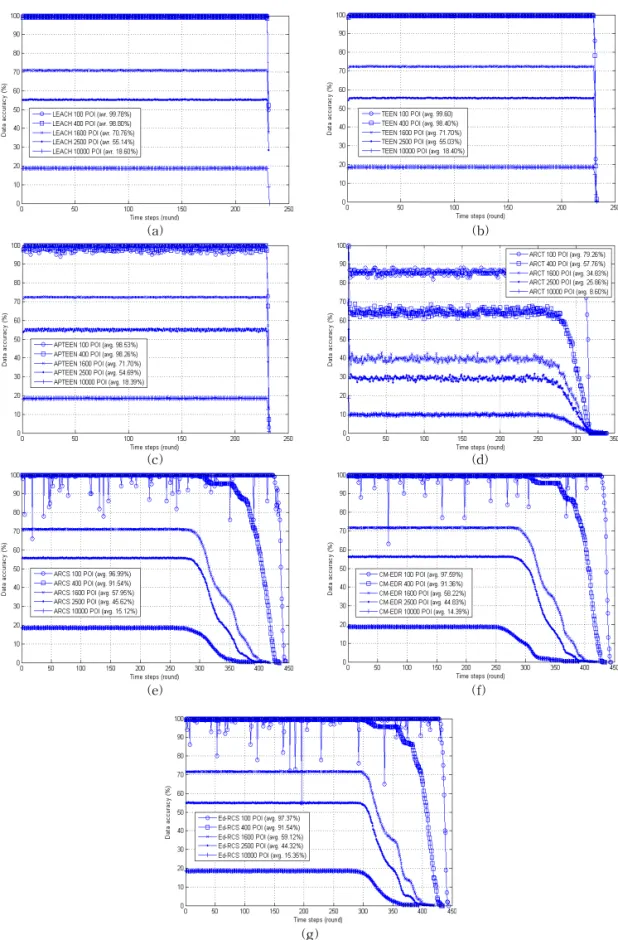
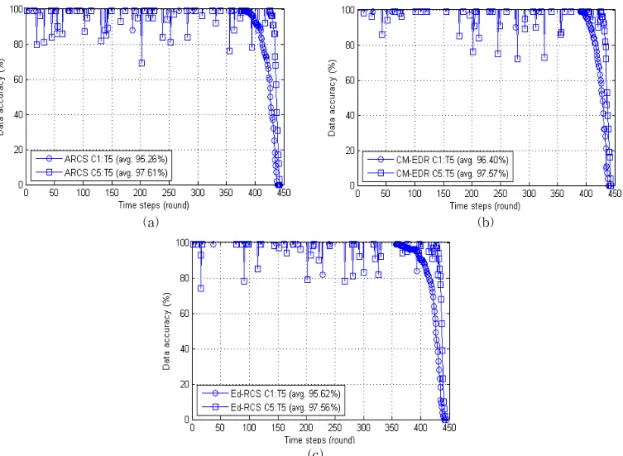
Observed from the recent performance evaluation of clustering schemes in wireless sensor networks, we found that most of them did not consider various sensor characteristics and its application environment. Without considering these, the performance evaluation results are difficult to be trusted because these networks are application-specific. In this paper, for the fair evaluation, we measured several clustering scheme’s performance variations in accordance with sensor data pattern, number of sensors per node, density of points of interest (data density) and sensor coverage. According to the experiment result, we can conclude that clustering methods are easily influenced by POI variation. Network lifetime and data accuracy are also slightly influenced by sensor coverage and number of sensors. Therefore, in the case of the clustering scheme that did not consider various conditions, fair evaluation cannot be expected.

Key words: Performance Evaluation of Sensor Network, Sensor Characteristics, Application Environment of Sensor Network

※ Corresponding Author : Ilyong Chung, Address : (501- 759) Chosun Univ., Seoseok-dong, Dong-gu, Gwangju, Korea, TEL : +82--62-230-7712, FAX : +82-62-230- 7754 , E-mail : [email protected]

Receipt date : Dec. 31, 2013, Revision date : Feb. 6, 2014 Approval date : Mar. 19, 2014

††

Division of Undeclared Majors, Chosun University [email protected]

††

Department of Computer Engineering, Chosun University

※ This study was supported (in part) by research funds from Chosun University, 2013.

※ An earlier version of this paper [20] was published as

“Impact of Sensor Data Patterns on Performance Evaluation of Clustering Schemes,” Sensor Letters, Vol. 11, 249–

258, 2013.

1. INTRODUCTION

In wireless sensor networks, sensor nodes are limited disposable battery driven devices [1].

Because of density of sensor data and location du- plication of sensor nodes in sensor field, sensor da- ta easily and frequently can be duplicated. Thus, in order to prevent unnecessary energy con- sumption, data redundancy avoidance technology

is required. In addition, most part to the energy consumption of the sensor node is caused by sens- ing, data processing, and communication activities [2,3]. According to the evaluation result, communi- cation cost was known to be higher than the others [4,5]. Therefore, most of the research papers are focused on communication cost reduction method to prolong the sensor network lifetime [6-8].

Generally, routing methods based on network structure are divided into two main groups named flat and hierarchical. Unlike flat based structure, hierarchical structure, using clustering scheme, has proven to have considerable savings in total energy consumption even though the energy con- sumption is concentrated on the cluster head node.

According to the previous research, energy con-

centration problem is can be relieved through the

periodic setup process. Consequently, clustering

scheme showed a much better lifetime in perform-

ance evaluation. Recently, several cluster based

methods uses sensor coverage in terms of cluster

(2)

Fig. 1. Clustering method classification.

formation and data transmission. In such a case, if the sensor coverage is wide, there is an advant- age where the number of sensor node required on the network is decreased. Therefore, the network lifetime is prolonged. In addition, some kind of methods uses the data comparison scheme, which can decide the data transmission activities in terms of cluster data transmission. In other words, every sensor node on the network can control the data flow through the data comparison scheme which can compare the sensor data value at the current time of the data value at the previous time.

Therefore, in the case of appropriate application environment such as the air-temperature collection of the arctic region, the network lifetime is ex- tremely prolonged. In this way, clustering method in wireless sensor networks showed that it was developed gradually. Nevertheless, most of the clustering methods did not consider about sensor network has particular characteristics in their per- formance evaluation. One of them is sensor char- acteristic, and the other one is application

environment. Therefore, the experimental results without considering particular characteristics, which are the elements affecting the sensor net- work operation are difficult to trust. In this work, by using several former clustering methods, we measured the network performance variation that was performed considering sensor characteristics and application environment. According to the per- formance evaluation result, sensor characteristics seem to influence network performance.

The remainder of this paper is organized as fol- lows: In section 2, we describe related works, also explain our measurements in section 3. In section 4, we compare data collection rate, network con- nection rate, energy balance, node isolation rate and network lifetime. Finally, we conclude the pa- per in Section 5.

2. RELATED WORKS

As shown in figure 1, for development of fair

evaluation methods, first we classified the cluster-

(3)

Fig. 2. Network lifetime comparison in accordance with the clustering method classification

ing methods in accordance with the data collection scheme. Clustering methods are categorized into three domains: data fusion, data fusion with area data redundancy, data fusion with area & time data redundancy. In data fusion clustering, actually that means hierarchical structure; sensor nodes send their data to the sink via intermediate nodes support. During the transmission of sensor data, intermediate nodes can control their burden to con- serve energy and to relieve network congestion.

Thus, the various schemes to control sensor data were proposed for energy-efficient network operation. As shown in figure 2, each domain shows their network lifetime graph as a showcase of energy conservation.

2.1 Data fusion clustering

LEACH (low-energy adaptive clustering hier- archy) [9] is a representative clustering method in sensor networks. In clustering process, cluster head node’s aggregate data from their in-cluster nodes. Then combine, retransmit to the Base sta- tion or sink in periodic time. According to the eval- uation assumption, did not consider sensor charac- teristics and application environment. Therefore, we assumed that this scheme can be applied in the various environments. In LEACH-C (low-energy adaptive cluster hierarchy centralized) [9], to solve the problem of repositioning cluster head nodes,

clusters are elected by a base station at every round. In this method, every sensor node sends the message which includes node’s position and re- sidual energy information to the base station. After that, base station broadcasts this information to all the nodes, which are deployed in the field help to form an adequate cluster. This scheme has no mention about sensor characteristics and applica- tion environment. Therefore, we assumed that this scheme can be applied in the various environments.

HEED (hybrid, energy-efficient distributed) [10]

requires some values of node’s residual energy for cluster formation and election. In this scheme, more residual node energy means more probabilities of being elected as a cluster header node. If candidate nodes have same residual energy, then their trans- mission costs are compared. In the case of assign- ing the complex calculations to the base station, BCDCP (base station controlled dynamic cluster- ing protocol) [11] is same as LEACH-C. This scheme is composed of two phases: setup and data communication. In cluster formation, base station elects candidate set of cluster head nodes to de- termine cluster head nodes. To fit the number of cluster head nodes, it uses a cluster splitting algo- rithm which divides the network continuously.

HEED and BCDCP did not mention about sensor characteristics and application environment.

Therefore, we assumed that these are can be ap-

plied in the various environments. Based on

LEACH, in TEEN (threshold sensitive energy-ef-

ficient sensor network protocol) [12] sensor nodes

manage threshold value. After cluster formation,

cluster head nodes transmit the data parameters,

HT (hard threshold value), and ST (soft threshold

value), to their member nodes. Then, every node

collects and transmits data when the value exceeds

the HT value first. After exceeding HT, data col-

lection and transmission perform only when the

measured data exceeds ST. APTEEN (A Hybrid

Protocol for Efficient Routing and Comprehensive

Information Retrieval in Wireless Sensor Net-

(4)

works) [13] is a hybrid protocol that unites the data transmission by the threshold value of TEEN and the periodic data transmission of LEACH. Even the collected data did not exceed threshold values; by periodic data transmission schedule, every node transmits collected data to the cluster head node.

According to their performance evaluation, TEEN and APTEEN assumed that simple temperature sensing application. Therefore, we assume that TEEN and APTEEN are application specific clus- tering schemes.

2.2 Area redundancy avoidance clustering ARCT (An Advanced Regional Clustering Scheme using Threshold dataset) [14] is a protocol based on the dynamic cluster that performs upon the ba- sis of the cluster and proactive network that trans- mits at the determined time. In addition, it uses threshold—similar as TEEN. Therefore, it can be categorized as a reactive network such as TEEN.

This scheme uses two types of clusters—the re- gional cluster and the normal cluster—. These two clusters have different ways to collect data. The regional cluster composes the cluster through the data comparison process which collected by ad- jacent nodes, and after that only the head node of the regional cluster acts and transmits the collected data. The normal cluster combines with the nodes that failed to participate in the regional cluster. All the nodes that composed this cluster participate in data collection. The nodes that participate in this cluster increase the energy efficiency using the threshold value table when collecting data. This scheme is based on air-temperature data collecting.

Therefore, this is an application specific clustering scheme.

ARCS (An Energy Efficient Clustering Scheme for Sensor Network Monitoring Systems) [15] is based on the basic concept of ARCT. In ARCS, ev- ery node that forms a cluster needs to consider two types of values. The first is its sensor value, and the second is its altitude. Furthermore, in order to

decrease the error rate during data collection, ARCS uses one more condition for a node to be included in a cluster. In order to achieve higher sensor data accuracy, ARCS considers the sensor coverage to form a cluster. According to the per- formance evaluation, ARCS support environmental monitoring. Therefore, this scheme can be applied in the various environments. EEDCF (Energy Efficient Deployment and Cluster Formation Scheme) [16] is a scheme based on the clusters which divide into predetermined grids. In addition, it uses two different types of nodes to form a cluster. One type of nodes has a higher energy and wider range compared to the other type of nodes.

This type is called S1 and the other type is S2.

They assumed that S1 type nodes have twice the energy and radius coverage compared to the S2 type nodes. S1 node which is positioned in the cen- tral of the cluster called CN, and this node is not active in the setup phase1. The other S1 nodes are performed as a role of the cluster head node for the first few rounds. After the energy of S1 nodes became almost as much as the energy of the S2 nodes, the S1 nodes stop becoming the CH. After then, the CN acts as a CH for the cluster in the setup phase2. All other nodes, including S1 nodes are treated as the S2 type node because they have similar energy to S2 nodes. In this paper, they did not mention about any other application environ- ment. Therefore, we assumed that this scheme can be applied in the various environments.

2.3 Time & area redundancy avoidance clustering

CM-EDR (Continuous-Monitoring Using Event

Driven Reporting) [17] is a scheme that each node

deals only with its local sensor data and does not

aggregate data from member nodes. Each sensor

node compares the current sensor data with the

last transmitted value to the sink. Data is only

transmitted when the value is changed with re-

spect to the data of the sink. This scheme is only

(5)

(a) (b)

Fig. 3. Sensor data density comparison in same target area. (a) 100 sensor data spot of 10m2 size, and (b) 10000 sensor data spot of 1m2 size.

for the continuous monitoring system. However, there is no restriction in sensor data collection.

Therefore, we assumed that this scheme can be applied in the various environments. Ed-RCS (An Energy-aware Event-driven Regional Clustering Scheme) [18] is a scheme that sensor node can pre- dict current data using data prediction graph and to minimize data transmission among the cluster head node and member nodes. Thus, energy-effi- cient data transmission is possible. According to the assumption, this scheme can be applied in the various environments. Furthermore, in the case of the scheme that is seeking resource conservation through intelligent processing, network perform- ance may be depended on sensor characteristics.

Thus, it is recommended that clustering schemes evaluate its performance in various environments for fair evaluation and comparison.

3. CONSIDERABLE CHARACTERISTICS As the considerable items for fair evaluation, we categorize these items into three domains: sensor data density& sensor coverage, sensor data pat- tern, multi-sensor data.

3.1 Sensor data density & sensor coverage The number of data collected in the same area can be expressed as the density. As shown in the

figure 3(a), a few sensor data are detected: that means low density. On the contrary, as shown in the figure 3(b), numerous sensor data is detected:

high density. Figure 3 shows comparison graph of detected sensor data in same size of sensor field.

For example, 1000 sensor nodes are uniformly de- ployed in 100m

2

of sensor field. To accomplish 100% of data detection, in the case of figure 3(a) 10m

2

of sensor data density, it must be guaranteed at least one sensor node deployed in each 10m

2

. Therefore, only 100 sensor nodes can support whole sensor field with no errors. However, to ac- complish 100% of data detection, in the case of fig- ure 3(b) 1m

2

of sensor data density, it must be guaranteed at least one sensor node deployed in each 1m

2

. Thus, tenfold more sensor nodes are required.

Therefore, we know that the density of sensor data can become the factor affecting on the sensor network operation and organization. In addition, as shown in figure 4, we assume that same sensor data is detected in the specific area of sensor field.

When the maximum sensor detection length r is extended as 2r, sensor node can cover 8 more neighbour sensor nodes. In other words, neighbour nodes do not need to activate their sensor to collect sensor data. Therefore, that means prolonged net- work lifetime.

According to the sensor data density and cover-

(6)

Fig. 4. Sensor coverage comparison.

Fig. 5. Periodic changing sensor data pattern.

age, we classified the existing several clustering methods into two categories: sensor coverage and non-sensor coverage consideration. Such as LEACH, TEEN, APTEEN and ARCT, belong to non-sensor coverage consideration, are called classic clustering method. These kinds of methods are based on sensor data processing within trans- mission range of sensor nodes. Thus, we assumed that sensor nodes of these networks acquire the sensor data from the coordinates of nodes.

Therefore, in order to compare the performance of these methods, we measured the network perform- ance in accordance with the sensor data density.

Considering the sensor coverage, such as ARCS, Ed-RCS and CM-EDR are called advanced, they form the cluster based on the sensor coverage.

Thus, pre-definition of the network application de- termines the network performance. Therefore, we measured the network performance in accordance with the sensor data density and sensor coverage for each case.

3.2 Sensor data pattern

Application specified sensor network have vari- ous sensor data patterns according to their specific environment. Therefore, we selected representative five data patterns. These data patterns appeared frequently in the application environment of the previous researches.

3.2.1 Periodic changing sensor data pattern Figure 5 shows periodic changing data pattern,

such as subway circulation or city bus route. In this case, the most important issue is: collecting sensor data with lower energy consumption while maintain high data accuracy.

3.2.2 Object tracking sensor data pattern Sensor network application used for object tracking is completely different from simple envi- ronmental monitoring. Many sensor nodes need to keep on collaborating with other nodes in order to track the moving target. In this case, the most im- portant issue is: tracking the target with lowest energy consumption while maintain the low miss- ing-rate. Figure 6 shows moving object and object sensing.

3.2.3 Air-temperature sensor data pattern

For the case of simple environmental monitor-

ing, we applied real air-temperature data. In the

case of air-temperature monitoring, sensor net-

work needed to maintain the network without data

(7)

Fig. 6. Target tracking sensor data pattern.

Fig. 7. Air-temperature sensor data pattern.

Fig. 8. Random sensor data pattern.

Fig. 9. None sensor data pattern.

loss. Figure 7 shows the air-temperature data pattern.

3.2.4 Random sensor data pattern

In the worst case, there is no relationship be- tween data and application environment. In this case, most of the routing schemes show an in- efficient result. Figure 8 shows randomly gen- erated sensor data pattern.

3.2.5 None sensor data pattern

In the case of disaster monitoring, the network may not sense any data for a long time. In this case, the most important issue is maintaining the network with low energy consumption. Further- more, sensor alarm message must be transferred without delay while maintain low error rate. Figure 9 shows none data pattern.

3.3 Multi sensor data

In normal case, sensor node hardware can sup- port multi-sensor module. However, most of the recent simulation results in research papers did not consider the multi-sensor data pattern. We assume that network performance will be influenced by the multi-sensor. According to the performance evalu- ation result, number of sensor module on the sen- sor node seems to have an effect on the network performance.

4. PERFORMANCE EVALUATION In this section, we present the experimental re- sults of clustering scheme in terms of data accu- racy, node participation rate for the network, node isolation rate, residual energy and network lifetime in accordance with the random or different sensor data patterns.

4.1 Network basic assumption

For the performance evaluation, we considered

(8)

Table 1. Simulation parameters

Parameter Value Unit

E

elec

(electronic energy)

E

fs

(amplified energy of freespace model) E

mp

(amplified energy of multipath model) E

schedule

(consumed energy of node scheduling) E

da

(consumed energy of data aggregation) l (message length)

N (number of sensor nodes) T (node transmission distance) S (node sensing distance) Application environment data

M (length of a side of the network)

50 10 0.0013 5 5 1000 1000 50 0 to 50 Random 200

nJ/bit pJ/bit/m

2

pJ/bit/m

4

nJ/bit/signal nJ/bit/signal bit

ea m m m

various environmental sensor data described before. Furthermore, we made some assumptions about sensor nodes, networks, and the environment.

Basic assumptions are as follows:

Nodes transmit data in a multi-hop fashion.

Nodes positions are fixed. Nodes are synchronized according to their time. All nodes have similar ca- pabilities (processing, communication, initial en- ergy). Nodes can adjust their transmission power.

Sensor ranges are shorter than their transmission ranges. Base station (or Sink) has no limitations in energy and of transmission coverage. Experi- ments were conducted using MATLAB simulator.

The simulation parameters are summarized in table 1.

4.2 Data accuracy and lifetime comparison With the change of the density (point of inter- ests), we measured the data accuracy in all clus- tering methods. For example, 100 POI indicates 100 sensor data, which is generated from the sensor field. Figure 10 and 11 show the data accuracy of the clustering method in accordance with the num- ber of POI, sensor coverage and transmission range.

According to the experiment result, we can con- clude that classic clustering methods are easily in- fluenced by POI variation.

Moreover, in the case of advanced methods, which are shown in figure 11, network lifetime and

data accuracy are slightly influenced by sensor coverage. Capital C and T denote sensor coverage and transmission range respectively.

4.3 Network lifetime comparison

Figure 12 shows the network lifetime which is classified by each data pattern.

According to figure 12, LEACH is not affected by data patterns. Because LEACH has no algo- rithm to reorganize sensor data except cluster head node data aggregation. TEEN shows a different result, even though TEEN is based on the LEACH.

APTEEN shows a same result compare with TEEN. However, still this network not satisfies user requirement. ARCT shows not a good result about the dead node when it applied random data pattern and air-temperature data pattern. According to the figure, ARCS seems not to be influenced by application environments. ARCS uses sensor cov- erage to elect active node. From active node, they elect network participants to form clusters. With periodic cluster reformation, these clusters transfer their data during the network lifetime. In CM-EDR, periodic, random, and air-temperature data pattern showed the slightly lower results. In random data pattern, there is no correlation between data.

Hence, CM-EDR cannot process this kind of data

effectively. Similarly, periodic data pattern and

air-temperature data pattern has not been enough

correlation in their data. According to the figure,

(9)

(a) (b)

(c) (d)

(e) (f)

(g)

Fig. 10. Data accuracy and lifetime comparison graph without sensor coverage consideration. (a) LEACH,

(b) TEEN, (c) APTEEN, (d) ARCT, (e) ARCS, (f) CM-EDR, and (g) Ed-RCS.

(10)

(a) (b)

(c)

Fig. 11. Data accuracy and lifetime comparison graph with sensor-coverage consideration. (a) ARCS, (b) CM-EDR, and (c) Ed-RCS.

Ed-RCS shows the better results. Ed-RCS shows the relatively lower results in case of ran- dom data pattern and air-temperature data pattern.

Basically, this scheme was proposed to achieve high performance in air-temperature application environment.

4.4 Data accuracy comparison

Figure 13 shows data accuracy of clustering scheme along with network lifetime.

According to figure 13, LEACH has the highest accuracy. Most of the data show stable data accuracy. Even in the case of air-temperature data pattern, it looks almost stable. Due to the threshold values, TEEN looks unstable. It means that TEEN cannot be trusted and be proven as a good scheme.

Same as TEEN, APTEEN shows unstable data ac- curacy about each data. Especially, in the case of air-temperature data pattern, APTEEN shows se-

vere fluctuations in the graph because of periodic transmission. Regardless of data pattern, ARCT shows severe differences in data collection accu- racy. ARCS shows no significant difference.

CM-EDR and Ed-RCS show similar graph.

4.5 Node isolation probability comparison In a clustering scheme, a cluster head node per- forms the role of a repeater between the source node and the sink. Thus, the number of cluster head nodes is important. Typically, in cluster head- er selection using probability, more cluster head nodes mean a higher connection probability.

Figure 14 shows the ratio of the isolation nodes

during the network lifetime. Node’s isolation is dis-

played regardless of a kind of data pattern. In the

case of ARCT, node isolation is frequently

occurred. It is mainly caused by their cluster form-

ing scheme.

(11)

(a) (b)

(c) (d)

(e) (f)

(g)

Fig. 12. Network lifetime comparison. (a) LEACH, (b) TEEN, (c) APTEEN, (d) ARCT, (e) ARCS, (f)

CM-EDR, and (g) Ed-RCS.

(12)

(a) (b)

(c) (d)

(e) (f)

(g)

Fig. 13. Data accuracy comparison. (a) LEACH, (b) TEEN, (c) APTEEN, (d) ARCT, (e) ARCS, (f) CM-EDR,

and (g) Ed-RCS.

(13)

(a) (b)

(c) (d)

(e) (f)

(g)

Fig. 14. Node isolation comparison. (a) LEACH, (b) TEEN, (c) APTEEN, (d) ARCT, (e) ARCS, (f) CM-EDR,

and (g) Ed-RCS.

(14)

Fig. 15. Node participation probability comparison.

Table 2. Clustering scheme comparison

Item LEACH TEEN APTEEN ARCT ARCS CM-EDR Ed-RCS

lifetime accuracy isolation participation energy

No No No No No

Yes Yes No No Yes

Yes Yes No No Yes

Little Yes High High No

No Little

No Little Little

Yes Yes No Little Little

Yes Yes No Little Little Fig. 16. Residual energy comparison .

4.6 Node participation comparison

Figure 15 shows network participation proba- bility of nodes in each clustering scheme.

LEACH shows high node participation. That means highest data accuracy. On the contrary, in spite of the high node participation of TEEN and APTEEN, they have low data accuracy. Main rea- son is threshold values. ARCS, CM-EDR and Ed-RCS show low node participation. Even though they show low probability, it directly not means their data accuracy is low. Because of their ad- vanced clustering algorithm, they show guaranteed operation even in low node participation.

In the case of random data pattern, ARCT, ARCS, CM-EDR, and Ed-RCS show a higher node participation probability. It means that these data processing algorithms may not effectively work to save node energy.

4.7 Residual energy comparison

It is the critical issue to conserve the available energy of the node for prolong the network lifetime.

Figure 16 shows residual energy comparison that was measured dead node occurred for the first time in LEACH. As shown in figure, each method showed the different results in accordance with data patterns.

In case of LEACH, the similar residual energy is displayed regardless of data patterns. TEEN and APTEEN have higher residual energy than other data patterns in the object tracking and non-data pattern. The other schemes have not been mean- ingful differences in the residual energy. In the worst case, random data pattern, they show the lowest residual energy.

As mentioned above, in each evaluation compar- ison category, several schemes were shown to be influenced about data patterns. This shows that previous network performance evaluation is diffi- cult to trust. Table 2 shows how the clustering schemes were influenced by data patterns.

According to table 2, except LEACH, most of

the schemes are influenced by data patterns. In

particular, network lifetime and data accuracy are

significantly influenced by data patterns. Accord-

(15)

(a) (b)

Fig.17. Sensor network lifetime comparison. (a) LEACH, TEEN, APTEEN, and (b) ARCT, ARCS, Ed-RCS.

ingly, it is strongly suggested that the performance evaluation of clustering schemes should take the data patterns into consideration on the basis of their application areas. Moreover, one or more ap- propriate data patterns should be used depending on the target applications for fair evaluation and comparison.

4.8 single vs. multiple sensor data comparison Figure 17 shows network lifetime in accordance with the different number of sensors.

As shown in the figure 17, network lifetime is influenced by the number of sensors. However, it seems not serious.

5. CONCLUSION

In this paper, we showed it is possible to change the result of the network performance due to sen- sor and application characteristics. Most of the re- search papers are premade specified application environment for their sensor network performance evaluation with no more consideration about sen- sors and environmental characteristics. However, in the case of the universal application environment of the sensor network, various characteristics have to be considered. As shown in the result of the net- work performance evaluation, sensor characteristic and application environment significantly affect the sensor network widely, and this cannot be ignored.

REFERENCE

[ 1 ] Joseph M. Kahn, Randy H. Katz, and Kristofer S.J. Pister, "Next Century Challenges: Mobile Networking for Smart Dust," Proceeding of IEEE International Conference on Mobile Computing and Networking, pp. 271-278, 1999.

[ 2 ] I.F Akyildiz, S. Weilian, Y. Sankarasubrama- niam, and E. Cayirci, “A Survey on Sensor Networks,” IEEE Communications Magazine, Vol. 40, Issue 8, pp. 102-114, 2002.

[ 3 ] Yang-Ick Joo and Jae-Wan Kim, “A Study on Environment Management System in Tunnel using Wireless Sensor networks,”

Journal of Korea Multimedia Society, Vol. 16, No. 10, pp. 1196-1203, 2013.

[ 4 ] G.J. Pottie and W.J. Kaiser, “Wireless in- tegrated Network Sensors,” Communications of the ACM, Vol. 43, No. 5, pp. 51-58, 2000.

[ 5 ] Y. Yao and J. Gehrke, "Query Processing for Sensor Networks," Proceeding of Conference Innovative Data Systems Research, pp. 1-12, 2003.

[ 6 ] Y.C. Tseng, S.Y. Ni, Y.S. Chen, and J.P. Sgeu,

"The Broadcast Storm Problem in a Mobile ad Hoc Network," The J ournal of Mobile Communication Computation and Informa- tion, Vol. 8, No. 2, pp. 153-167, 2002.

[ 7 ] J. Li and P. Mohapatra, “An Analytical Model

(16)

for the Energy Hole Problem in Many-to-one Sensor Networks,” P roceeding of Vehicular Technology Conference IEEE 62nd, Vol. 4, pp. 2721-2725, 2005.

[ 8 ] S.H. Hong and B.K. Kim, “An Efficient Data Gathering Routing Protocol in Sensor Net- works using the Integrated Gateway Node,”

IEEE Transactions on Consumer Electronics, Vol. 56, Issue 2, pp. 627-632, 2010.

[ 9 ] W.B. Heinzelman, A.P. Chandrakasan, and H.

Balakrishnan, "An Application-specific Protocol Architecture for Wireless Microsensor Networks," IEEE Transactions on Wireless Communications, Vol. 1, No. 4, pp. 660-670, 2002.

[10] O. Younis and S. Fahmy, "Distributed Clustering in Ad-hoc Sensor Networks: a Hybrid, Energy-efficient Approach," P ro- ceedings of IEEE INFOCOM, pp. 629-640, 2004.

[11] S.D. Muruganathan, D. Ma, R. Bhasin and A.

Fapojuwo, "A Centralized Energy-efficient Routing Protocol for Wireless Sensor Networks," IEEE Communications Magazine, Vol. 43, No. 3, pp. s8-s13, 2005.

[12] A. Manjeshwar and D.P. Agrawal, "TEEN: a Routing Protocol for Enhanced Efficiency in Wireless Sensor Networks," Proceedings of International P arallel and Distributed Processing Symposium., pp, 2009-2015, 2001.

[13] A. Manjeshwar and D.P. Agarwal, "APTEEN:

a Hybrid Protocol for Efficient Routing and Comprehensive Information Retrieval in Wireless Sensor Networks," Proceeding of Parallel and Distributed Processing Sym- posium, P roceedings International, pp. 195- 202, 2002.

[14] D. Choi, S. Moh, and I. Chung, “Regional

Clustering Scheme in Densely Deployed Wireless Sensor Networks for Weather Monitoring Systems,” The 12th IEEE Inter- national Conference on High Performance Computing and Communications, pp. 497-502, 2010.

[15] D. Choi, S. Moh, and I. Chung, ”ARCS: An Energy-Efficient Clustering Scheme for Sensor Network Monitoring Systems,” ISRN Communications and Networking, Vol. 2011, Article ID 572572, 2011.

[16] T. Kaur and J. Baek, “A Strategic Deployment and Cluster-Header Selection for Wireless Sensor Networks,” IEEE Transactions on Consumer Electronics, Vol. 55, No. 4, pp.

1890-1897, 2009.

[17] N. Bouabdallah, M. Rivero-Angeles and B.

Sericola, “Continuous Monitoring using Event-Driven Reporting for Cluster- Based Wireless Sensor Networks,” Vehicular Technology, IEEE Transactions on, Vol. 58, No. 7, pp. 3460-3479, 2009.

[18] D. Choi, Y. Cho, D. Tak, J. Kang and I. Chung,

“A Study of Event-driven Regional Clustering Scheme for Wireless Sensor Networks,”

Proceeding of The Spring Conference of Korea Multimedia Society , Vol. 14, No. 1, p.

65, 2011.

[19] D. Choi, J. Shen and I. Chung, “A Study of Performance Variation by Sensor Coverage in Wireless Sensor Networks,” Proceeding of The Fall Conference of the Korea Multimedia Society, Vol. 14, No. 2, p. 38, 2011.

[20] D. Choi, S. Moh, and I. Chung, “Impact of

Sensor Data Patterns on Performance Evalu-

ation of Clustering Schemes in Wireless

Sensor Networks,” Sensor Letters, Vol. 11,

No. 2, pp. 249-258, 2013.

(17)

Dongmin Choi

He received his B.E. degree from the Kyunghee University in 2003 and M.S. and Ph.D. de- grees in computer Science from Chosun University in 2007 and 2011, respectively. Since 2014, he has been a Professor in College of General Education, Gwangju, Korea. His re- search interests are in information security, sensor network systems, mobile ad-hoc systems, smart grid home network systems and internet ethics.

Ilyong Chung

He received the B.E. degree

from Hanyang University,

Seoul, Korea, in 1983 and the

M.S. and Ph.D. degrees in

Computer Science from City

University of New York, in 1987

and 1991, respectively. From

1991 to 1994, he was a senior technical staff of

Electronic and Telecommunication Research Institute

(ETRI), Dajeon, Korea. Since 1994, he has been a

Professor in Department of Computer Science,

Gwangju, Korea. His research interests are in com-

puter networking, security systems and coding theory.

수치

Fig. 1. Clustering method classification.
Fig. 2. Network lifetime comparison in accordance with the clustering method classification
Fig. 3. Sensor data density comparison in same target area. (a) 100 sensor data spot of 10m2 size, and (b) 10000 sensor data spot of 1m2 size.
Fig. 4. Sensor coverage comparison.
+7

참조

관련 문서