1. Introduction1)
Meteorological data in building energy simulations is a source of information on annual climate conditions. The 'typical meteorological data' used in the simulation is that of a 'typical year', which is made through statistical processing of the meteorological data for 15 to 30 years [1] .
In Korea, the building energy efficiency rating certification system is implemented [2], and ECO2 is used as a certification program. ECO2 simulation uses the typical meteorological data for 13 major regions in Korea [3]. However, these meteorological data do not reflect the meteorological information of the whole country, and when evaluating the energy efficiency rating of any region other than the 13 major regions, it may be ambiguous which meteorological data should be used.
In the current building energy efficiency rating system, the meteorological data of the nearest surrounding region is used instead when evaluating the energy efficiency rating of any region other than the 13 major regions[4]. For example, Suwon uses the meteorological data of Seoul, but it is also adjacent to Incheon.
Pohang adjacent to the coast, which is the closest distance to
pISSN 2288-968X, eISSN 2288-9698 http://dx.doi.org/10.12813/kieae.2017.17.2.013
Daegu, is likely to have problems in using the meteorological data of Daegu which is characteristic of inland climate.
In this study, the limitations of ECO2 typical meteorological data used for the building energy efficiency rating certification are examined and the typical meteorological data of the additional regions not included in the existing 13 major regions are created.
Based on the created typical meteorological data, the heating energy demands of the additional regions are also analyzed.
2. Necessity to expand the existing typical meteorological data
In relation to the building energy efficiency rating certification, the necessity to expand the existing typical meteorological data has been mentioned by Hideki Kikumoto et al. [5] and Lee Sung Jin et al. [6]. The operational regulations of the building energy efficiency rating certification system provide only the meteorological data of 13 major regions for energy simulation [3], and thereby there is a limit to obtain the simulation results for any region other than those major regions. Therefore, it is necessary to acquire the meteorological data of additional regions in order to reflect the local characteristics of meteorological data and to
KIEAE Journal
Korea Institute of Ecological Architecture and Environment
84
Extension of Typical Meteorological Data and Energy Demand Analysis for Building Energy Efficiency Rating Certification System
Lee, Sung-Jin*⋅Kim, Jonghun**⋅Jeong, Hakgeun***⋅Yoo, Seunghwan****⋅Lee, Junghun*****
* Energy Saving Laboratory, Energy Efficiency Research Division, Korea Institute of Energy Research, South Korea([email protected]) ** Corresponding author, Energy Saving Laboratory, Korea Institute of Energy Research, South Korea([email protected])
*** Coauthor, Energy ICT Laboratory, Korea Institute of Energy Research, South Korea ([email protected]) **** Coauthor, Energy Saving Laboratory, Korea Institute of Energy Research, South Korea([email protected])
***** Coauthor, Dept. of Architectural Engineering, Sung Kyun Kwan Univ. South Korea([email protected])
A B S T R A C T K E Y W O R D
Meteorological data is one of the important factors in the calculation of building energy demand. The purposes of this study are to review the limitations of the typical meteorological data of ECO2 program and to create the new typical meteorological data and then analyze the building energy demands for additional regions which are not included in the existing 13 region in the ECO2 program. The extended typical meteorological data to a total of 33 regions were based on IWEC(International Weather for Energy Calculations) data files and were created in the form applicable to the building energy efficiency rating certification system. As a result of comparing the heating energy demands of a representative region with the surrounding regions in each of five regions in Korea, the variance of Cv(RMSE) ranged from 36% to 344% and MBE ranged from -32% to 190%
for the whole regions. This suggests that the difference of heating energy demand may vary greatly depending on the region where the meteorological data is used and the meteorological data of more detailed regions is needed for reliable calculation of building energy demand
ⓒ 2017 KIEAE Journal
표준기상데이터
건축물에너지효율등급 인증 직산분리
ISO 13790 건축물에너지 평가
Typical Meteorological data Builidng Energy efficiency rating certification
ISO 13790
Building Energy Assessment
A C C E P TA N C E I N F O Received Dec 21 2016
Final revision received Mar 23, 2017 Accepted Mar 28, 2017
improve the reliability of simulation results in building energy evaluation,
The current operational regulations, if any region has no meteorological data, recommend use of the typical meteorological data of the surrounding regions . For example, Pohang uses the meteorological data of Daegu or Busan, and Yeosu uses the meteorological data of the neighboring Gwangju or Mokpo.
However, this may have a large influence on energy demand calculation results as well as the meteorological data itself depending on which regions to select.
To verify this problem, the present study takes the cases of Pohang and Yeosu as an example. The energy demands are calculated when the meteorological data of the surrounding major regions (Daegu and Busan in case of Pohang and Gwangju and Mokpo in case of Yeosu) are used, and the difference between the two calculation results are compared. In this calculation, the reference model house and the calculation procedure are based those described in Chapter 4.
Fig. 1 shows the meteorological data and energy demand calculation results of Daegu and Busan, and Fig. 2 shows those of Gwangju and Mokpo.
Fig. 1. Comparison of meteorological data & heating energy demand for Daegu and Busan
Fig. 2. Comparison of meteorological data & heating energy demand for Gwangju and Mokpo
The statistics, Cv(RMSE)(Coefficient of Variation of the Root Mean Squared Error) and MBE(Mean Bias Error), are defined as follows [7].
MBE(%) =
× (1)
RMSEperiod =
(2)
Aperiod =
(3)
Cv(RMSEperiod) =
× (4)
M = simulation result value (kWh) S = another simulation result value (kWh) Ninterval = the number of time intervals
These statistics, which are commonly used to verify the measured value of building energy and the calculated value of model simulation, are used in this study to compare the deviation between simulation results according to different meteorological data. In the case of Pohang, as shown in the figure, it showed a difference of Cv (RMSE) 90%, MBE -49.2% in the heating energy demand of Daegu and Busan, and in the case of Yeosu, it showed a difference of Cv (RMSE) 63% and MBE -26.5% in the heating energy demand Gwangju and Mokpo. This suggests: If there are no typical meteorological data for any region to be evaluated, the use of the meteorological data of the neighboring 13 regions does not reflect the meteorological characteristics of the corresponding region, and thus it may have a large impact on calculation results.
3. Creation of IWEC-based extended typical meteorological data
IWEC (International Weather for Energy Calculations) is the representative meteorological data for building energy calculation which is provided by the American Society of Heating, Refrigerating and Air Conditioning Engineers (ASHRAE) [8]. It was made with the data of National Climatic Data Center (NC) in the USA. For Korea, the IWEC provides 69 kinds of meteorological data including temperature, humidity, solar radiation, wind speed, cloudiness and illumination for 33 regions:
Seoul, Busan, Incheon, Daegu, Daejeon, Gangreung, Gwangju, Wonju, Chuncheon, Jeonju, Cheongju, Mokpo, Jeju, Andong, Cheorwon, Chupwolryeong, Daegwallyeong, Gunsan, Jinju, Masan, Pohang, Seogwipo, Seosan, Sokcho, Suwon, Tongyeong, Uljin, Ulleungdo, Ulsan, Wando, Yeongwol , Yeosu, and Donghae) [9].
However, the IWEC meteorological data can’t be directly applied to the simulation of building energy efficiency rating certification. To calculate the energy demand, 8,760 hourly raw data should be converted into monthly data, and calculations for solar altitude and total solar irradiance by azimuth are also needed.
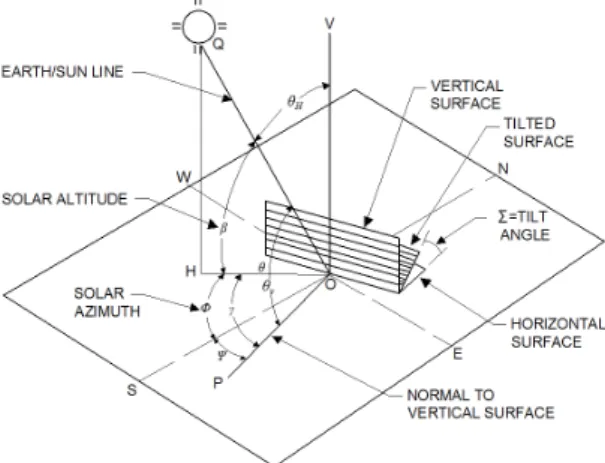
The solar altitude and azimuth separation are calculated by the method of ASHRAE Fundamental 2013: Calculating clear-sky solar radiation & Transposition to receiving surfaces of various orientations [10].
Fig. 3 shows the solar angles to the vertical and horizontal planes. The solar altitude was calculated using the following equations (5) - (7).
Fig. 3. Solar angles for vertical and horizontal surfaces
sin β = cos L cos δ cos H + sin L sin δ (5)
δ= 23.45 sin (360°(n+284)/365 ) (6)
H = 15(AST – 12) (7)
where
β = Solar altitude (°) L = Latitude(°) n = Day of year
AST = Apparent solar time
The total solar irradiance of horizontal surface, (Et,h), and the total solar irradiance by directions, (Et,v) are obtained using the solar altitude calculated from the above equations and the following equations (8) to (14).
Et,h=Eb,h + Ed (8)
Et,v=Eb,v + Ed (9)
Eb,h=Eb sin β (10)
Eb,v=Eb cosθ (11)
cos θ = cos β cos γ (12)
γ = Φ – Ψ (13)
sin Φ = sin H cos δ/cos β (14)
where
Et,h = Horizontal surface total solar irradiance (W/m2) Et,v = Vertical surface total solar irradiance (W/m2) Ed = Diffuse solar irradiance (W/m2)
Eb,h = Horizontal surface direct normal irradiance (W/m2) Eb,v = Vertical surface direct normal irradiance (W/m2) Eb = Direct normal irradiance (Solar radiation received in a collimated beam on a surface normal to the sun (W/m2)
Φ = Solar azimuth (°) Ψ = Surface azimuth (°)
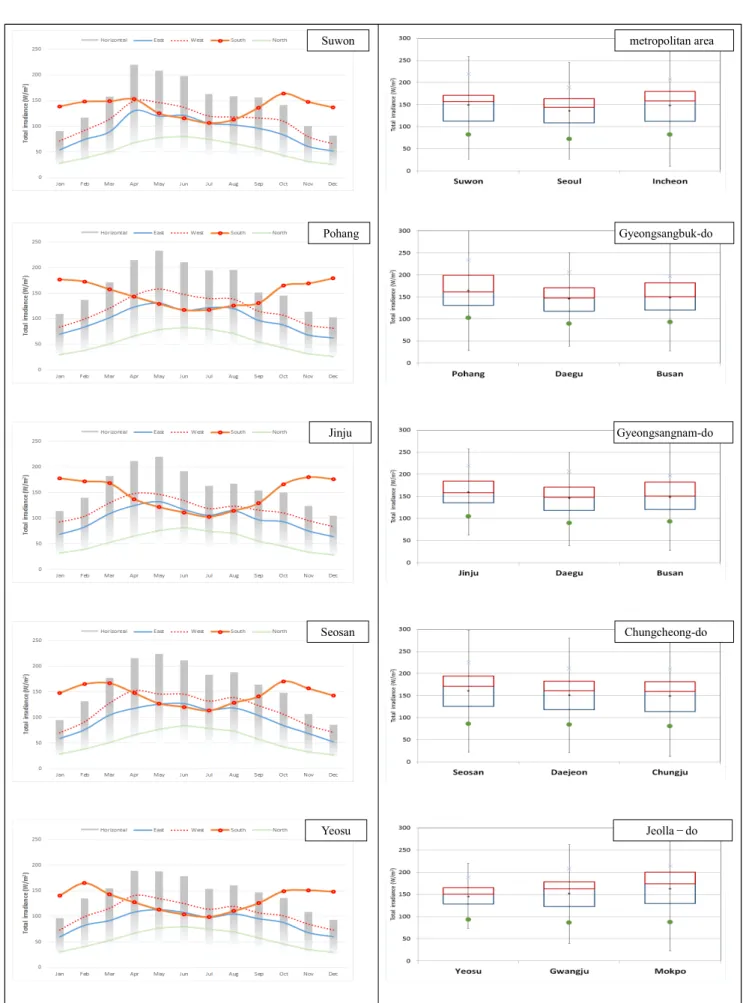
Table I shows the temperature and total solar irradiance of 33 regions in Korea provided by IWEC. With these data, the total solar irradiances of horizontal surface and the total solar irradiance by directions were calculated, which showed different values depending on different regions but a similar pattern in the monthly distribution. Fig. 4, as an example of those calculation results, shows the total solar irradiance of horizontal surface and total solar irradiance by the directions of east, west, north, and south for additional representative regions (Suwon, Pohang, Seosan, Yeosu, and Jinju) which are not included in the 13 major regions of ECO2 program and also were selected one by one from the 5 region groups of the whole country.
Fig. 5 is shown in the form of skeletal box-and-whishker plot of the total irradiance of horizontal surface for the additionally selected representative regions and the existing regions around them (Seoul and Incheon in the case of Suwon, Daegu and Busan in case of Pohang, in case of Jinju Daegu and Busan in case of Jinju, Daejeon and Cheongju in case of Seosan, Gwangju and Mokpo in case of Yeosu, which are provided with the meteorological data of ECO2). As shown in the figure, the averaged total solar irradiance of horizontal surface was 149.19 W/m2, 152.63 W/m2, 146.27 W/m2 in the case of Suwon-Seoul-Incheon, respectively; 164.84 W/m2, 158.40 W/m2, 165.48 W/m2 in the case of Pohang-Daegu-Busan, respectively; 167.34 W/m2, 158.40 W/m2, 165.48 W/m2 in the case of Jinju-Daegu-Busan, respectively;
161.12 W/m2, 161.55 W/m2, 162.47 W/m2 in the case of Seosan-Daejeon-Cheongju, respectively, and 144.92 W/m2, 162.97 W/m2, 165.95 W/m2 in the case of Yeosu-Gwangju–Mokpo, respectively. As the Cv(RMSE) deviation of the averaged total solar irradiance of horizontal surface between a representative region in the five region groups and the surrounding regions, Suwon showed 6% and 8% for Seoul and Incheon, respectively;
Pohang showed 7% and 5% for Daegu and Busan, respectively;
Jinju showed 6% and 9% for Daegu and Busan, respectively;
Seosan showed 4% and 7% for Daejeon and Cheongju,
respectively, and Yeosu showed 14% and 17% for Gwangju and Mokpo, respectively. The overall deviation of Cv(RMSE) ranged from minimum 4% to maximum 17%.
4. Energy demand analysis using typical meteorological data
4.1. Calculation method of building energy demand
Since ECO2 simulation cannot directly calculate the building energy demands using the extended meteorological data[11], this study uses ISO 13790: Monthly Calculation Method[12]. Only the
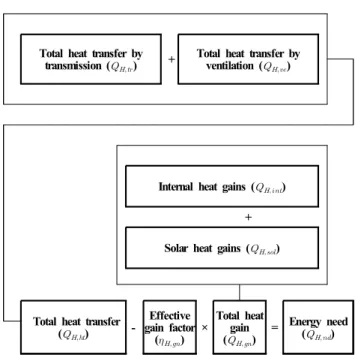
heating energy demand is considered in the calculations. The calculation process of the heating energy demands is shown in Fig.
6. The heating energy demand in this calculation method is expressed by the following equation:
(15)
where
= Heating energy demand (MJ)
= Total heat transfer in heating mode (MJ)
= Effective gain factor in heating mode
= Total heat gain in heating mode (MJ)
Location Jan Feb Mar Apr May Jun Jul Aug Sep Oct Nov Dec
TEMP TSI TEMP TSI TEMP TSI TEMP TSI TEMP TSI TEMP TSI TEMP TSI TEMP TSI TEMP TSI TEMP TSI TEMP TSI TEMP TSI
Seoul -2.5 83 0.7 114 5.9 160 13.2 227 18.1 229 21.8 205 24.5 175 26.0 169 21.2 157 15.1 135 7.3 99 0.9 79 Incheon -2.0 89 0.5 117 4.8 152 10.8 184 16.6 208 21.0 207 24.3 162 25.9 168 20.8 150 15.0 134 8.5 99 1.4 85 Daejeon -1.2 100 0.9 135 6.2 178 11.7 225 16.7 236 22.1 208 24.6 178 25.9 178 20.9 154 14.2 147 7.5 111 0.2 89 Andong -2.2 98 -0.9 130 5.7 182 12.4 239 17.1 248 21.7 225 24.6 181 25.1 178 19.8 156 13.8 144 6.4 112 0.1 94 Busan 3.0 112 4.1 143 8.6 169 13.0 204 17.5 218 20.4 205 24.0 194 25.9 196 22.6 166 17.7 150 12.0 119 6.6 109 Cheongju -1.8 91 1.1 126 4.9 172 13.8 241 17.5 238 22.4 229 25.5 182 26.1 176 20.5 171 14.3 142 6.9 101 1.2 82 Cheorwon -4.2 91 -2.1 125 3.9 179 10.8 241 16.6 244 20.2 222 23.7 164 24.0 183 18.7 165 11.4 145 3.0 99 -2.3 74 Chuncheon -5.2 83 -1.3 129 4.2 165 10.6 228 17.6 236 21.6 221 24.9 174 24.7 181 19.5 150 12.8 141 5.6 86 -1.2 72 CPN* -2.8 97 -0.5 134 6.1 194 11.2 226 17.0 236 20.9 203 24.0 168 24.1 166 19.4 154 13.0 145 6.4 109 0.8 88 Daegu 1.0 108 3.4 141 8.0 170 13.8 209 18.9 214 23.0 211 26.1 177 26.3 168 21.5 149 16.0 146 10.2 109 3.9 100 DGY* -8.0 104 -2.2 145 0.6 185 7.7 235 11.7 240 15.7 236 19.6 207 19.3 203 14.2 168 8.3 143 3.5 114 -3.1 96 DH-R* 0.8 102 2.2 137 7.2 173 12.3 211 15.8 195 19.1 187 22.6 160 22.9 168 19.3 139 15.4 141 9.5 111 3.7 101 Gangneung -0.4 106 2.1 135 6.8 176 12.8 217 17.9 241 20.2 220 24.0 198 24.0 184 20.4 161 15.4 148 9.4 109 3.1 98 Gumsam 0.3 97 1.6 132 5.3 169 11.2 221 16.9 226 21.4 215 25.1 191 25.7 191 21.3 162 16.0 148 9.1 112 2.4 89 Gwangju 1.4 99 2.9 131 7.1 171 13.6 218 18.1 226 22.3 208 25.0 181 25.7 191 22.0 175 15.8 149 9.6 114 2.7 93 Jeju 5.6 84 6.3 122 8.6 156 13.4 189 17.6 206 21.4 196 26.0 211 26.7 184 22.3 166 18.5 146 13.0 108 8.3 86 Jeonju -0.2 103 2.1 136 6.3 179 12.7 228 18.0 243 22.8 221 26.0 187 26.1 186 21.4 173 15.1 152 8.7 111 1.9 89 Jinju 0.2 103 2.1 136 6.9 179 12.7 228 16.9 243 21.9 221 25.4 187 26.0 186 21.2 173 14.7 152 7.9 111 1.6 89 Masan 2.9 110 5.4 141 9.0 174 14.0 196 18.3 204 21.5 177 25.4 156 26.8 168 23.0 158 17.7 142 11.1 115 5.3 101 Mokpo 2.0 102 2.4 130 7.5 165 12.5 218 17.3 232 21.1 203 25.3 197 26.0 210 22.4 170 16.7 159 11.0 116 4.7 91 Pohang 1.9 110 4.3 137 9.2 171 14.2 214 18.9 233 21.5 210 24.5 194 25.4 196 22.1 151 16.6 145 10.2 114 4.7 103 Seogwipo 7.2 99 8.0 125 10.2 164 14.9 203 18.5 203 21.8 184 26.0 184 27.2 186 23.8 165 19.4 152 14.4 116 9.9 95 Seosan -1.0 95 0.3 132 4.4 178 10.1 216 16.4 225 20.8 212 24.3 183 25.1 188 19.9 164 13.5 148 7.4 107 0.6 86 Sokcho -0.6 99 1.5 135 6.5 160 11.3 211 16.0 205 19.3 194 23.1 167 22.9 155 20.1 152 15.1 137 9.1 106 2.7 91 Suwan -2.9 90 -1.2 117 5.9 158 11.9 219 17.5 208 22.0 198 25.1 162 25.4 158 20.7 156 14.5 141 7.0 100 -0.2 82 Tongyeong 2.9 108 4.7 132 7.5 163 13.4 197 17.5 198 20.6 175 24.3 151 25.8 168 22.6 151 17.2 145 11.2 117 5.9 95 Uljin 0.7 105 3.1 136 6.7 160 11.8 208 16.3 225 18.8 201 22.6 187 24.1 187 20.0 160 14.8 142 9.3 109 3.2 101 Ulleungdo 1.6 72 2.4 100 5.6 149 10.4 195 14.9 207 19.2 203 22.8 192 23.6 183 20.2 142 15.6 131 10.8 93 3.6 71 Ulsan 2.0 110 4.3 137 7.9 164 13.5 220 17.9 222 21.4 203 25.4 200 26.0 198 21.7 160 16.2 150 10.3 121 4.6 109 Wando 3.4 103 4.8 133 8.5 164 13.2 205 17.0 218 20.2 194 24.2 183 25.9 196 22.7 163 16.6 158 10.6 114 5.5 97 Wonju -2.7 86 0.8 126 5.2 167 12.9 237 17.0 247 22.1 216 25.3 168 25.0 166 19.6 155 11.8 137 4.9 97 -0.6 77 Yeongwol -5.5 93 -1.1 138 4.8 184 11.3 237 16.6 253 21.1 243 23.5 177 24.2 167 19.1 164 12.8 146 5.3 105 -1.5 84 Yeosu 2.6 97 4.5 135 8.3 155 13.4 189 17.5 187 20.4 178 24.0 154 25.6 161 22.4 147 17.4 135 11.7 109 5.6 93
*TEMP(Temperature, ℃), TSI(Total solar irradiance, W/m2), CPN(Chupungnyeong), DGY(Daegwallyeong), DH-R(Donghae-Radar) Table 1. Temperature and total solar irradiance for 33 regions in Korea.
Suwon metropolitan area
Pohang Gyeongsangbuk-do
Jinju Gyeongsangnam-do
Seosan Chungcheong-do
Yeosu Jeolla–do
Fig. 4. Solar irradiance of additional regions in Korea Fig. 5. Comparison of the irradiances of additional regions and the surrounding regions in each of 5 regions
Total heat transfer by
transmission ( ) + Total heat transfer by ventilation ()
Internal heat gains ( ) + Solar heat gains ()
Total heat transfer () -
Effective gain factor ()
×
Total heat gain ( )
= Energy need ( )
Fig. 6. Flow chart of ISO 13790 monthly calculation method in heating condition.
In the equation (15), the total heat transfer (QH,ht) in the heating mode refers to the heat transfer by transmission and ventilation, and the total heat gain (QH,gn) in the heating mode refers to the internal heat gains and solar heat gains. The effective gain factor (
H,gn) is a coefficient indicating the degree to which the amount of heat obtained in the heating mode is utilized to reduce the amount of heat loss, and it is calculated by reflecting the heat-balance ratio and the heat capacity of structure.
The total heat transfer (QH,ht) and the total heat gain (QH,gn) in the heating mode are as written in equations (16) and (17), and the total heat transfer (QH,ht) is determined by the heating set-point temperature (int,set) and the monthly averaged outside temperature (e)
(16)
(17)
(18)
(19)
where
= Heat transfer by transmission in heating mode (MJ)
= Heat transfer by ventilation in heating mode (MJ)
= Heat transfer coefficient by transmission (W/K)
= Heat transfer coefficient by ventilation (W/K)
= Set-point temperature (℃)
= period of time (Mega seconds)
The effective gain factor () in the equation (15) for
calculating the heating energy demand is calculated by the following equations (20) to (26).
(20)
if and ≠
(21)
if
(22)
if
(23)
(24)
(25)
× (26)
where
: Heat-balance Ratio in heating mode
: Numerical parameter dependimg on the time constant()
: Reference numerical parameter
: Time constant of the building zone (h)
: Reference time constant (h)
: The sum of heat capacity of the building (J/K)
: The heat capacityof factor (J/ (m2K))
: Area of building factor j (m2)
The reference numerical parameter () and the reference time constant () in the equation (24) are presented in the table of ISO 13790. Each country uses its own values according to the situation, but if there are no available values, the values of Table. 2 are used [12].
Method
Monthly calculation method 1.0 15 Seasonal calculation method 0.8 30 Values of and may also be provided at national level.
Table 2. Values of numerical parameter, and reference time constant, .
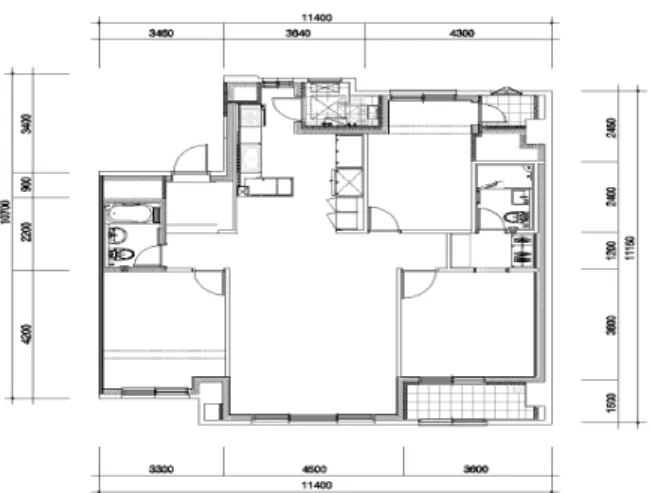
4.2. Reference model
A unit area plane of the reference model house has a specific area of 85㎡ (Fig. 7). The extended plane on 3Bay was selected as the plane configuration of the evaluation model, and the input conditions [4] for the calculation of the energy demand are shown
in Table. 3.
Fig. 7. Reference model for calculation
Division Sector Parameters
General information
Building type Apartment Direction South
Height 2.3 m
Floor area 84.85㎡
Window
to wall area 22%
Internal condition
Heating set point 20℃
Cooling set point 26℃
Hours of use 24 hours Infiltration 1.0 ACH Occupancy 53 Wh/(m2d) Equipment 52 Wh/(m2d)
Lighting 4 W/㎡
Surface information
Wall 0.210 W/(m2K) Roof 0.150 W/(m2K) Floor 0.180 W/(m2K) Window 2.400 W/(m2K)
SHGC 0.774
Door 2.700 W/(m2K) Table 3. Input data for reference model
4.3. Energy demand analysis and application of the extended typical meteorological data
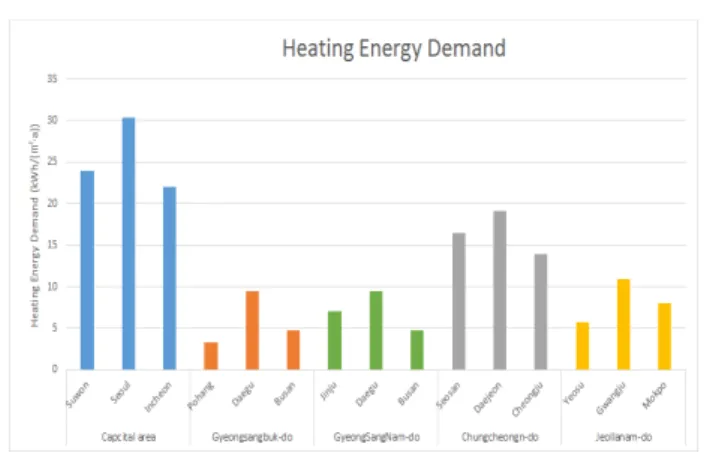
The annual heating energy demand per unit area calculated for the reference model is shown in Fig. 8. The annual heating energy demand per unit area of Suwon, Seoul, and Incheon located in the metropolitan area was 24.01 kWh/(m2·a), 30.32 kWh/(m2·a), 22.00 kWh/(m2·a), respectively, while the Cv(RMSE) of Seoul and Incheon based on Suwon was 49% and 36%, respectively, and MBE showed the difference of 26% and –8%, respectively. In Gyeongsangbuk-do, the heating energy demand of Pohang, Daegu and Busan was 3.26 kWh/(m2·a), 9.45 kWh/(m2·a), 4.80 kWh/(m2·a), and the Cv (RMSE) of Daegu and Busan based on
Pohang was 344% and 84%, respectively, and the MBE was 190%
and 47%. In Gyeongsangnam-do, the heating energy demand of Jinju, Daegu and Busan was 7.03 kWh/(m2·a), 9.45 kWh/(m2·a), 4.80 kWh/(m2·a) and the Cv (RMSE) of Daegu and Busan based on Jinju was 61%, and 69%, and the MBE was 34% and -32%. In Chungcheong-do, the heating energy demand of Seosan, Daejeon and Cheongju was 16.43 kWh/(m2·a), 19.13 kWh/(m2·a), 13.93 kWh/(m2·a), and the Cv (RMSE) of Daejeon and Cheongju based on Seosan was 38%, 37%, and the MBE was 16% and -15%.
Finally, in Jeolla–do, the heating energy demand of Yeosu, Gwangju and Mokpo was 5.76 kWh/(m2·a), 10.93 kWh/(m2·a), 8.03 kWh/(m2·a), respectively, and the Cv (RMSE) of Gwangju and Mokpo based on Yeosu was 196%, 130%, respectively, and the MBE showed a deviation of 90%, 39% respectively. The results are summarized in Table. 4.
As a result of calculation, the heating energy demand of the additional region and the surrounding regions showed a great difference. In addition, the statistical analysis showed a variation of 36%~344% Cv (RMSE) and -32%~190% MBE, which indicates that the heating energy calculation result significantly varies depending on the meteorological data of the corresponding region.
Region City
*Heating energy demand
Cv(RMSE) (%)
MBE (%)
Metropolitan area
Suwon 24.01 - -
Seoul 30.32 49 26
Incheon 22.00 36 -8
Gyeongsangbuk-do
Pohang 3.26 - -
Daegu 9.45 344 190
Busan 4.80 84 47
GyeongSangNam-do
Jinju 7.03 - -
Daegu 9.45 61 34
Busan 4.80 69 -32
Chungcheongn-do
Seosan 16.43 - -
Daejeon 19.13 38 16
Cheongju 13.93 37 -15
Jeollanam-do
Yeosu 5.76 - -
Gwangju 10.93 196 90
Mokpo 8.03 130 39
*Unit: kWh/(m2·a,) Table 4. Comparison of additional regions with the surrounding regions for heating energy demand and statistical analysis.
Fig. 8. Results of heating energy demand for each region
5. Conclusion
This study newly created the typical meteorological data of 33 regions in Korea using the meteorological data provided by IWEC.
With these typical meteorological data, the heating energy demands of an additional region and the surrounding ECO2 regions for the five region groups were also analyzed. As a result of the analysis, the heating energy demand of the additional region and the surrounding ECO2 regions varied by 36%~344% in Cv (RMSE) and –32%~190% in MBE. This suggests that the ECO2 typical meteorological data has a limit to apply to any region far from the existing 13 major regions and the typical meteorological data of more regions are needed in order to evaluate more reliable building energy demands. However, since the typical meteorological data cannot be expanded indefinitely, further study should be carried out to identify valid territory when evaluating the surrounding region using the meteorological data of a representative region and to quantify the number of typical meteorological data needed in Korea.
Acknowledgements
“This work was conducted under framework of the research and development program of the Korea Institute of Energy Research(B7-9302-01) and (B6-2462)”
Reference
[1] Seo Dong Hyun, "Standard meteorological data of domestic and international meteorological data and status and utilization of standard building model" The Korean Society for Environmental Ecology Facility Journal 2015.07
[2] Kim, Ji-Yeon, "Overview and Status of Energy Efficiency Rating Certification System for Buildings," Korea Institute of Machinery and Materials Equipment Journal 2010.10
[3] (Chun, Jung-Gil, Evaluation of Building Energy Efficiency Rating of the Business Buildings : A Case Study, Conference Jounal of The Society of Air-Conditionong And Refrigerating Engineers of Korea, 2011.7 [4] Korea Energy Corporation, "Operational regulations on Energy
Efficiency Rating for Buildings". 2013.9
[5] Hideki kikumoto, Study on the future weather data considering the global and localclimate change for building energy simulation, Jounal of Sustainable Cities and Society, 2014
[6] Lee, Sung Jin, Analysis and Extendability Review of Typical Weather Data for Building Energy Efficiency Rating System, Conference Jounal of The Korean Solar Energy Society, 2016.10
[7] U.S. DEPARTMENT OF ENERGY, M&V Guidelines: Measurement and Verification for Federal Energy Projects version 4.0, 2015 [8] ASHRAE, ASHRAE International Weatehr Files For Energy
Calculations 2.0 (IWEC2), https://www.ashrae.org/, 2016 [9] ASHRAE,, IWEC2 User Manual and Final Report, 2011.10
[10] ASHRAE , ASHRAE Fundamental Chapter 14 Climate Design Information, ASHRAE Handbook, 2013
[11] Jeon, Jiwoon, A study on the energy-saving design for public office buildings using ECO2 program, Jungang Univ thesis, 2013.8