Journal of Nutrition and Health (J Nutr Health) 2019; 52(4): 354 ~ 368 https://doi.org/10.4163/jnh.2019.52.4.354
eISSN 2288-3959
Research Article
GL 예측모델 (estimated Glycemic Load, eGL)을 활용한 한국 성인의 식사 평가 및 대사질환 지표와의 연관성 연구 : 2013 ~2016년 국민건강영양조사 자료를 활용하여 *
하경호1, 남기선2, 송윤주3†
1서울대학교 보건대학원 보건학과, 2(주)풀무원 풀무원기술원, 3가톨릭대학교 생활과학부 식품영양학전공
Estimated glycemic load (eGL) of mixed meals and its associations with
cardiometabolic risk factors among Korean adults: data from the 2013 ~ 2016 Korea National Health and Nutrition Examination Survey *
Kyungho Ha1, Kisun Nam2 and YoonJu Song3†
1Department of Public Health, Graduate School of Public Health, Seoul National University, Seoul 08826, Korea
2Health & Nutrition Research Center, Pulmuone Co., Ltd., Seoul 06367, Korea
3Major of Food and Nutrition, The Catholic University of Korea, Bucheon, Gyeonggi 14662, Korea
ABSTRACT
Purpose: This study evaluated the glycemic response of diets using estimated glycemic load (eGL), which had been developed for mixed meals for Korean adults, and examined its associations with cardiometabolic risk factors among Korean adults. Methods: A total of 4,655 men and 6,760 women aged 19 years and above were included from the 2013 ~ 2016 Korea National Health and Nutrition Examination Survey. eGL was calculated by each meal (breakfast, lunch, dinner, and snack) and then summed to give daily total eGL. A multiple logistic regression analysis was used to examine the association. Results:
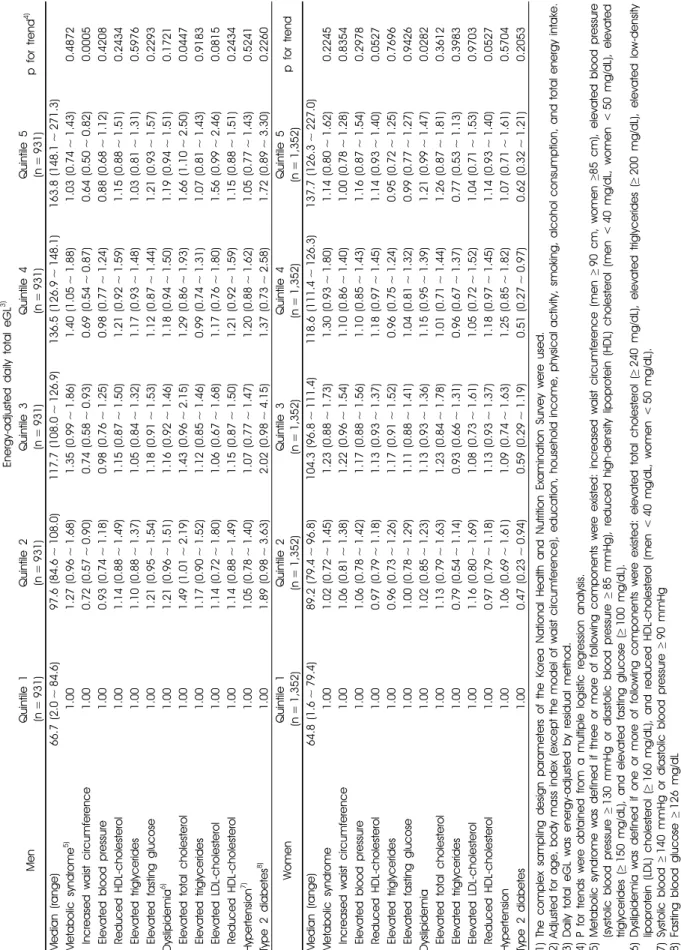
Mean daily total eGL was 112.6 in men and 99.3 in women. Daily total eGL was positively associated with carbohydrate and fiber intakes, but negatively associated with protein and fat intakes in both men and women (p < 0.05 for all). Daily total eGL showed an inverse association with HDL-cholesterol level in both men and women (p = 0.0036 for men and p = 0.0008 for women). Men in the highest quintile of daily total eGL showed a 66% increased risk of hypercholesterolemia (OR, 1.66; 95%
CI, 1.10 ~ 2.50; p for trend = 0.0447) compared with those in the lowest quintile. Conclusion: These findings suggest that eGL based on carbohydrate, protein, fat and fiber intakes can reflect glycemic response and therefore can be used as an index for dietary planning, nutrition education and in the food industry.
KEY WORDS: glycemic load, mixed meal, carbohydrate, dyslipidemia, Koreans
Received: March 20, 2019 / Revised: June 21, 2019 / Accepted: June 27, 2019
* This work was supported by the research grant funded from the Pulmuone Co., Ltd.
†To whom correspondence should be addressed.
tel: +82-2-2164-4681, e-mail: [email protected]
© 2019 The Korean Nutrition Society
This is an Open Access article distributed under the terms of the Creative Commons Attribution Non-Commercial License (http://creative- commons. org/licenses/by-nc/3.0/) which permits unrestricted non-commercial use, distribution, and reproduction in any medium, provided the original work is properly cited.
서 론
최근 탄수화물 섭취와 대사질환과의 연관성에 많은 관 심이 쏠리고 있다. 탄수화물은 지방, 단백질과 함께 체내 에서 에너지를 제공하는 3대 영양소이며, 특히 탄수화물 과 지방은 에너지 제공 측면에서 상보적인 관계에 있다 [1]. 이에 고탄수화물 식사는 전형적으로 지방이 차지하는 비율이 낮고 그에 따라 대사질환에 긍정적일 것이라 기대 한 것과 달리, 탄수화물의 과도한 섭취는 고중성지방혈증
또는 저고밀도지질단백질 (high-density lipoprotein, HDL)- 콜레스테롤혈증과 같은 이상지질혈증 [2-5], 대사증후군 [3,5,6], 제2형 당뇨병 [7-11] 등의 대사질환과 유의한 연관 성이 있는 것으로 보고되었다.
이와 관련한 역학연구들은 탄수화물의 섭취 수준을 주 로 탄수화물 섭취량, 에너지 섭취 비율, 또는 탄수화물 주 요 급원 식품인 백미나 통곡류 (whole grains)의 섭취량으 로 평가하였는데, 사용하는 변수에 따라 상이한 결과를 나 타냈다 [2,6,10,12,13]. 이러한 지표들 중에서 흰 쌀밥, 흰
빵 등과 같은 정제된 곡류 (refined grains)의 섭취는 제2형 당뇨병의 위험을 증가시키는 [7,9,10] 반면, 정제되지 않은 통곡류의 섭취는 제2형 당뇨병의 위험을 감소시키는 것으 로 [10,14,15] 보고되어 탄수화물 섭취와 대사질환과의 연 관성 평가 시 탄수화물의 양적인 측면뿐만 아니라 질적인 측면을 평가하는 것이 중요함을 보고하였다.
식품에 함유된 탄수화물의 질을 평가하는 방법으로 혈 당지수 (glycemic index) 혹은 혈당부하지수 (glycemic load, GL)가 많이 이용되는데, 이는 포도당 또는 흰 빵 등의 기준 식품과 비교하여 특정 식품의 식후 혈당반응을 수치화한 지표이다. 여러 연구에서 혈당지수 및 혈당부하지수와 심 혈관질환 [16-19], 제2형 당뇨병 [7,8,20,21]과 연관성이 있 음을 보고하였다. 이에 혈당지수 및 혈당부하지수는 당뇨 병의 치료에 효과적인 도구로 활용되기도 한다 [22].
그러나, 식품의 혈당지수를 활용할 경우, 단일 식품을 섭취했을 때에 비해 여러 식품 및 음식으로 구성된 혼합 식사에서 혈당반응이 달라지기 때문에 혼합 식사의 혈당 지수가 단순히 개별 식품의 혈당지수의 합이 아니라는 점 에서 제한점이 있다 [23]. 또한, 혈당지수 또는 혈당부하지 수가 낮은 식품은 탄수화물 함량은 낮지만 단백질과 지질 의 함량이 높아지는 경향이 있으므로, 전체 식사에 혈당지 수를 적용할 때에는 탄수화물의 양뿐만 아니라 함께 섭취 하는 다른 다량영양소 및 식이섬유의 섭취도 같이 고려하 는 것이 중요하다 [24-26].
이러한 단일 식품의 혈당지수로 추정한 식사 (혼합식)의 혈당지수 예측의 한계를 극복하고자 선행연구에서 한국인 을 대상으로 혼합식 섭취 후의 혈당변화량을 토대로 GL 예측모델 (estimated Glycemic Load, eGL)을 개발하였다 [27,28]. 본 연구에서는 이를 활용하여 한국 성인의 식사를 평가하고, 대사질환 지표와의 연관성을 규명하여 당흡수 지수 (eGL)의 유용성을 제시하고자 하였다.
연구방법
연구 대상
본 연구는 2013 ~ 2016년 국민건강영양조사 참여자 중 1일 24시간 회상법 조사를 완료한 만 19세 이상 성인 21,499명 을 대상자로 선정하였다. 이 중 하루 에너지 섭취량이 500 kcal 미만이거나 5,000 kcal를 초과하는 대상자 (396명) [29,30]와 다른 음식은 섭취하지 않고 소주만 섭취하여 다 량영양소 섭취량이 존재하지 않는 대상자 (1명)와 신체계 측 및 생화학적 지표에 대한 정보가 없는 대상자 (2,755 명), 임신 및 수유부 (188명)를 제외한 총 18,159명 (남자 : 7,606명, 여자 : 10,553명)을 최종 분석대상자 1 (Sample
1)로 선정하여 당흡수지수 (eGL)의 성별 · 연령별 분포 및 다량영양소 섭취량과의 상관성을 살펴보았다.
이 중 대사질환이 있는 대상자의 경우 질환의 진단 시점 또는 치료 기간 중 식사가 변화했을 가능성이 있으므로, 당흡수지수와 대사질환과의 연관성을 평가하기 위해 조사 당시에 고혈압, 이상지질혈증, 당뇨병으로 진단받았거나 관련 약을 복용하고 있는 대상자 (5,705명) 및 이와 관련 한 정보가 없는 대상자 (806명)를 추가적으로 제외하였다.
이에 더하여 혈액검사 전 공복시간이 8시간 미만인 대상 자 (233명)를 제외하여 총 11,415명 (남성 : 4,655명, 여성 : 6,760명)을 분석대상자 2 (Sample 2)로 선정하여 당흡수 지수 (eGL)와 대사질환 지표와의 연관성을 분석하였다.
국민건강영양조사는 2014년까지 질병관리본부 연구윤 리심의위원회의 승인을 받아 수행되었고 (승인번호 : 2013- 07CON-03-4C, 2013-12EXP-03-5C), 2015년부터 생명윤리 법 제2조 제1호 및 동법 시행규칙 제2조 제2항 제1호에 따 라 국가가 직접 공공복리를 위해 수행하는 연구에 해당하 여 연구윤리심의원회의 심의를 받지 않고 수행되고 있다.
당흡수지수를 이용한 식사평가
GL 예측모델 (estimated Glycemic Load, eGL)은 건강한 한국 성인을 대상으로 다량영양소의 구성비가 다양한 개 별 식품 또는 혼합 식품을 섭취하게 한 후 측정한 혈당부 하량과 탄수화물, 단백질, 지방, 식이섬유와의 회귀식을 기반으로 개발되었고 [27,28], 단일 식품의 혈당지수와 차 별화되도록 당흡수지수 (eGL)로 명칭하기로 하였다. 본 지수에 의하면 설탕 10 g과 백미밥 1공기 (210 g)의 당흡 수지수는 각각 10, 30이다. 당흡수지수의 추정식을 아래와 같이 제시하였고, 각 변수의 상수는 임의의 알파벳으로 대 체하였다.
당흡수지수 (eGL) = a + (b × (total carbohydrate-dietary fiber)) - (c × fat) - (d × protein2) - (e × dietary fiber2) 본 연구에서는 국민건강영양조사의 1일 24시간 회상법 자료를 이용하여 대상자의 끼니별 (아침, 점심, 저녁, 간 식) 탄수화물, 단백질, 지방, 식이섬유의 섭취량 (g)을 산출 하였고, 이를 토대로 끼니별 당흡수지수와 1일 총 당흡수 지수를 계산하였다. 식이섬유 섭취량 자료는 Yeon 등 [31]
에 의하여 구축된 식이섬유 성분표를 이용하여 2013년 국 민건강영양조사 자료부터 제공하고 있다. 당흡수지수의 산출을 위해 총 탄수화물 섭취량에서 식이섬유 섭취량을 뺀 탄수화물 섭취량을 계산해야 하는데, 일부 식품에서 식 이섬유의 함량이 탄수화물의 함량에 비해 높아 음수값이 발생하여, 이러한 경우에 한해서만 식이섬유의 값을 탄수
356 /혈당부하지수 예측모델을 이용한 식사평가 및 대사질환 지표
화물 값으로 대체하여 사용하였으며, 24시간 회상법 자료 에 출현한 전체 식품 2,659개 중 90개 (3.4%)였다.
식품군 섭취량 평가
당흡수지수 수준에 따른 대상자의 식사유형을 평가하기 위하여 대상자가 섭취한 식품을 곡류 (300 kcal/회), 고기
· 생선 · 달걀 · 콩류 (100 kcal/회), 채소류 (15 kcal/회), 과 일류 (50 kcal/회), 우유 · 유제품 (125 kcal/회)의 다섯 개의 그룹으로 분류하고, 각 식품군별 섭취횟수를 보건복지부 의 “2015 한국인 영양소 섭취기준”의 생애주기별 권장식 사패턴에 제시되어 있는 식품군별 섭취 횟수와 비교하여 권장섭취횟수 대비 섭취비율을 산출하였다 [32]. 권장식사 패턴은 대상자의 성별· 연령별 기준 에너지에 따라 적용 하였고, 우유 및 유제품을 1회 권장하고 있는 패턴을 사용 하였다.
신체계측 및 생화학적 검사
대상자의 신체계측 및 생화학적 검사는 훈련된 조사원 이 표준화된 프로토콜에 의하여 진행하였다. 신장과 허리 둘레는 각각 신장계와 허리둘레 측정자를 이용하여 0.1 cm 간격으로 측정하였고, 체중은 체중계를 이용하여 0.1 kg 간격으로 측정하였다. 신장 및 체중을 이용하여 체질량 지수 (body mass index, BMI) (kg/m2)를 계산하였다. 혈압 은 앉은 상태로 5분 이상 안정기를 가진 후 3회 측정하였 고, 두 번째와 세 번째 측정치의 평균을 사용하였다. 혈액 검사를 통해 공복시간이 8시간 이상인 대상자의 총콜레스 테롤, HDL-콜레스테롤, 중성지방, 혈당을 측정하였다. 저 밀도지질단백질 (low-density lipoprotein, LDL)-콜레스테 롤은 중성지방이 400 mg/dl 미만인 대상자에 한하여 Friedwald의 공식에 따라 계산하였다 [33].
사회경제적 특성 및 생활습관
대상자의 사회경제적 특성으로 교육수준 및 소득수준을 포함하였고, 생활습관 변수로 신체활동 실천율, 음주상태, 흡연상태를 포함하였다. 교육수준은 중학교 졸업 이하, 고 등학교 졸업, 대학교 졸업 이상으로 분류하였고, 소득수준 은 가구소득 사분위수를 이용하여 하, 중하, 중상, 상으로 분류하였다. 신체활동 실천율은 중강도 신체활동을 일주 일에 2시간 30분 이상 또는 고강도 신체활동을 1시간 15 분 이상 또는 중강도와 고강도 신체활동을 혼합하여 각 활 동에 상당하는 시간을 실천한 대상자의 비율로 정의하였 다. 음주상태의 경우 최근 1년 동안 월 1회 이상 음주한 대상자 중 1회 평균 음주량이 남자 7잔 이상, 여자 5잔 이 상이면서 주 2회 이상 음주하는 대상자를 고위험음주자로
정의하였다. 흡연상태는 평생 담배 5갑 (100개비) 이상 피 웠고 현재 담배를 피우는 경우 “현재 흡연자”로, 5갑 이상 피웠으나 현재 피우지 않는 경우는 “과거 흡연자”로 정의 하였다.
대사질환지표 정의
본 연구에서 대사질환은 대사증후군, 이상지질혈증, 고 혈압, 제2형 당뇨병으로 정의하였고, 대사증후군과 이상지 질혈증을 구성하고 있는 각 세부요소들도 포함하였다. 대 사증후군도 미국 National Cholesterol Education Program (NCEP)의 Adult Treatment Panel (ATP) III의 기준에 따라 정의하였으나 [34], 복부비만의 경우 대한비만학회의 기준 을 적용하였다 [35]. 복부비만은 허리둘레가 남자 90 cm 이상, 여자 85 cm 이상인 경우, 고혈압은 수축기혈압이 130 mmHg 이상이거나 이완기혈압이 85 mmHg 이상인 경우, 저HDL-콜레스테롤혈증은 남자 < 40 mg/dL, 여자
< 50 mg/dL인 경우, 고중성지방혈증은 중성지방이 150 mg/dL 이상인 경우, 고혈당은 공복혈당이 100 mg/dL 이 상인 경우로 정의하였고, 다섯 개의 요소 중 3개 이상에 해당할 경우 대사증후군으로 정의하였다. 이상지질혈증은 미국 NCEP-ATP III의 기준 [36]과 선행연구 [37]에 따라 고콜레스테롤혈증 (총콜레스테롤 ≥ 240 mg/dL), 고중성지 방혈증 (중성지방 ≥ 200 mg/dL), 고LDL-콜레스테롤혈증 (LDL-콜레스테롤 ≥ 160 mg/dL), 저HDL-콜레스테롤혈증 (HDL-콜레스테롤 남자 < 40 mg/dL, 여자 < 50 mg/dL) 중 한 가지 이상에 해당할 경우로 정의하였다. 고혈압은 수축 기혈압 140 mmHg 이상이거나 이완기혈압 90 mmHg 이 상인 경우로 정의하였고, 제2형 당뇨병의 경우 공복혈당 이 126 mg/dl 이상인 경우를 판별하였다.
통계처리
모든 통계적인 분석은 SAS (Statistical Analysis System version 9.4, SAS Institute, Cary, NC, USA) 프로그램을 이 용하여 실시하였고, 국민건강영양조사의 복합표본설계 (complex sampling design) 특성을 반영하여 분산추정층 (strata), 집락추출변수 (cluster), 가중치 (weight)를 적용하 여 분석하였다.
연령, 영양소 및 식품군 섭취량 등의 연속변수는 평균과 표준오차 (standard error, SE)로 제시하였고, 사회경제적 특성 및 생활습관 등의 범주형 변수는 백분율 (%)로 제시 하였다. 1일 총 당흡수지수 및 끼니별 당흡수지수와 다량 영양소와의 상관성을 분석하기 위해 당흡수지수가 정규분 포하지 않은 점을 고려하여 성별로 Spearman 순위상관분 석을 실시하였고, 연령과 총 에너지 섭취량을 보정한 상관
(A)
(B)
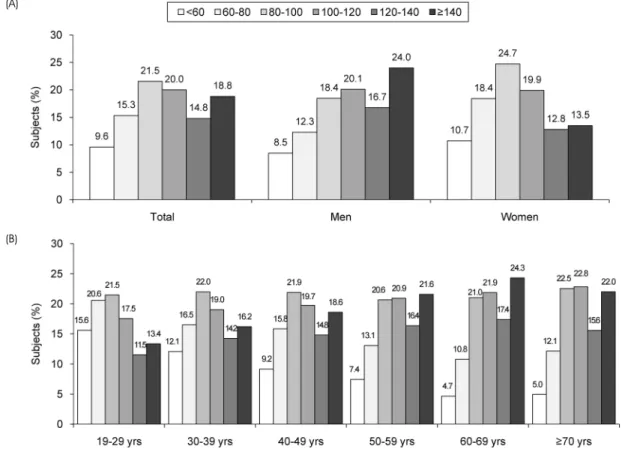
Fig. 1. Distribution of estimated glycemic load among Korean adults by sex (A) and age groups (B) using the data from 2013 ~ 2016 KNHANES. The complex sampling design parameters of the Korea National Health and Nutrition Examination Survey were used.
계수를 산출하였다. 본 연구에서 추정한 당흡수지수는 탄 수화물, 단백질, 지방 및 식이섬유 섭취량을 고려한 지표 로 개인의 총 에너지 섭취량에 영향을 받으므로 잔차모델 (residual method)을 사용하여 총 에너지 섭취량을 보정하 였다. 잔차보정된 1일 총 당흡수지수는 성별로 5분위수로 분류하여 영양소 및 식품군 섭취량과 대사질환 지표와의 관련성을 분석하였다. 1일 총 당흡수지수에 따른 성별 일 반적 특성의 차이는 연속형 변수의 경우 일반선형모형 (general linear model)을, 범주형 변수의 경우 카이제곱검 정을 이용하여 검정하였다. 1일 총 당흡수지수에 따른 영 양소 및 식품군 섭취량과 신체계측 및 생화학적 지표의 수 준은 일반선형모형을 이용하여 대상자의 연령, 사회경제 적 특성, 생활습관 등을 보정하여 산출하였다. 다중로지스 틱 회귀분석을 이용하여 1일 총 당흡수지수 5분위수에 따 라 대사증후군, 이상지질혈증, 고혈압, 제2형 당뇨병의 교 차비 (odds ratio, OR)와 95% 신뢰구간 (95% confidence interval, 95% CI)를 산출하였다. 선행연구에 따라 한국인 의 대사증후군, 고혈압, 당뇨병에 영향을 미치며 [38,39], 당흡수지수 수준에 따라 유의한 차이가 있었던 연령, 교육 수준, 소득수준, 흡연상태, 음주상태, 신체활동 수준, BMI,
총 에너지섭취량을 보정변수로 포함하였다. 모든 통계적 유의수준은 α = 0.05를 기준으로 하여 양측 검정을 하였다.
결 과
한국 성인 식사의 당흡수지수 분포
만 19세 이상 한국 성인 총 18,159명의 1일 총 당흡수지 수는 평균 107.5 (표준오차 0.4)이었고, 남자는 113.8, 여자 는 101.1이었다. 당흡수지수를 60 미만, 60 ~ 80, 80 ~ 100, 100 ~ 120, 120 ~ 140, 140 이상의 6개의 구간으로 분류하 여 성별· 연령별 분포를 살펴본 결과를 Fig. 1에 제시하였 다. 전체 대상자 중 당흡수지수가 60 미만인 대상자가 9.6%인데 반하여, 140 이상인 비율은 18.8%로 높았고, 남 자는 24.0%로 여자의 13.5%에 비해 140 이상인 비율이 더 높았다 (Fig. 1A). 1일 총 당흡수지수의 분포는 연령 그룹에 따라서도 차이를 보였는데, 20대 성인에서 140 이상인 비 율은 13.4%였으나 70세 이상 노인의 경우 22.0%로 20대 성인에 비해 1.6배 높았다 (Fig. 1B). 반면, 당흡수지수가 60 미만인 비율은 20대 성인에서 15.6%, 70세 이상 노인 에서 5.0%로 연령에 따라 감소하는 경향을 보였다.
358 /
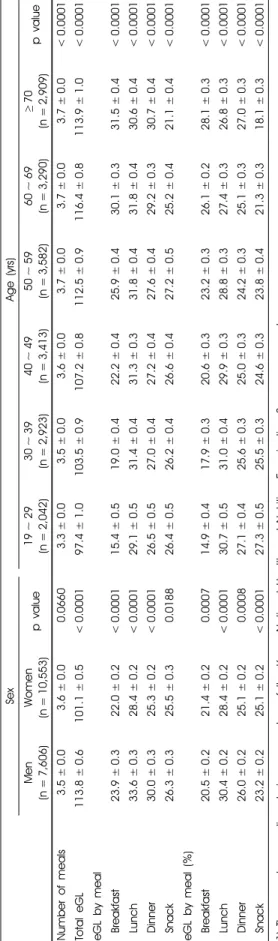
SexAge (yrs) Men (n=7,606)Women (n=10,553)p value19~29 (n=2,042)30~39 (n=2,923)40~49 (n=3,413)50~59 (n=3,582)60~69 (n=3,290)≥70 (n=2,909)p value Number of meals3.5±0.03.6±0.00.06603.3±0.03.5±0.03.6±0.03.7±0.03.7±0.03.7±0.0<0.0001 Total eGL113.8±0.6101.1±0.5<0.000197.4±1.0103.5±0.9107.2±0.8112.5±0.9116.4±0.8113.9±1.0<0.0001 eGL by meal Breakfast23.9±0.322.0±0.2<0.000115.4±0.519.0±0.422.2±0.425.9±0.430.1±0.331.5±0.4<0.0001 Lunch33.6±0.328.4±0.2<0.000129.1±0.531.4±0.431.3±0.331.8±0.431.8±0.430.6±0.4<0.0001 Dinner30.0±0.325.3±0.2<0.000126.5±0.527.0±0.427.2±0.427.6±0.429.2±0.330.7±0.4<0.0001 Snack26.3±0.325.5±0.30.018826.4±0.526.2±0.426.6±0.427.2±0.525.2±0.421.1±0.4<0.0001 eGL by meal (%) Breakfast20.5±0.221.4±0.20.000714.9±0.417.9±0.320.6±0.323.2±0.326.1±0.228.1±0.3<0.0001 Lunch30.4±0.228.4±0.2<0.000130.7±0.531.0±0.429.9±0.328.8±0.327.4±0.326.8±0.3<0.0001 Dinner26.0±0.225.1±0.20.000827.1±0.425.6±0.325.0±0.324.2±0.325.1±0.327.0±0.3<0.0001 Snack23.2±0.225.1±0.2<0.000127.3±0.525.5±0.324.6±0.323.8±0.421.3±0.318.1±0.3<0.0001 1) The complex sampling design parameters of the Korea National Health and Nutrition Examination Survey were used. 2) All values are presented as mean±standard error.
Table 1. The mean daily total estimated glycemic load (eGL) and eGL at each meal by sex and age groups1)2)
Men (n = 7,606) Total eGL Number of meals eGL of breakfast eGL of lunch eGL of dinner eGL of snack
Carbohydrate (g) 0.8626** 0.2239** 0.3766** 0.3722** 0.5656** 0.3766**
Protein (g) -0.4382** 0.0395* -0.1456** -0.2409** -0.3152** -0.1867**
Fat (g) -0.4517** -0.0424* -0.2668** -0.2756** -0.3184** -0.0857**
Fiber (g) 0.1131** 0.1599** 0.0728** -0.0332* 0.0322* 0.1214**
Carbohydrate (% E)2) 0.7884** 0.1263** 0.3689** 0.3997** 0.5465** 0.2808**
Protein (% E) -0.6729** -0.0572** -0.2450** -0.3064** -0.4725** -0.3293**
Fat (% E) -0.6142** -0.1112** -0.3284** -0.3282** -0.4243** -0.1759**
Women (n = 10,553) Total eGL Number of meals eGL of breakfast eGL of lunch eGL of dinner eGL of snack
Carbohydrate (g) 0.8780** 0.1460** 0.3339** 0.3754** 0.4667** 0.2995**
Protein (g) -0.5547** 0.0311* -0.1658** -0.2353** -0.3135** -0.2291**
Fat (g) -0.6296** -0.0552** -0.2911** -0.3191** -0.3660** -0.1368**
Fiber (g) 0.0164 0.1203** 0.0077 -0.0501** -0.0491** 0.0874**
Carbohydrate (% E) 0.8175** 0.0887** 0.3305** 0.3807** 0.4649** 0.2576**
Protein (% E) -0.6382** -0.0023 -0.1977** -0.2536** -0.3589** -0.2903**
Fat (% E) -0.7032** -0.0919** -0.3153** -0.3420** -0.4033** -0.1809**
1) Adjusted for age and total energy intake by using Spearman rank-order correlation.
2) percentage of total energy
*p < 0.05, **p < 0.0001
Table 2. Partial spearman correlation coefficients between estimated glycemic load (eGL) and macronutrient intakes by sex1)
Energy-adjusted daily total eGL2)
Men Quintile 1
(n = 931)
Quintile 2 (n = 931)
Quintile 3 (n = 931)
Quintile 4 (n = 931)
Quintile 5
(n = 931) p value
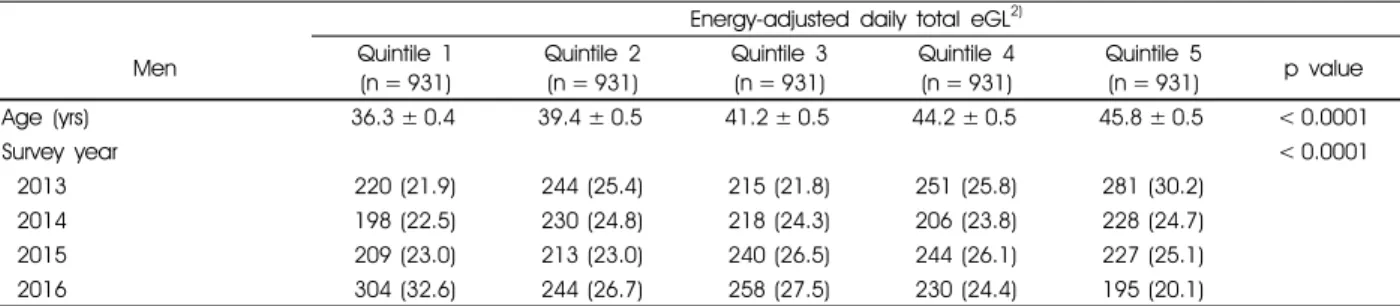
Age (yrs) 36.3 ± 0.4 39.4 ± 0.5 41.2 ± 0.5 44.2 ± 0.5 45.8 ± 0.5 < 0.0001
Survey year < 0.0001
2013 220 (21.9) 244 (25.4) 215 (21.8) 251 (25.8) 281 (30.2)
2014 198 (22.5) 230 (24.8) 218 (24.3) 206 (23.8) 228 (24.7)
2015 209 (23.0) 213 (23.0) 240 (26.5) 244 (26.1) 227 (25.1)
2016 304 (32.6) 244 (26.7) 258 (27.5) 230 (24.4) 195 (20.1)
1) The complex sampling design parameters of the Korea National Health and Nutrition Examination Survey were used. All values are presented as mean ± standard error for continuous variables or n (%) for categorical variables.
2) Daily total eGL was energy-adjusted by residual method.
3) Physical activity: “yes”, performed vigorous-intensity activities for at least 75 min, or moderate-intensity activities for at least 150 min, or an equivalent combination of moderate- and vigorous-intensity activity during a typical week
4) Alcohol consumption: "none", no consumption of any type of alcoholic beverage or drank less than once a month over the past year,
"moderate", drank alcoholic beverages more than once a month over the past year, "high", drank more than 7 glasses of alcoholic beverages for men and 5 glasses of alcoholic beverages for women per occasion more than two times per week
5) Smoking: “never”, never smoked cigarettes of smoked < 100 cigarettes in lifetime, "former", smoked ≥ 100 cigarettes in lifetime but current non-smoker, "current", smoked ≥ 100 cigarette in lifetime and current smoker
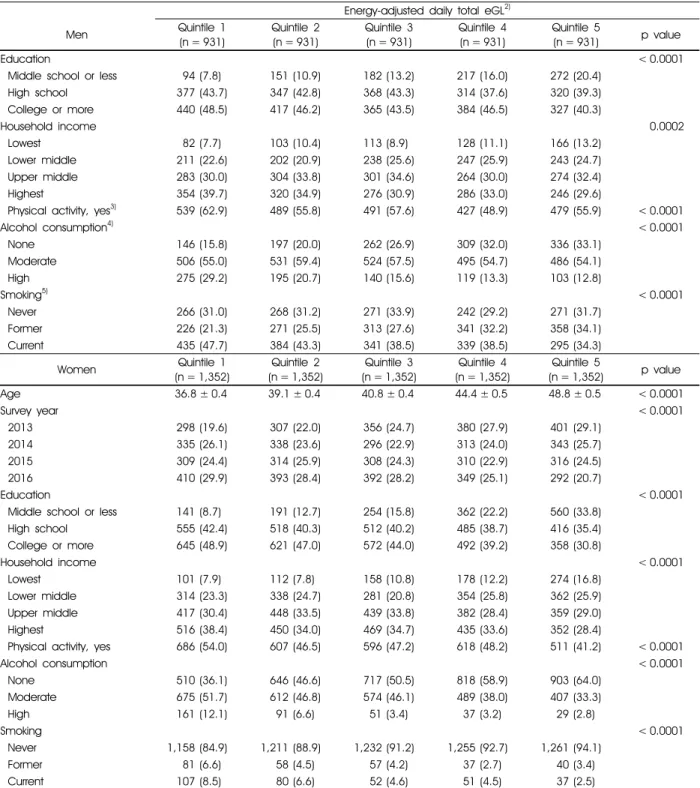
Table 3. General characteristics of study participants according to quintile of energy-adjusted daily total estimated glycemic load (eGL) by sex1)
끼니별 당흡수지수 분포와 다량영양소와의 상관성 연구 대상자들의 성별· 연령별 끼니별 당흡수지수의 분 포를 Table 1에 제시하였다. 1일 총 당흡수지수를 끼니별 로 분류하였을 때, 전체 대상자의 아침, 점심, 저녁, 간식 으로부터 얻는 당흡수지수는 각각 23.0, 31.0, 27.7, 25.9였 다. 남녀 모두 총 당흡수지수에서 점심이 차지하는 비율이 약 30%정도로 가장 높았고, 그 다음으로는 저녁, 간식, 아 침 순으로 높았다. 연령이 높아질수록 아침으로부터 얻는 당흡수지수는 증가하는 경향을 보였고, 간식으로부터 얻 는 당흡수지수는 감소하는 경향을 보였다.
1일 총 당흡수지수 및 끼니별 당흡수지수와 다량영양소 섭취량과의 상관성을 성별에 따라 나누어 살펴보았다
(Table 2). 대상자의 연령과 총 에너지 섭취량을 보정하였 을 때, 남녀 모두에서 탄수화물 섭취량 및 에너지섭취비율 은 총 당흡수지수 및 끼니별 당 흡수지수와 양의 상관성이 있었고, 단백질과 지방 섭취량 및 에너지섭취비율과는 음 의 상관성이 있었다. 식이섬유 섭취량은 남자에서만 총 당 흡수지수와 유의한 상관관계가 있었고, 끼니별 당흡수지 수와는 성별로 다른 상관관계를 나타냈다.
당흡수지수에 따른 대상자의 일반적 특성
당흡수지수와 대사질환 지표와의 연관성을 살펴보기 위 하여, 조사 당시에 고혈압, 당뇨병, 이상지질혈증으로 진 단을 받은 적이 있거나 약을 복용하고 있는 대상자를 제외
360 /혈당부하지수 예측모델을 이용한 식사평가 및 대사질환 지표
Energy-adjusted daily total eGL2)
Men Quintile 1
(n = 931)
Quintile 2 (n = 931)
Quintile 3 (n = 931)
Quintile 4 (n = 931)
Quintile 5
(n = 931) p value
Education < 0.0001
Middle school or less 94 (7.8) 151 (10.9) 182 (13.2) 217 (16.0) 272 (20.4)
High school 377 (43.7) 347 (42.8) 368 (43.3) 314 (37.6) 320 (39.3)
College or more 440 (48.5) 417 (46.2) 365 (43.5) 384 (46.5) 327 (40.3)
Household income 0.0002
Lowest 82 (7.7) 103 (10.4) 113 (8.9) 128 (11.1) 166 (13.2)
Lower middle 211 (22.6) 202 (20.9) 238 (25.6) 247 (25.9) 243 (24.7)
Upper middle 283 (30.0) 304 (33.8) 301 (34.6) 264 (30.0) 274 (32.4)
Highest 354 (39.7) 320 (34.9) 276 (30.9) 286 (33.0) 246 (29.6)
Physical activity, yes3) 539 (62.9) 489 (55.8) 491 (57.6) 427 (48.9) 479 (55.9) < 0.0001
Alcohol consumption4) < 0.0001
None 146 (15.8) 197 (20.0) 262 (26.9) 309 (32.0) 336 (33.1)
Moderate 506 (55.0) 531 (59.4) 524 (57.5) 495 (54.7) 486 (54.1)
High 275 (29.2) 195 (20.7) 140 (15.6) 119 (13.3) 103 (12.8)
Smoking5) < 0.0001
Never 266 (31.0) 268 (31.2) 271 (33.9) 242 (29.2) 271 (31.7)
Former 226 (21.3) 271 (25.5) 313 (27.6) 341 (32.2) 358 (34.1)
Current 435 (47.7) 384 (43.3) 341 (38.5) 339 (38.5) 295 (34.3)
Women Quintile 1
(n = 1,352)
Quintile 2 (n = 1,352)
Quintile 3 (n = 1,352)
Quintile 4 (n = 1,352)
Quintile 5
(n = 1,352) p value
Age 36.8 ± 0.4 39.1 ± 0.4 40.8 ± 0.4 44.4 ± 0.5 48.8 ± 0.5 < 0.0001
Survey year < 0.0001
2013 298 (19.6) 307 (22.0) 356 (24.7) 380 (27.9) 401 (29.1)
2014 335 (26.1) 338 (23.6) 296 (22.9) 313 (24.0) 343 (25.7)
2015 309 (24.4) 314 (25.9) 308 (24.3) 310 (22.9) 316 (24.5)
2016 410 (29.9) 393 (28.4) 392 (28.2) 349 (25.1) 292 (20.7)
Education < 0.0001
Middle school or less 141 (8.7) 191 (12.7) 254 (15.8) 362 (22.2) 560 (33.8)
High school 555 (42.4) 518 (40.3) 512 (40.2) 485 (38.7) 416 (35.4)
College or more 645 (48.9) 621 (47.0) 572 (44.0) 492 (39.2) 358 (30.8)
Household income < 0.0001
Lowest 101 (7.9) 112 (7.8) 158 (10.8) 178 (12.2) 274 (16.8)
Lower middle 314 (23.3) 338 (24.7) 281 (20.8) 354 (25.8) 362 (25.9)
Upper middle 417 (30.4) 448 (33.5) 439 (33.8) 382 (28.4) 359 (29.0)
Highest 516 (38.4) 450 (34.0) 469 (34.7) 435 (33.6) 352 (28.4)
Physical activity, yes 686 (54.0) 607 (46.5) 596 (47.2) 618 (48.2) 511 (41.2) < 0.0001
Alcohol consumption < 0.0001
None 510 (36.1) 646 (46.6) 717 (50.5) 818 (58.9) 903 (64.0)
Moderate 675 (51.7) 612 (46.8) 574 (46.1) 489 (38.0) 407 (33.3)
High 161 (12.1) 91 (6.6) 51 (3.4) 37 (3.2) 29 (2.8)
Smoking < 0.0001
Never 1,158 (84.9) 1,211 (88.9) 1,232 (91.2) 1,255 (92.7) 1,261 (94.1)
Former 81 (6.6) 58 (4.5) 57 (4.2) 37 (2.7) 40 (3.4)
Current 107 (8.5) 80 (6.6) 52 (4.6) 51 (4.5) 37 (2.5)
1) The complex sampling design parameters of the Korea National Health and Nutrition Examination Survey were used. All values are presented as mean ± standard error for continuous variables or n (%) for categorical variables.
2) Daily total eGL was energy-adjusted by residual method.
3) Physical activity: “yes”, performed vigorous-intensity activities for at least 75 min, or moderate-intensity activities for at least 150 min, or an equivalent combination of moderate- and vigorous-intensity activity during a typical week
4) Alcohol consumption: "none", no consumption of any type of alcoholic beverage or drank less than once a month over the past year,
"moderate", drank alcoholic beverages more than once a month over the past year, "high", drank more than 7 glasses of alcoholic beverages for men and 5 glasses of alcoholic beverages for women per occasion more than two times per week
5) Smoking: “never”, never smoked cigarettes of smoked < 100 cigarettes in lifetime, "former", smoked ≥ 100 cigarettes in lifetime but current non-smoker, "current", smoked ≥ 100 cigarette in lifetime and current smoker
Table 3. continued
Energy-adjusted daily total eGL3)
Men Quintile 1
(n = 931)
Quintile 2 (n = 931)
Quintile 3 (n = 931)
Quintile 4 (n = 931)
Quintile 5
(n = 931) p for trend4)
Total eGL 58.9 ± 0.8 95.2 ± 0.4 115.6 ± 0.3 134.8 ± 0.3 171.0 ± 0.9 < 0.0001
eGL by meal
Breakfast 13.4 ± 0.6 21.3 ± 0.6 23.5 ± 0.6 28.6 ± 0.7 35.6 ± 0.9 < 0.0001
Lunch 21.0 ± 0.7 29.8 ± 0.6 34.5 ± 0.6 38.2 ± 0.6 46.7 ± 0.9 < 0.0001
Dinner 12.0 ± 0.6 22.7 ± 0.6 31.6 ± 0.6 37.5 ± 0.7 48.7 ± 0.8 < 0.0001
Snack 12.5 ± 0.6 21.4 ± 0.6 26.0 ± 0.6 30.5 ± 0.8 39.9 ± 1.1 < 0.0001
Energy (kcal/d) 2,493.1 ± 37.5 2,218.7 ± 33.4 2,155.2 ± 28.8 2,312.1 ± 28.4 2,736.0 ± 30.7 < 0.0001 Energy (% of EER5)) 100.6 ± 1.4 90.1 ± 1.3 87.5 ± 1.1 93.4 ± 1.1 110.5 ± 1.2 < 0.0001 Carbohydrate (g/d) 238.8 ± 2.6 307.7 ± 1.7 344.2 ± 1.5 381.9 ± 1.4 449.6 ± 2.2 < 0.0001
Protein (g/d) 103.0 ± 1.4 89.8 ± 1.0 81.8 ± 0.7 76.6 ± 0.7 63.9 ± 0.7 < 0.0001
Fat (g/d) 68.5 ± 1.1 60.1 ± 0.8 52.9 ± 0.7 46.5 ± 0.7 30.4 ± 0.7 < 0.0001
Dietary fiber (g/d) 22.4 ± 0.5 24.0 ± 0.4 24.1 ± 0.4 24.6 ± 0.4 24.8 ± 0.4 0.0001
Percentage energy from (%)
Carbohydrate 51.5 ± 0.3 59.8 ± 0.2 65.2 ± 0.2 69.6 ± 0.2 76.5 ± 0.2 < 0.0001
Protein 19.9 ± 0.2 16.4 ± 0.1 14.6 ± 0.1 13.3 ± 0.1 11.4 ± 0.1 < 0.0001
Fat 28.6 ± 0.3 23.8 ± 0.3 20.2 ± 0.2 17.1 ± 0.2 12.1 ± 0.2 < 0.0001
Women Quintile 1
(n = 1,352)
Quintile 2 (n = 1,352)
Quintile 3 (n = 1,352)
Quintile 4 (n = 1,352)
Quintile 5
(n = 1,352) p for trend
Total eGL 57.7 ± 0.7 86.7 ± 0.5 101.3 ± 0.5 115.6 ± 0.5 141.6 ± 0.7 < 0.0001
eGL by meal
Breakfast 11.0 ± 0.5 15.2 ± 0.6 18.9 ± 0.7 22.2 ± 0.6 27.0 ± 0.7 < 0.0001
Lunch 17.5 ± 0.6 25.1 ± 0.7 28.6 ± 0.7 32.8 ± 0.7 38.2 ± 0.8 < 0.0001
Dinner 13.2 ± 0.6 23.0 ± 0.6 27.2 ± 0.7 30.9 ± 0.6 38.0 ± 0.7 < 0.0001
Snack 16.0 ± 0.7 23.4 ± 0.8 26.7 ± 0.8 29.6 ± 0.9 38.5 ± 1.1 < 0.0001
Energy (kcal/d) 1,846.3 ± 30.3 1,639.2 ± 30.0 1,635.7 ± 29.5 1,739.9 ± 30.2 2,049.9 ± 31.4 < 0.0001
Energy (% of EER) 95.2 ± 1.5 84.9 ± 1.5 84.3 ± 1.5 89.5 ± 1.5 106.4 ± 1.6 < 0.0001
Carbohydrate (g/d) 199.8 ± 2.1 251.2 ± 1.5 276.1 ± 1.5 300.0 ± 1.7 347.5 ± 1.8 < 0.0001
Protein (g/d) 77.0 ± 0.9 63.7 ± 0.8 57.9 ± 0.7 52.9 ± 0.8 43.1 ± 0.7 < 0.0001
Fat (g/d) 56.5 ± 0.8 45.8 ± 0.7 39.2 ± 0.7 31.1 ± 0.7 16.7 ± 0.7 < 0.0001
Dietary fiber (g/d) 18.8 ± 0.4 20.1 ± 0.4 20.3 ± 0.4 19.9 ± 0.5 19.8 ± 0.4 0.0337
Percentage energy from (%)
Carbohydrate 51.8 ± 0.3 61.3 ± 0.2 67.0 ± 0.2 72.3 ± 0.2 79.3 ± 0.3 < 0.0001
Protein 18.7 ± 0.2 15.2 ± 0.2 13.6 ± 0.2 12.5 ± 0.2 10.7 ± 0.2 < 0.0001
Fat 29.5 ± 0.3 23.6 ± 0.3 19.4 ± 0.3 15.2 ± 0.3 10.0 ± 0.3 < 0.0001
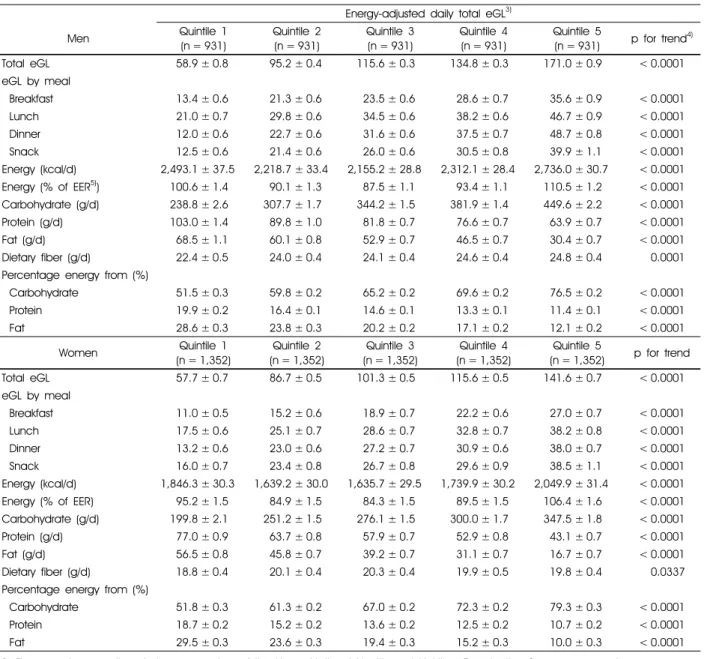
1) The complex sampling design parameters of the Korea National Health and Nutrition Examination Survey were used.
2) All values are presented as adjusted mean ± standard error after adjusting for age, body mass index, education, household income, physical activity, smoking, alcohol consumption, and total energy intake (except energy intake).
3) Daily total eGL was energy-adjusted by residual method.
4) P for trends were obtained from a general linear model.
5) EER: Estimated energy requirement
Table 4. Mean estimated glycemic load (eGL) of mixed meal and macronutrient intake of study participants according to quintile of energy-adjusted daily total eGL by sex1)2)
한 11,415명의 잔차 보정한 1일 총 당흡수지수 값을 이용 하여 대상자를 성별로 5분위수로 분류하였다. 당흡수지수 에 따른 대상자의 일반적 특성은 Table 3에 제시하였다.
남녀 모두에서 1일 총 당흡수지수에 따라 연령과 교육수 준, 가구소득수준에 유의한 차이가 있었다. 1일 총 당흡수 지수가 높을수록 대상자의 연령이 증가하였고 (p < 0.0001 for all), 교육수준 (p < 0.0001 for all) 및 가구소득수준 (남 : p = 0.0002, 여 : p < 0.0001)은 낮았다. 신체활동수준과 음주
및 흡연상태도 1일 총 당흡수지수에 따라 차이가 있었는데, 당흡수지수가 가장 높은 남녀는 가장 낮은 남녀에 비하여 신체활동을 실천하는 대상자의 비율이 낮았고, 고위험음 주자와 현재흡연자의 비율이 낮았다 (p < 0.0001 for all).
당흡수지수에 따른 영양소 및 식품군 섭취 상태 대상자의 당흡수지수에 따른 식사유형을 평가하기 위하 여 1일 총 당흡수지수 5분위수에 따른 영양소 (Table 4)
Energy-adjusted daily total eGL4)
Men Quintile 1
(n = 931)
Quintile 2 (n = 931)
Quintile 3 (n = 931)
Quintile 4 (n = 931)
Quintile 5
(n = 931) p for trend5)
BMI (kg/m2)6) 24.9 ± 0.2 25.1 ± 0.2 24.9 ± 0.2 24.6 ± 0.2 24.7 ± 0.2 0.0028
Waist circumference (cm) 85.5 ± 0.4 84.4 ± 0.3 84.5 ± 0.4 84.5 ± 0.4 83.8 ± 0.4 0.0009 Total cholesterol (mg/dL) 190.5 ± 1.2 191.6 ± 1.3 189.3 ± 1.2 190.4 ± 1.3 191.9 ± 1.5 0.8603 HDL-cholesterol (mg/dL)7) 49.2 ± 0.4 48.5 ± 0.4 47.8 ± 0.4 47.8 ± 0.4 47.8 ± 0.4 0.0036 LDL-cholesterol (mg/dL)8) 112.1 ± 1.1 113.4 ± 1.2 111.8 ± 1.1 113.0 ± 1.2 114.7 ± 1.3 0.2859 Triglycerides (mg/dL) 163.5 ± 6.1 163.0 ± 4.6 158.5 ± 4.8 162.8 ± 4.5 160.9 ± 5.0 0.5397 Fasting glucose (mg/dL) 96.8 ± 0.5 98.4 ± 0.6 98.6 ± 0.8 97.4 ± 0.5 98.2 ± 0.7 0.2693
SBP (mmHg)9) 119.1 ± 0.5 118.9 ± 0.5 119.5 ± 0.5 119.4 ± 0.5 118.7 ± 0.5 0.7468
DBP (mmHg)10) 77.7 ± 0.4 78.0 ± 0.4 78.3 ± 0.3 77.9 ± 0.4 77.9 ± 0.4 0.7978
Women Quintile 1
(n = 1,352)
Quintile 2 (n = 1,352)
Quintile 3 (n = 1,352)
Quintile 4 (n = 1,352)
Quintile 5
(n = 1,352) p for trend
BMI (kg/m2) 23.3 ± 0.2 23.3 ± 0.2 23.4 ± 0.2 23.1 ± 0.2 23.1 ± 0.2 0.0650
Waist circumference (cm) 78.6 ± 0.4 78.5 ± 0.4 78.9 ± 0.4 78.4 ± 0.5 78.3 ± 0.4 0.4217 Total cholesterol (mg/dL) 194.1 ± 1.4 194.7 ± 1.5 193.3 ± 1.5 191.8 ± 1.5 190.8 ± 1.5 0.0052 HDL-cholesterol (mg/dL) 57.8 ± 0.6 57.4 ± 0.6 56.7 ± 0.6 56.5 ± 0.6 56.0 ± 0.6 0.0008 LDL-cholesterol (mg/dL) 113.3 ± 1.2 114.1 ± 1.3 113.2 ± 1.3 112.0 ± 1.3 111.7 ± 1.3 0.1420 Triglycerides (mg/dL) 119.2 ± 3.4 119.3 ± 3.5 120.3 ± 3.1 121.6 ± 3.4 118.7 ± 3.6 0.6054 Fasting glucose (mg/dL) 93.4 ± 0.5 93.1 ± 0.5 94.2 ± 0.6 94.1 ± 0.5 93.9 ± 0.6 0.2396
SBP (mmHg) 112.0 ± 0.5 112.2 ± 0.5 112.8 ± 0.5 113.0 ± 0.6 112.9 ± 0.6 0.0293
DBP (mmHg) 73.1 ± 0.4 73.4 ± 0.4 73.6 ± 0.4 73.4 ± 0.4 73.2 ± 0.4 0.5375
1) The complex sampling design parameters of the Korea National Health and Nutrition Examination Survey were used.
2) All values are adjusted mean ± standard error after adjusting for age, body mass index (except the model of waist circumference), education, household income, physical activity, smoking, alcohol consumption, and total energy intake.
3) Blood sample were collected from the participants after fasting for at least 8 hours or more.
4) Daily total eGL was energy-adjusted by residual method.
5) P for trends were obtained from a general linear model.
6) BMI: body mass index 7) HDL: high-density lipoprotein
8) LDL (low-density lipoprotein)-cholesterol was calculated in accordance with the Friedewald’s formula for subjects whose triglyceride level was < 400 mg/dL.
9) DBP: diastolic blood pressure 10) SBP: systolic blood pressure
Table 5. Anthropometric and biochemical variables of study participants according to quintile of energy-adjusted daily total estimated glycemic load (eGL) by sex1)2)3)
362 /혈당부하지수 예측모델을 이용한 식사평가 및 대사질환 지표
(A) Men (B) Women
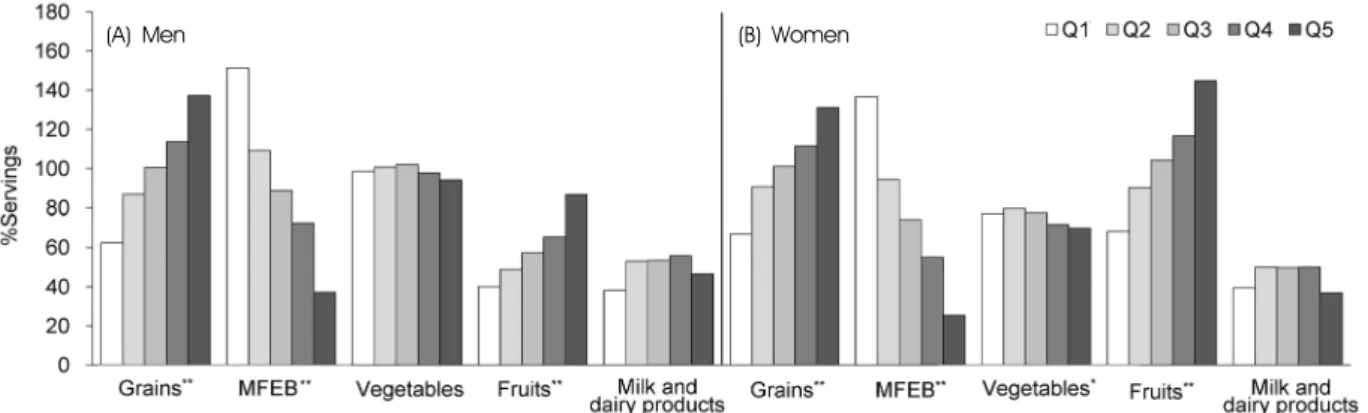
Fig. 2. Food group consumption of study participants according to quintile of energy-adjusted daily total estimated glycemic load (eGL) by sex. Q: quintile of energy-adjusted daily total eGL. %Servings = the number of servings consumed/the recommended number of servings based on the Dietary Reference Intakes for Koreans×100. MFEB: meat, fish, eggs, and beans. The complex sampling design parameters of the Korea National Health and Nutrition Examination Survey were used from a general linear model after adjusted for age, body mass index, education, household income, physical activity, smoking, alcohol consumption, and total energy intake. *p for trend
< 0.05, **p for trend < 0.0001