- 1 -
Development of Nondestructive Evaluation System for Internal Quality of Watermelon using Acoustic Wave
Dong-Soo Choi†, Young-Hee Lee, Seung-Ryul Choi, Gi-Young Kim and Jong-Min Park1 National Academy of Agricultural Science, RDA, Suwon 441-100, Korea
1Department of Bioindustrial Machinery Engineering, Pusan National University, Miryang 627-706, Korea
음파를 이용한 비파괴 수박 내부품질 판정 시스템 개발
최동수†․이영희․최승렬․김기영․박종민1
농촌진흥청 국립농업과학원, 1부산대학교 바이오산업기계공학과
Abstract
Watermelons (Citrulus vulgaris Schrad) are usually sorted manually by weight, appearance, and acoustic impulse, so grading of maturity and internal quality is subject to inaccuracies. It was necessary to develop a nondestructive evaluation technique of internal watermelon quality to reduce human error. Thus, acoustic characteristics related to internal quality factors were analyzed. Among these factors, three (ripeness, presence of an internal cavity, and blood-colored flesh) were selected for evaluation. The number of peaks and the sum of peak amplitudes for watermelons with blood-colored flesh were lower than for normal fruits. The portable evaluation system has an impact mechanism, a microphone sensor, a signal processing board, an LCD panel, and a battery. A performance test was conducted in the field. The internal quality evaluation model showed 87% prediction accuracy. Validation was conducted on 72 samples. The accuracy of quality evaluation was 83%. The quality of samples was evaluated by an inspector using conventional methods (hitting the watermelon and listening to the sounds), and then compared with prototype results. The quality evaluation accuracy of the prototype was better than that of the inspector. This nondestructive quality evaluation system could be useful in the field, warehouse, and supermarket
Key words:Watermelon, Acoustic, Internal qualities, Nondestructive
Introduction
1)
Total sales amount of watermelon for a year is around 7000∼8000 billion won that is second largest followed by red pepper. Watermelons are very important income source of farmers in Korea. The income from watermelon sales largely depends on the quality of the melon. There are four factors deciding the internal quality of watermelon that are ripeness, yellow belt, inside-cavity and blood flesh. If there were more than 20% of blood fresh melons in a field, income from the field decreases to about half of regular field. Usually, the internal quality evaluation of watermelon has been
†Corresponding author. E-mail:[email protected], Phone:82-31-290-1909, Fax:82-31-290-1900
conducted by experienced inspector, but it is lack of objectivity. Therefore, it is necessary to develop nondestructive internal quality evaluation technique to increase producer's income and customer's trust.
In order to develop nondestructive internal quality evaluation technique for watermelon, many researchers studied on acoustic and vibration characteristics of the watermelon (1-3, 6-11). Hayashi et al. (4) applied the method of acoustic impulse responses to evaluate internal quality of watermelon nondestructively. He showed that the amplitude of the internally transmitted wave was related to the firmness of the watermelon flesh and the internal wave was not observed in internally cracked ones. Kawamura et al. (5) suspended an experimental melon sample with string in the
air to prevent transfer of hitting vibration. In spectrum density obtained by Fast Fourier Transform(FFT), principal peak frequency of unripe watermelons occurred at the frequency range from 170Hz to 220 Hz, and for ripen melons the frequency occurred near 160 Hz. And he reported that the criterion for discriminating internal quality is sensitive according to size and viscosity of flesh. Chen et al. (1) theoretically analyzed the relationships among transmitted frequency, velocity and mass and internal quality of watermelon assuming that watermelon is a homogeneous elastic sphere model. And he obtained the evaluation index of internal quality (F=f (1.02-4.22V/f) 1/6). He also reported that the discrimination of the internal crack and maturity was possible by using this index. Other researchers studied on acoustic characteristics according to the internal quality of watermelon such as maturity, inside-cavity, yellow belt, and blood flesh (2,6). They showed that the first peak frequency shifted to the lower range as the ripeness of the fruit increases.
Also, they found that inside-cavity could be characterized by means of a significant damping of first peak with respect to the maximum peak at the time domain. They reported that the wave pattern at the time domain of the blood flesh watermelon showed a long vibration time, which is distance between peak to peak, and high energy at the frequency range over 850 Hz.
The purpose of this research was to develop nondestructive internal quality evaluation system of watermelon which could be portable and used in field, storage house, and supermarket etc. Acoustic impulse method is very useful to evaluate the internal quality of the fruit, nondestructively.
In this study, the nondestructive internal quality evaluation system for watermelon using acoustic impulse method was developed and its performance was tested.
Materials and Methods
Hardware design
The schematic diagram of portable nondestructive quality evaluation system which is shown in Fig. 1. That portable evaluation system has an impact mechanism, a microphone sensor, a signal processing board, LCD panel, and battery.
The portable system was designed to have small size (200×200 mm) and light weight (290 g) to use in field, storage house, and supermarket. To prevent mechanical vibration from transferring into the microphone, the microphone support unit retracts 2 mm when the system contacts the
melon. Sound pulse is generated by impact stick which is operated by a spring. Trigger also turns on micro-switch.
The acoustic wave acquired with the microphone is converted to 12-bit digital signal and then analyzed to determine the internal quality of the melon. Finally, quality decision result is displayed on the LCD screen.
1. Microphone 2. LCD 3. Microprocessor 4. Micro switch 5. 9V battery 6. Trigger
7. Compression spring 8. Impact stick 9. U-type spring 10. Triangle supporter
Fig. 1. Schematic diagram of the quality evaluation system for watermelon.
Power ON
Trigger signal?
Error ? Initialize system
and parameters
Quality decision Initialize data saving equipment
Display recent data on LCD
Display error message on LCD Display decision
result on LCD Noise removal and
pre-filtering
Detect parameters in time domain
Detect parameters in frequency domain
NO
YES
NO YES Power ON
Trigger signal?
Error ? Initialize system
and parameters
Quality decision Initialize data saving equipment
Display recent data on LCD
Display error message on LCD Display decision
result on LCD Noise removal and
pre-filtering
Detect parameters in time domain
Detect parameters in frequency domain
NO
YES
NO YES
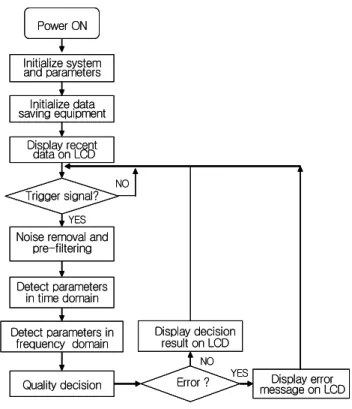
Fig. 2. Flowchart of system software.
Quality Decision Software
Software for analyzing the acoustic wave is developed with C++ language. Fig. 2 shows the flow chart of the software.
When system switch is turned on, all variables are initialized.
If acoustic wave is acquired, the signal is filtered to eliminate noise signals. The filtered signal is analyzed by using quality decision software which compares several factors in the signal with pre-defined quality indices. Finally, decision results are stored on flash memory and displayed on the LCD screen.
The quality decision software was compiled with ARM SDT v2.50 compiler and ported to the 32-bit microprocessor (KS32C41000, Samsung Co. Ltd., Korea).
Parameters for quality evaluation
Acoustic wave obtained from watermelon flesh contains some information about the internal quality of the melon.
By analyzing the acoustic wave, quality of the melon can be estimated. Several factors that determine the quality of the melon were determined by comparing the acoustic waves of different qualities of watermelons. Fig. 3 shows acoustic signals in time domain. Peak distances of ripe melon are more uniform than those of inside-cavity melon because of uniform flesh medium of the ripe melon. Fig. 3(b) shows designations, which is zero crossing point, in acoustic wave of a watermelon with inside-cavity. The zero-crossing rate of normal melon is larger then defect one because defect melon has many low-frequency components. Since attenuation of inside-cavity melon was larger than sound one, there was
(a) ripe
(b) inside-cavity Fig. 3. Detection of peak to peak distance.
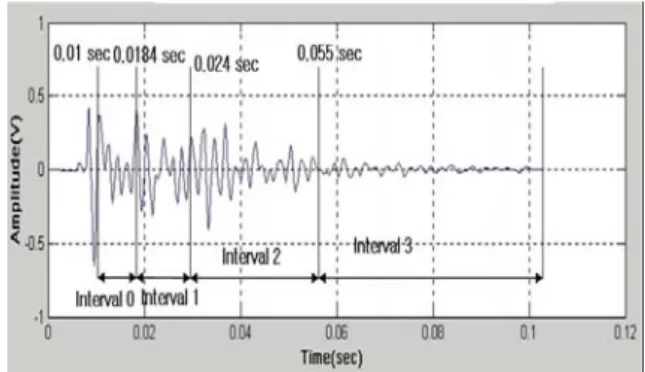
difference of integral value of time interval or total time in time domain. Also there was difference of energy computed by summing magnitudes of power spectrum in frequency domain. Time intervals which were obtained by summing the amplitudes of peaks are shown in Fig. 4. Normal melon has higher integral values than defect one. Based on analysis of the acoustic wave from normal and defect melons, following parameters were considered:
- Integral value computed by using peak in time domain(total time, interval 2, interval 3)
- Peak number in time domain
- Standard deviation of peak to peak distance in time domain
- Zero crossing rate: number of 0 point of intersection in time domain
- Zero point frequency: number of the points which amplitudes are zero
- Energy computed by summing magnitudes of power spectrum in frequency domain
Fig. 4. Time interval for computing integral value in time domain.
Development of the quality evaluation model
Cultivar 'Sambokkul' (Citrulus Vulgaris Schrad) grown in Gochang area in Korea during summer in 2002 were used to test the developed quality evaluation system. Number of the watermelon samples used was 143. Number of the defect melon was 53 among those samples. Quality of the sample was estimated with the developed system, and verified by visual inspection of cut sample (Fig. 5 and Fig. 6). Table 1 shows quality indices of visual inspection. The flesh color of section of melon was measured with colorimeter and width and length was measured with vernier caliper. Inside-cavity and blood flesh melons were classified into 5 grades according to the extent of flesh color, area, width, and length. Immature, lager than score 3 of inside-cavity or score 2 of blood fresh, were considered as defect melons.
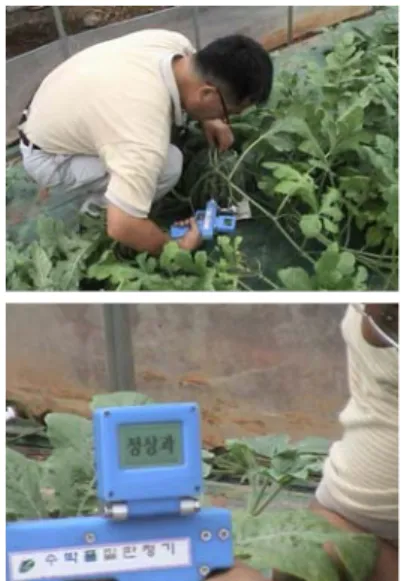
Fig. 5. Performance test of the developed system in field.
(a) unripe (b) ripe
(c) inside-cavity (d) blood flesh Fig. 6. Various types of internal quality of watermelon.
Results and Discussion
Relationships between the parameters
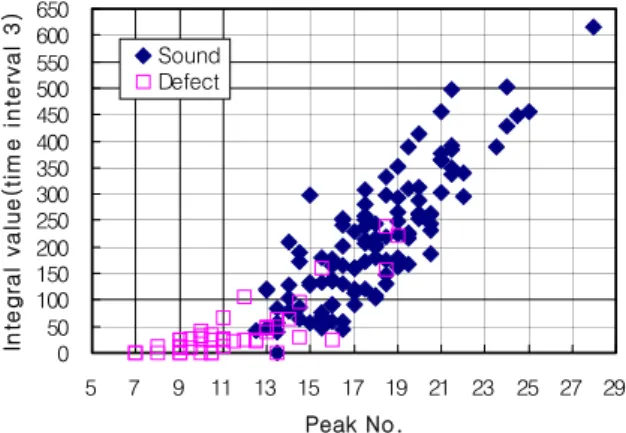
The relationship between the integral value and number of peak for the interval time from 0.055 sec to 0.1024 sec is shown in Fig. 7(a) and (b). Defect watermelon such as blood fresh and inside-cavity has low integral value because of low transmission efficiency of acoustic wave. As shown in Fig. 7(a), integral value for total time and number of peaks of inside-cavity and blood fresh were crowed at lower value of 800 and 13, respectively. As shown in Fig. 7(b), defect melon has lower integral value than normal one resulted from rapid attenuation of acoustic wave in time interval 3.
Table 1. Some criteria of internal quality for watermelon (a) Blood flesh
Items sound 1 2 3 4 5
Flesh color*
(a value) Over 22 20∼22 18∼20 16∼18 14∼16 Less 14 Area
(cm2) 0 Less 0.5 0.5∼3.0 3.0∼7.5 7.5∼14.0 Over 14.0 Condition of
cell wall sound before collapse 1/3
collapse 2/3
collapse collapse collapse
(b) Inside-cavity
Items sound 1 2 3 4 5
Width(mm) 0 Less 5 5∼10 10∼15 15∼20 Over 20
Length(mm) 0 Less 10 10∼30 30∼50 50∼70 Over 70
Area(cm2) 0 Less 0.5 0.5∼3.0 3.0∼7.5 7.5∼14.0 Over 14.0
As shown in Fig. 7(c), energy value of defect melon was also low in the time domain because of low transmission efficiency of acoustic wave. And the relationship between the standard deviation of peak to peak distance and total integral value is shown in Fig.7(d). Large standard deviation of distance between peaks means that vibration in the medium is slow and irregular.
As shown in the Fig. 7(d), signal of normal watermelon has larger than 800 of total integral value and standard deviations of distance between peaks were grouped at lower region of 2.1.
The relationship between zero-point frequency and peak number is shown in Fig. 7(e) and (f). Figures show that signal of defect melon has large zero-point frequency and low zero-crossing rate. Normal melons were grouped at the region of larger than 50 of zero-point frequency and larger than 13 of peak number. The signal also crowded at the region of larger than 8 of zero-crossing rate and larger than 13 of peak number. Large zero crossing frequency means that vibration of the sound wave occurred relatively low, and low zero crossing rate means the sound wave is mainly composed of low frequency components.
The quality evaluation model and accuracy
For developing the quality prediction model, the watermelon samples were divided into two groups; 22 defect watermelons and 49 sound ones. Fig. 8(a) shows the result of PCR calibration. Six parameters, i.e., integral value, energy, number of peaks, standard deviation of peak-peak distance, zero-point frequency, and zero-crossing rate were selected as usable factors in effectively predicting the quality
400 600 800 1000 1200 1400 1600 1800
5 7 9 11 13 15 17 19 21 23 25 27 29 Peak No.
Integral value during total time
Sound Defect
(a) Peak No. vs. integral value (total)
0 50 100 150 200 250 300 350 400 450 500 550 600 650
5 7 9 11 13 15 17 19 21 23 25 27 29 Peak No.
Integral value(time interval 3)
Sound Defect
(b) Peak vs. integral value(time interval3)
6.E+04 7.E+04 8.E+04 9.E+04 1.E+05 1.E+05 1.E+05
5 8 11 14 17 20 23 26 29
Peak No.
Energy in Frequency domain Sound Defect
(c) Peak No. vs. energy in frequency domain
400 600 800 1000 1200 1400 1600 1800
0.5 1.0 1.5 2.0 2.5 3.0 3.5
STD of peak to peak distance
Integral value during total time
Sound Defect
(d) Standard deviationof peak to peak distance
0 10 20 30 40 50 60 70 80 90 100
5 7 9 11 13 15 17 19 21 23 25 27 29 Peak No.
Zero-point Frequency Sound
Defect
(e) Peak No. vs. zero-point frequency
2 4 6 8 10 12 14 16 18
6 8 10 12 14 16 18 20 22 24 26 28 30 Peak No.
Zero-crossing rate
Sound Defect
(f) peak No. vs. zero-crossing rate
Fig. 7. Relationships among the parameters of quality evaluation for watermelon.
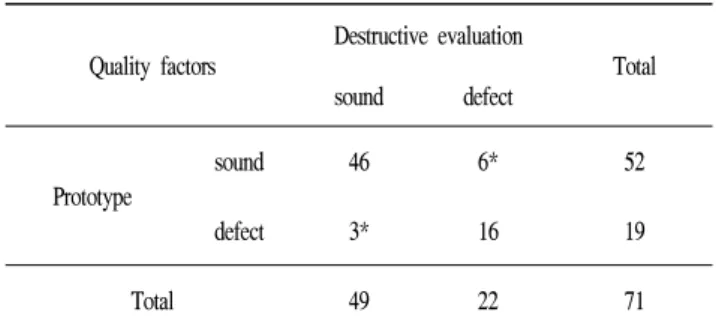
index of watermelon. The PCR model fits the data with a relation coefficient of 0.79, and a standard error of calibration(SEC) of 0.28. As shown in Table 2, this accuracy of calibration model was 87% when the threshold value of evaluation was 0.5.
The validation of the developed model was conducted using 72 samples. Among the total 72 samples, 41 samples were sound, 31 samples were defect. As shown Fig. 8(b), standard error of prediction, the relation coefficient, and bias were 0.28, 0.785, and 5.825 respectively. The accuracy of quality
0 0.2 0.4 0.6 0.8 1
0 0.2 0.4 0.6 0.8 1 1.2
Measured value
Predicted value
sound Defect R=0.79 SEC=0.2796
(a) Calibration
0 0.2 0.4 0.6 0.8 1
0 0.2 0.4 0.6 0.8 1 1.2
Measured value
Predicted value
Sound Defect R=0.785 SEP=0.2797 Bias=5.825
(b) Validation
Fig. 8. Investigation of predicted quality indices obtained from PCR model in calibration and validation.
Table 2. Accuracy of quality evaluation by calibration model Quality factors
Destructive evaluation
Total
sound defect
Prototype
sound 46 6* 52
defect 3* 16 19
Total 49 22 71
※ Accuracy: (43+16)/71×100=87%, * No. of evaluation error
evaluation was 83% as shown Table 3. The quality of those samples was evaluated by an inspector using conventional method which hit a watermelon and hear the sounds, and then compared with the results of the prototype. As shown in Table 4, the quality evaluation accuracy by the inspector was 75%.
Table 3. Accuracy of quality evaluation by prototype Quality factors Destructive evaluation
Total
sound defect
Prototype sound 33 4* 37
defect 8* 27 35
Total 41 31 72
※ Accuracy: (33+21)/72×100=75%, * No. of evaluation error
Table 4. Accuracy of quality evaluation by human inspector Quality factors Destructive evaluation
Total
sound defect
Human inspector sound 33 10* 43
defect 8* 21 29
Total 41 31 72
※ Accuracy: (33+21)/72×100=75%, * No. of evaluation error
요 약
음파를 이용한 수박의 내부품질을 비파괴적으로 판정하 는 시스템을 개발하였다. 개발된 수박품질판정기는 크기가 200×200 mm, 무게가 290 g로 휴대가 가능하여 수박 재배포 장, 집하장, 슈퍼마켓 등 현장에서 쉽게 사용가능하도록 개발하였다. 수박의 음파수집한 후 음파데이터에서 영교차 율, 피크(peak)점간 거리 표준편차, 시간파형에서 진폭 적분 값, 주파수대역 에너지, 영점빈도수와 같은 특징인자를 추 출하여 내부품질을 판정할 수 있는 주성분회귀 모델개발에 이용하였다. 개발된 수박의 주성분회귀 모델의 상관계수는 0.79, SEC는 0.28로 판정정확도는 87% 이었으며, 모델 검증 한 결과 상관계수가 0.78, SEP가 0.785로 판정정확도가 83%이었다. 생산자 내부품질판정 정확도를 조사한 결과, 생산자 판정 정확도는 75% 이었다.
References
1. Chen, J. Y., Miyazato, M. and Ishiguro, E. (1993) Discrimination of internal quality of agricultural products using response properties for vibration (I). J. Japanese Soc. Agri. Machinery, 55, 65-72.
2. Choi D. S., Kim,M. S., Choi, K. H., Lee, K. J. and Lee, Y. H. (2002) Acoustic characteristics of watermelon for internal quality evaluation. J. Korean Soc. Agri.
Machinery, 27, 59-66
3. Chuma, Y., Shiga, T. and Hikida, Y. (1977) Vibration and impact response properties of agricultural products
for non-destructive evaluation of internal quality (Ⅰ).
J. Japanese Soc. Agri. Machinery, 39, 335-341 4. Hayashi, S., Sugiyama, J. I. and Otobe, K. (1995)
Nondestructive quality evaluation of fruits and vegetables by acoustic transmission waves. Proceedings of International Symposium on Automation and Robotics in Bioproduction and Processing, p.227-234, Kobe, Japan.
5. Kawamura, T. and Nishimura, I. (1988) Studies on the physical property of watermelon (I). J. Japanese Soc.
Agri. Machinery, 50, 85-92.
6. Kim, M. S., Choi, D. S., Lee, Y. H. and Cho, Y. K.
(1998) Study on acoustic characteristics of the watermelon. J. Korean Soc. Agri. Machinery, 23, 57-66.
7. Kouno Y., Mizuno, T., Maeda, H., Akinaga, T. and Kohda, Y. (1993) The development of a device to measure the ripeness and internal quality of watermelons.
Proceedings of the International Conference for Agricultural Machinery Engineering October 19-22, 1993, Seoul, Korea.
8. Sasao, A. (1985) Impact response properties of watermelon in growth process. J. Japanese Soc. Agri.
Machinery, 47, 355-358.
9. Shiga, T., Hikida, Y. and Chuma, Y. (1978) Vibration and impact response properties of agricultural products for non-destructive evaluation of internal quality (Ⅱ).
J. Japanese Soc. Agri. Machinery, 49, 375-380 10. Yamamoto, H., Iwamoto, M. and Haginuma, S. (1980)
Acoustic impulse response method for natural frequency of intact fruits and preliminary applications to internal quality evaluation of apples and watermelons. J. Texture Studies, 11, 117-136.
11. Yamamoto, H., Iwamoto, M. and Haginuma, S. (1981) Nondestructive acoustic impulse response method for measuring internal quality of apples and watermelons.
J. Japanese Soc. Hort. Sci., 50, 247-261.
(접수 2008년 9월 16일, 채택 2009년 1월 9일)