─ 221 ─
ⓒ The Korean Society of Limnology. All rights reserved.
This is an open-access article distributed under the terms of the Creative Commons Attribution Non-Commercial License(http://creativecommons.org/licenses/by-nc/3.0/), which permits unrestricted non-commercial use, distribution, and reproduction in any medium, provide the original work is properly cited.
INTRODUCTION
Headwater streams are important sources of biota, organic matter, and water downstream (Clarke et al., 2009). Howev- er, many headwater streams are affected by anthropogenic disturbances, such as urbanization, agriculture, and mining.
These disturbances near headwater streams can severely influence freshwater biodiversity and water quality down-
stream. Therefore, it is essential to interpret the impacts of various anthropogenic disturbances on headwater streams.
However, the assessment of headwater streams (i.e., creeks, tributaries, and small rivers) for biodiversity conservation has been relatively neglected in favor of that of main streams and/or rivers. Because headwater streams occupy more than three-quarters of the stream channel in watersheds (Benda et al., 2005; Clarke et al., 2009), it is practically difficult to monitor all these streams. Thus, it is necessary to establish a more efficient and time-saving procedure to investigate river health through biodiversity monitoring.
Evaluation of Benthic Macroinvertebrate Diversity in a Stream of Abandoned Mine Land Based on Environmental DNA (eDNA) Approach
Mi-Jung Bae
(0000-0003-4286-1119), Seong-Nam Ham
(0000-0002-2256-0880), Young-Kyung Lee
(0000-0002-6926-7323)and Eui-Jin Kim*
(0000-0002-6528-9699)Nakdonggang National Institute of Biological Resources, Sangju 37242, Republic of Korea
Abstract Recently, environmental DNA (eDNA)-based metabarcoding approaches have been proposed to evaluate the status of freshwater ecosystems owing to various advantages, including fast and easy sampling and minimal habitat disruption from sampling. Therefore, as a case study, we applied eDNA metabarcoding techniques to evaluate the effects of an abandoned mine land located near a headwater stream of Nakdonggang River, South Korea, by examining benthic macroinvertebrate diversity and compared the results with those obtained using the traditional Surber-net sampling method. The number of genera was higher in Surber- net sampling (29) than in the eDNA analysis (20). The genus richness tended to decrease from headwater to downstream in eDNA analysis, whereas richness tended to decrease at sites with acid-sulfated sediment areas using Surber-net sampling. Through cluster analysis and non-metric multidimensional scaling, the sampling sites were differentiated into two parts: acid-sulfated and other sites using Surber-net sampling, whereas they were grouped into the two lowest downstream and other sites using eDNA sampling. To evaluate freshwater ecosystems using eDNA analysis in practical applications, it is necessary to constantly upgrade the methodologies and compare the data with field survey methods.
Key words: environmental DNA, field sampling, functional feeding group, non-metric multidimensional scaling
Manuscript received 21 September 2021, revised 26 September 2021, revision accepted 27 September 2021
* Corresponding author: Tel: +82-54-530-0860, Fax: +82-54-530-0869 E-mail: [email protected]
KJEE 54(3): 221-228(2021)
https://doi.org/10.11614/KSL.2021.54.3.221 ISSN: 2288-1115(Print), 2288-1123(Online)
Original article
MI-JUNG BAE:
SEONG-NAM HAM:
YOUNG-KYUNG LEE: 0000-0002-6926-7323 EUI-JIN KIM:
Among the various anthropogenic disturbances, mining activity (past or present) is presumed to have severe and long-lasting effects on streams and rivers (Marqu és et al., 2001). The biodiversity of streams near mining areas is easily affected by changes in physical and chemical factors (e.g., organic matter breakdown, increased conductivity, erosion or deposition, and sediment contamination) (Bae et al., submit- ted). In particular, mining activity often causes heavy metal contamination near streams, and the heavy metal concentra- tion in the water generally exceeds the recommended limits for drinking or agricultural use, resulting in the disruption of freshwater biodiversity (Loayza-Muro et al., 2010). More- over, in areas with abandoned mines, heavy metals that have accumulated in stream sediments from past mining activities cannot be completely eliminated, causing long-lasting dam- age to freshwater ecosystems, even though they usually do not exceed the permissible limits for water quality. Thus, ben- thic macroinvertebrate communities in streams near mines or abandoned mining areas are frequently disturbed or even destroyed, leading to a severe disruption of the functional connectivity of ecological networks and a decrease in species diversity (Romero et al., 2008).
The diversity of benthic macroinvertebrate communities is an essential biotic indicator in freshwater ecosystems be- cause they can perceptively reflect environmental alterations (e.g., land-use changes, water quality, and food web) in their habitat (Tzafesta et al., 2021). In recent years, with the advancement of next-generation sequencing technologies, environmental DNA (eDNA)-based metabarcoding approach- es for benthic macroinvertebrate communities have gained increasing attention as a convenient assessment technique for evaluating the status of freshwater ecosystems (M ächler et al., 2016). This technique possesses several advantages such as fast and easy sampling, applicability to various pending ecological issues (e.g., evaluating biodiversity and detecting endangered species or invasive species), and minimal habitat disruption from sampling (D íaz-Ferguson et al., 2014; Thom- sen et al., 2015; Harrison et al., 2019; Coble et al., 2019). It is expected that eDNA-based assessment techniques can be improved through continuous comparison with field sam- pling.
In this study, we employed eDNA metabarcoding tech-
niques to evaluate the effects of an abandoned mine land
located near a headwater stream of the Nakdonggang Riv-
Fig. 1. Sampling sites in Hwangjicheon stream.Benthic Macroinvertebrate Diversity Evaluation Based on eDNA in a Stream 223
er, South Korea, by examining benthic macroinvertebrate diversity. Subsequently, we compared the results of the eDNA-based assessment with those of the traditional Surb- er-net sampling method.
MATERIALS AND METHODS
1. Ecological data
We collected benthic macroinvertebrates using a Surber net (30 cm ×30 cm, 250 μm mesh) (i.e., the original field survey method) and water samples for eDNA analysis at seven sam- pling sites in the Hwangjicheon stream in 2019 (Fig. 1). The Hwangjicheon stream is located in Taebaek-si, where South Korea’s representative coal mines exist. In 2010, heavy metal concentrations (Cd, Pb, Fe, and Mn) in mining water and groundwater near the Hwangjicheon stream were reported to exceed the water quality limits (MIRECO, 2018). Substrates at sites 1 to 3 are acid-sulfated, and the mining water treat- ment plant is located next to site 1.
Using a Surber net, each site was sampled in triplicate in the riffle area within a 50-m range (Bae et al., 2016). Col- lected samples were preserved in 99% ethanol in the field, which was replaced with 70% ethanol in the laboratory. We then sorted and identified macroinvertebrates at the genus level based on Quigley (1977), Pennak (1978), Brighnam et al. (1982), Yun (1988), and Merritt and Cummins (2006) to compare the results with those of eDNA analysis.
Using a sterile bottle at each site, water samples were collected from the stream bottom without disturbing the sed- iment. Water samples (2 L in each replicate) were collected in triplicate at the same sites as Surber net sampling. All water sampling was conducted immediately before Surber net sampling. The 6-L samples were vacuum filtered using a Supor
®200 Membrane Filter (0.2-μm pore size; Pall Corpo- ration, Ann Arbor, MI, USA). Filters were placed into 50-mL tubes using sterile forceps and stored at - 20°C until DNA extraction. DNA was extracted from the filters using a Pow- erWater
®DNA Isolation Kit (Qiagen, Hilden, Germany), fol- lowing the manufacturer’s instructions. Subsequently, PCR amplification was conducted for the eukaryotic V4 region of the small subunit ribosomal DNA (18S rRNA gene) using the universal primers Uni18SF and Uni18SR (Zhan et al., 2013).
Next-generation sequencing and bioinformatics analyses were performed as described by Fern ández et al. (2018).
We also measured 24 environmental factors, including
geographical factors (i.e., latitude, stream order, distance from source) and land use (%), which were extracted from a digital map using ArcGIS 10.6 (ESRI, Redlands, CA, USA).
Whereas the substrate composition, dissolved oxygen, pH, and conductivity were measured in the field, biological ox- ygen demand (BOD), total nitrogen (TN), ammonia (NH
4+), nitrate (NO
3-), total phosphorus (TP), orthophosphate (PO
43-), and chlorophyll-a (Chl-a) were measured in the laboratory according to APHA (2005); water samples (4 L at each site) were obtained from the field using a sterile bottle.
2. Data analysis
First, as descriptive measures, genus richness and func-
Fig. 2. Comparisons of order(a), family(b) and genus richness(c) between a Surber net sampling and eDNA analysis.(a)
(b)
(c)
tional feeding groups (FFGs) were compared between Surber net sampling and eDNA analysis. In addition, Venn diagrams were constructed to determine overlapping genera, families, and orders between the Surber net sampling and eDNA
analysis. Second, cluster analysis (CA) and non-metric mul- tidimensional scaling (NMDS) were conducted to outline benthic macroinvertebrate community compositions as well as to check whether each evaluation method accurately re-
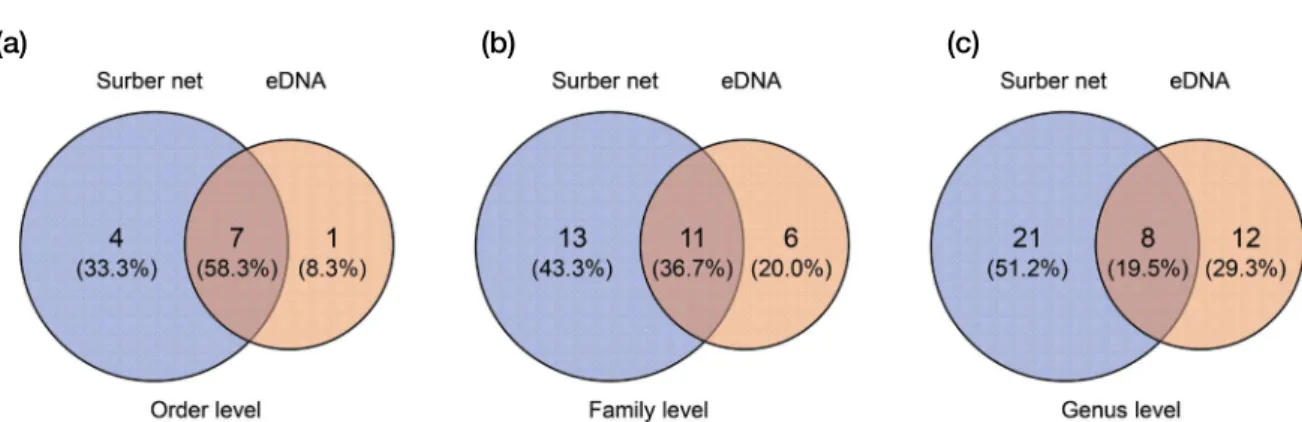
Fig. 3. Venn diagram analysis in order(a), family(b) and genus richness(c) using a Surber net sampling and eDNA analysis.(a) (b) (c)
Fig. 4. The relative ratio(%) of functional feeding groups(FFG) based on a Surber net(a) and eDNA(b).
(a) (b)
(a) (b)
Fig. 5. Non-metric multidimensional scaling ordination based on benthic macroinvertebrate community with a Surber net sampling(a) and eDNA analysis(b). Environmental factors with p<0.05 are represented in the figure. Different colors and symbols indicate the result of cluster analysis: green square, cluster 1 and orange circle, cluster 2.
Benthic Macroinvertebrate Diversity Evaluation Based on eDNA in a Stream 225
flected the situation at the abandoned mining areas. After CA, multi-response permutation procedures (MRPP) were conducted to determine significant differences between clus- ters defined by CA. Venn diagrams, CA, and NMDS were analyzed using the ‘vegan’ package (Oksanen et al., 2011) in R (R Core Team, 2016).
RESULTS AND DISCUSSION
In total, 29 genera (24 families and 11 orders) and 20 genera (16 families and 8 orders) were found in the Hwang- jicheon stream using Surber net sampling and eDNA analy- sis, respectively. When we collected samples using a Surber net, genus richness decreased at sites 1 (14) to 3 (5), where substrates at the stream bottom were acid-sulfated, and then increased at sites 4 (9) to 7 (15) (Fig. 2). In contrast, for eDNA analysis, the genus richness tended to decrease from upstream (sites 1 and 11) to downstream (sites 7 and 5). Venn diagram analysis revealed that eight genera overlapped be- tween the Surber net sampling and eDNA analysis (Fig. 3).
More genera were collected using Surber net sampling (21) than those detected by eDNA sampling (12).
The relative FFG ratios based on genus richness revealed that, in Surber net sampling, the ratio of collector-gatherers was highest (41.4%), followed by scrapers (27.6%), collec- tor-filterers (13.8%), predators (10.3%), and shredders (6.9%) (Fig. 4). On the other hand, when using eDNA analysis, the ratio of collector-gatherers was also highest (30.05%), fol- lowed by shredders (20.0%), scrapers (20.0%), collector-fil- terers (20.0%), and predators (10.0%). Considering FFGs at each site in Surber net sampling, the ratio of scrapers (e.g., Psilotreta) decreased from site 1 (7.7%) to site 3 (0.0%) and then tended to increase from site 4 (11.1%) to 7 (36.8%), in- cluding Semisulcospira, Ecdyonurus, Epeorus, and Drunella.
Only collector-gatherers were observed at site 3. In contrast, using eDNA analysis, scrapers, including Fossaria, Physa, Ecdyonurus, and Epeorus, increased from site 3 (16.0%) to site 6 (33.3%).
CA grouped the sites into two clusters based on similarities in macroinvertebrate composition obtained by the Surber net and eDNA sampling methods. MRPP showed significant differences between the two clusters (i.e., using a Surber net:
A =0.07, p < 0.05; eDNA sampling: A =0.08, p < 0.05).
NMDS also reflected differences in benthic macroinverte- brate community composition (i.e., using a Surber net: stress
value =1.7 for the first two axes and eDNA sampling: stress value =2.3 for the first two axes) (Fig. 5). In the Surber net method, sites with acid-sulfated substrates and a high per- centage of forest in terms of land use were located in the left part of NMDS ordination (the sites included in cluster 1), whereas sites with high TN, NO
3-, and BOD values were located in the right part (the sites included in cluster 2). Fac- tors that influenced macroinvertebrate communities included TN (0.892), BOD (0.865), the ratio of 0.063-mm in sub- strate composition (0.859), NO
3-(0.849), the ratio of forest (0.780), and the ratio of 64~256 mm (0.720) (Table 1). For eDNA analysis, the sites with high values in stream order and TN were located in the right part of the NMDS ordination, whereas other sites (sites 1 to 5) were located in the left part.
The influential factors on the macroinvertebrate community were the percentage of forest (0.881), TN (0.856), stream or- der (0.851), and the ratio of urban in land use (0.810).
We observed differences in the benthic macroinvertebrate community between Surber net sampling and eDNA analysis in the abandoned mining area. Although the results based on eDNA analysis did not seem to reflect the impact of the abandoned mining area on benthic macroinvertebrates, the approach could be improved by considering the following factors. First, contrary to other studies using eDNA analysis, we observed a lower number of genera. To evaluate the status of freshwater ecosystems using eDNA analysis based on ben- thic macroinvertebrate diversity, several approaches using the mitochondrial cytochrome c oxidase subunit I (cox1 or COI) gene as a biomarker have been proposed in addition to the 18S rRNA gene marker (Dowle et al., 2016; Fern ández et al., 2018; Elbrecht et al., 2019; Fern ández et al., 2019; Meyer et al., 2021). When the COI gene was employed as a marker, more benthic macroinvertebrate species were detected com- pared with those detected using 18S rRNA gene markers and the traditional field survey such as Surber net sampling (Fern ández et al., 2018). In addition, the highly specific COI marker for benthic macroinvertebrates can reduce the prob- ability of non-target (e.g., protozoa, phytoplankton, fungi, bacteria) amplifications (Gleason et al., 2021; Leese et al., 2021).
Second, eDNA analysis results can differ depending on
the water sampling depth, especially for benthic macroin-
vertebrate communities. We tried to collect stream water for
eDNA analysis at the stream bottom because of the behavior
and living habits of “benthic” macroinvertebrates, although
the stream water depth ( < 30 cm) in our research stream was
shallower compared with the main streams. However, it has been proposed that the community composition of freshwater organisms determined using eDNA analysis significantly differs depending on water depth (i.e., the bottom, middle, and surface of stream water) (Zeng et al., 2021). Therefore, eDNA analysis from water sampling at different depths is recommended.
Third, the behavior (i.e., generation, migration diffusion, and degradation) of eDNA in freshwater ecosystems should be considered (Carraro et al. 2020). Despite the several ad- vantages and considerable potential of eDNA techniques in evaluating the status of freshwater ecosystems, several prerequisites, including consideration of quantitative decay time (half-life) of eDNA (Tzafesta et al., 2021), eDNA dif-
fusion rate due to hydrological factors (Carraro et al., 2020), minimizing non-target amplification (Leese et al., 2021), and normalization between actual populations (or biomass) and detected signals (Dowle et al., 2016; Pereira-da-Conceicoa et al., 2021), still need to be addressed to completely replace existing field survey methods. Thus, integrated eDNA me- tabarcoding approaches, conducted parallel to traditional field surveys, are required for eDNA technology to eventual- ly overcome the current limitations.
CONCLUSIONS
As a case study, we employed eDNA metabarcoding tech-
Table 1. Relationships between environmental factors and the non-metric multidimensional scaling (NMS) ordination of benthic macroin- vertebrate assemblage using a Surber net sampling and eDNA analysis.Environmental factors
Using a Surber net Using eDNA analysis
Axis 1 Axis 2 r2 p values Axis 1 Axis 2 r2 p values
Geography
Altitude(m) - 0.912 0.410 0.653 0.121 - 0.990 0.140 0.809 0.051
Stream order 0.970 - 0.245 0.677 0.103 0.997 - 0.082 0.851 0.025
Distance from sources(km) 0.981 0.192 0.514 0.206 0.953 0.303 0.635 0.145
Land use (%)
Urban 0.567 - 0.824 0.236 0.627 0.038 - 0.999 0.810 0.007
Agriculture 0.461 - 0.887 0.121 0.736 0.808 0.590 0.762 0.052
Forest - 0.376 0.927 0.780 0.046 - 0.492 0.870 0.881 0.015
Grassland - 0.699 - 0.715 0.269 0.494 - 0.972 0.236 0.088 0.843
Wetland 0.908 - 0.419 0.276 0.607 0.780 - 0.626 0.390 0.469
Bareland 0.185 - 0.983 0.619 0.153 0.952 - 0.306 0.391 0.366
Substrate composition (%)
0.063mm - 0.539 0.842 0.859 0.017 - 0.869 0.495 0.620 0.147
0.063~2mm - 0.335 0.942 0.662 0.137 - 0.493 0.870 0.417 0.360
2~4mm - 0.948 - 0.318 0.075 0.845 0.377 0.926 0.368 0.437
4~64mm 0.250 0.968 0.681 0.056 - 0.928 0.372 0.120 0.874
64~256mm - 0.143 -0.990 0.720 0.029 0.758 - 0.652 0.207 0.637
256mm 0.078 0.997 0.471 0.226 - 0.597 0.803 0.208 0.651
Water quality
Dissolved oxygen(mg L-1) 0.721 0.693 0.335 0.453 0.267 0.964 0.162 0.707 Conductivity(μS cm-1) - 0.221 - 0.975 0.619 0.111 0.656 - 0.754 0.169 0.706 Biological oxygen demand
(mg L-1) 0.771 - 0.637 0.865 0.017 0.847 - 0.532 0.689 0.107
Ammonia(mg L-1) 0.264 - 0.964 0.366 0.408 0.960 - 0.279 0.039 0.923 Nitrate(mg L-1) 0.180 - 0.984 0.849 0.011 0.883 - 0.469 0.291 0.448 Total nitrogen(mg L-1) 0.686 - 0.728 0.892 0.025 0.856 - 0.516 0.856 0.008 Ortho-phosphate(mg L-1) 0.447 - 0.895 0.580 0.205 0.224 - 0.975 0.619 0.173 Total phosphorus(mg L-1) 0.952 - 0.307 0.705 0.091 0.592 - 0.806 0.716 0.081 Chlorophyll-a(mg L-1) 0.025 1.000 0.185 0.725 - 0.945 0.327 0.199 0.649 P values lower than 0.05 are indicated in bold.
Benthic Macroinvertebrate Diversity Evaluation Based on eDNA in a Stream 227