Online ISSN: 2288-7253 DOI: https://doi.org/10.14579/MEMBRANE_JOURNAL.2020.30.1.66
1. Introduction
1)Forward osmosis (FO) is a water treatment process based on membrane filtration that has a wide range of applications for wastewater treatment, desalination, and food processing in academic research and industry[1-9].
In the FO process, water is transported by the chem- ical potential that results from the concentration differ- ence between the diluted feed solution and the con- centrated draw solution through a semi-permeable mem- brane[10-14]. Unlike desalination processes that rely upon pressure or heat, such as reverse osmosis (RO) or
†Corresponding author(e-mail: [email protected], http://orcid.org/0000-0002-6016-5267)
비틀린 중공사막이 모듈에 미치는 영향:
전산 유체역학 시뮬레이션을 통한 정삼투 모듈의 압력과 농도 분포
김 수 헌⋅이 철 민⋅김 인 수†
광주과학기술원 지구환경공학부
(2019년 12월 23일 접수, 2020년 2월 10일 수정, 2020년 2월 24일 채택)
Effect of Twisted Hollow Fiber Membranes in a Module: Computational Fluid Dynamics Simulations on the Pressure and Concentration Profile of the Module in the forward Osmosis
Suhun Kim, Chulmin Lee, and In S. Kim†
School of Earth Sciences and Environmental Engineering, Gwangju Institute of Science and Technology (GIST), 123 Cheomdangwagi-ro, Buk-gu, Gwangju 61005, Korea
(Received December 23, 2019, Revised February 10, 2020, Accepted February 24, 2020)
요 약: 본 연구에서는 정삼투 중공사막 모듈에서 중공사막의 가닥을 비틀어 배치하였을 때의 효과를 알아보기 위해 CFD 전산 유체 역학 프로그램을 통해 5개의 다른 각도로 비틀린 중공사막 모듈을 설계하고 시뮬레이션하여 비틀리지 않은 모듈과 비교하였다. 실험 결과, 중공사막이 비틀렸을 때, 모듈 내부의 유도 용액의 농도가 비틀리지 않을 때에 비해 고르게 분포하였 다. 모듈 입구의 압력은 중공사막의 비틀림과 관계없이 일정한 값을 보였지만 출구의 압력은 중공사막이 비틀린 정도가 커질 수록 증가하는 추세를 보였다. 출구의 압력이 높아짐에 따라 막 내부의 유체 속도가 감소하고 모듈 체류 시간이 증가하여 막 사이의 물질 교환이 원활하게 이루어질 것으로 예측된다. 이는 결과적으로 막이 비틀려 있을 때의 모듈 플럭스가 투과 수량 이 차지하는 비율이 그렇지 않을 때에 비해 2배 증가하였다.
Abstract: The current study focused on the effect of twisting hollow fibers (HFs) in a module during forward osmosis operation mode. Computational fluid dynamics simulation was employed for a straight HF module and twisted modules with five different angles to predict the mass transfer and observe the draw solution profile in terms of concentration and pressure. The simulation results showed that when the membranes were twisted, the concentration was distributed more evenly and the pressure at the module outlet increased gradually as the twisting angle increased. As pressure at the outlet increased, the fluid velocity inside the membrane decreased and the residence time of fluid increased, thereby facilitating mass exchange across the membrane. This is evidenced by a doubling of the ratio of water flux through the membrane in module flux when the HFs were twisted.
Keywords: twisted hollow fiber, hollow fiber module, forward osmosis, computational fluid dynamics
Effect of Twisted Hollow Fiber Membranes in a Module 67
membrane distillation (MD), water transfer in FO is spontaneous, which can minimize external energy input.
In addition, membrane fouling may be remarkably re- duced because almost no hydraulic pressure is applied, unlike other processes. Thermodynamically, FO de- salination cannot directly save energy in absolute terms, but it is expected to greatly improve the performance of RO or heat-treatment desalination processes and to reduce operating costs when properly applied to hybrid processes in combination with other processes[15].
Hollow fibers (HFs) have been used in FO mem- branes prior to the commercialization phase[16,17]. HF membranes have been applied in various fields, such as drinking water and waste water treatment. HF is competitive with other membrane configurations be- cause (1) the mechanical properties of HFs in the mod- ule or contactor mean that they do not require spacers, and (2) HFs have a higher packing density and a high effective membrane surface area. As a result of those advantages, HF modules have entered the spotlight, but they have the disadvantage of undergoing severe dam- age even at low concentrations of contaminants[18]. In order to understand the advantages and disadvantages of HF FO modules and to improve their performance, it is necessary to understand the characteristics of the fluid inside the module.
However, it is practically impossible to understand fluid flow inside the module through experiments.
Therefore, we employed computational fluid dynamics (CFD) to simulate both flow characteristics and mass transfer phenomena by solving and analyzing problems related to fluid flow. CFD can be a useful tool for predicting the effects that features have on hydro- dynamics at a fundamental level of module design to improve upon these negative aspects of FO membranes and to provide guidance on effective module de- sign[19-23]. Through its advantages, CFD provides a way not only to incorporate the effects of individual characteristics such as solute rejection, membrane slip velocity, and the membrane water flux into one model, but also to apply them to the hydrodynamic conditions of flow channels around the membrane[24-26]. It can
be used to explain the realistic details of the flow field on a fine scale.
A few of HF module studies previously have at- tempted to twist HF membranes inside the module as to improve the performance. However, those studies were simulated to aim at reverse osmosis process[27]
or to analyze effects due to change of operating con- ditions[28] or to examine incompressible flow through twisted elliptical hollow fiber membrane[29]. In this study, we focused on changes in the fluid dynamics and solution profile, such as the pressure and concen- tration of the module, due to the degree of twisting be- tween hollow fibers assuming an FO process. For this purpose, a CFD model was designed to investigate the relationship between module design and fluid flow changes according to the internal structure of the mod- ule, operating under the assumption that the shell side corresponds to the draw solution and the lumen side to the feed solution.
2. Experimental Methods
2.1. Simulation conditions
The twisting angle of HF was defined as the in- cluded angle between the straight line drawn from the head of HF to the center of the module and the straight line drawn from the center of the module to the tail of HF. In the simulation, the bundles of hollow fiber membranes were twisted at 0, 15, 30, 45, 60, and 90°, and the concentration, pressure, and flux dis- tribution were compared across these conditions. A 35 g/L NaCl solution was used as the draw solution of the module to reflect assumed seawater conditions.
This simulation represented the FO process of hollow
fibers as consisting of a lumen (on the interior side of
the HFs) of pure water as feed water and a shell (on
the exterior side of the HFs) containing a draw sol-
ution made up of 35 g/L NaCl. We also determined
that the water flux would be low due to the small
module size and concerning internal concentration po-
larization, and conducted the simulation under the as-
sumption that the flux of the entire membrane surface
area was constant because the unbalanced distribution of flux of HF membrane is negligible due to the mod- ule is small in size. Based on this assumption, it was expected that the concentration change inside the mod- ule is insignificant because the factors that affect the concentration of solution inside the module such as the composition conditions and the membrane permeate are not large. Therefore, the concentration change of the solution was excluded.
Our goal was to observe the flow characteristics of the solution outside of the HFs in the module. The nu- merical method used in this study was the finite ele- ment method (FEM), in which partial differential equa- tions such as Navier-Stokes and the mass conservation equation were represented and evaluated. The calcu- lations were done with the minimum root mean square set at 10
-4. The mesh configuration of the module was created by ANSYS 19.1. Meshing based on the general grid interface connections and the governing equations were computed numerically through the CFD Solver in ANSYS 19.1.
Table 1 shows the modeling parameters used in this study, following[30].
The fluid flow was set as pure laminar flow and all boundaries around the rest of the domain were set as non-slip walls to assume a dead-end module operation.
The nominal velocity of NaCl solution at the module inlet was set at 0.0167 mm/s and the static pressure at the module outlet was set at 0 bars. In the calculations,
0.8926 mm
2/s was set as the kinematic viscosity (ν) of pure water, because the kinematic viscosity of 35 g/L NaCl solution is not substantially different from that of pure water[31]. The fluid temperature was set at 298.15K, isothermally.
2.2. Governing equations
We assumed a Newtonian fluid, and the flow was assumed to be laminar. As an incompressible fluid in a steady state, the fluid model was governed by the Navier-Stokes and conservation of mass equations. To analyze fluid movement, these equations are expressed with constant physical properties, as follows:
⋅∇
=
∇ ∇
(1)
∇⋅
= 0 (2)
Where
is the velocity vector with components in the x, y, and z directions,
is kinematic viscosity,
is static pressure, and ρ is density. In this study, the pure water density at 25°C was set as 0.998 g/m
3[32].
To consider the migration phenomenon of seawater, a solution-diffusion membrane transport model was assumed. The salt concentration field was expressed by the mass transport equation, and the concentration gra- dient though the membrane element was analyzed as:
Parameter Value
Geometrical parameters
Diameter of hollow fiber membrane: d 0.004 m
Diameter of module: D 0.07 m
Length of module: L 0.3 m
Twisting angle 0°, 15°, 30°, 45°, 60°, 90°
Physical properties
Kinematic viscosity of water: v 0.8926 mm2/s
Dynamic viscosity: μ 0.001 Poise
Temperature: T 298.15 K
Density of water: ρ 0.998 g/cm3
Operating conditions Number of fibers 137
Concentration of NaCl draw solution: CD 35 g/L NaCl Table 1. Parameters Input for The Simulation
Effect of Twisted Hollow Fiber Membranes in a Module 69
⋅∇
=
∇(3)
∇⋅
=
⋅ (4)
Where
is the salt concentration,
is the diffusion coefficient,
is the unit vector normal to the surface,
⋅
stands for the local water flux through the HF membrane surface,
is the local salt concentration along the membrane surface, and
is the salt concen- tration on the production side (equaling zero).
2.3. Structure of the module
The overall structure of the module was designed with reference to the commercialized HF FO module HFFO2 (Aquaporin, Denmark)[33,34]. The module used in the simulation was a cylindrical shape with even- ly-packed HFs. Its length was 0.3 m and its diameter was 0.07 m. The length of the HFs constituting the module was 0.3 m and their diameter was 0.004 m.
The spacing between the HFs was 0.005 m from the center of the membrane, and the module contained 137
fibers.
The draw fluid entered the domain in the -x direction,
normal to the vertical inlet face. The inlet and outlet
faces were parallel, and inlet face was defined as a
pressure inlet. Therefore, all fluid entering the domain
flowed in through the inlet face and out through the
outlet face. The operating and boundary conditions are
shown in Fig. 1. Also, Fig. 2. illustrates the designed
module and explanation of the definition of twisting
angle of HF, which had angles of twisting of 0° as a
control, and 90°. The bottom right side of the picture
shows the inlet face and the top left side shows the
outlet face. In the front view of the straight module,
there are empty spaces were shown due to the head
and tail of HF are straight. It could be seen through
the straight green line clearly in the diagonal view of
the module. In contrast, in the view of 90° twisted
module, the position of HF tail (green rim) was twist-
ed 90° clockwise than the position of HF head (green
circle). This is, as defined by the twisting angle, the
angle between the line from HF inlet to the center of
Fig. 1. Schematic diagram of operating and boundary conditions. The boundary condition of the module as inlet nominal speed of NaCl solution was 0.0167 mm/s of and outlet pressure was 0 bar. The boundary condition of the hollow fiber mem- branes as the water flux though the hollow fiber membrane was 0.00031 mm/s.module (the line between the green circle and the trans- parent hole) and the line from the center of module to the HF outlet (the line between the transparent hole and the green rim) were 90°. This could be seen through the twisted green line clearly in the diagonal view of the 90° twisted module.
The total membrane area of the module was 0.5165, 0.5163, 0.5165, 0.5167, 0.5171, and 0.5182 m
2, re- spectively, for the six angles of twisting. The mem- brane area did not meaningfully change with the angle of twisting, with values ranging only slightly from 0.516 to 0.518. Compared to the 0° twisted state, the increments were only 0.03, 0, 0.05, 0.12, and 0.33%, respectively, as the angle increased.
3. Results and Discussion
3.1. Concentration profile of the NaCl draw solution
The concentration profiles of the straight HF module and the five twisted HF modules are illustrated in Fig.
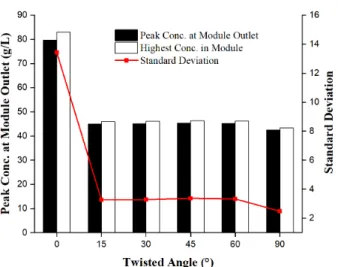
3. The water influx from the membrane into the mod- ule was steady, so the concentration of draw solution around the membrane was lower. When the HFs were not twisted, the concentration of NaCl solution gradu- ally increased from the module inlet to the end of the module. The peak concentration at the module outlet was 79.64 g/L, and the highest concentration inside the module was 82.97 g/L. In addition, the standard devia- tion of the concentration distribution inside the module was 13.43 g/L.
However, when the HFs were twisted, the concen-
Fig. 2. Illustration of the module design. (a) the front view of the straight module, (b) the diagonal view of straight module, (c) the front view of the 90° twisted module, and the (d) the diagonal view of 90° twisted module.Effect of Twisted Hollow Fiber Membranes in a Module 71
tration of the NaCl solution was distributed more even- ly than when they were not twisted, at around 45 g/L.
The peak concentrations at the module outlet according to the angle of twisting, from 15° to 90°, were 44.96, 45.09, 45.32, 45.25, and 42.49 g/L, respectively. Fur- thermore, the highest concentrations inside the module were 45.94, 46.08, 46.32, 46.24, and 43.36 g/L, re- spectively. The standard deviations were 3.26, 3.28, 3.37, 3.33, and 2.48 g/L, respectively, for each angle of twisting.
Compared to when the HFs were not twisted, the peak concentration inside the module decreased when
the HFs were twisted, and the standard deviation of
the concentrations also decreased. As the HFs were
twisted, the alternating internal structure of the module
created a vortex of fluid that prevented the stagnation
of NaCl particles that would otherwise occur when the
HFs were not twisted. The vortex flow structure cre-
ated by twisting HF adds cross flow to the existing
fluid flow along the axis and prevents jet flow that
quickly exits the module without interruption. This
could be attributed to the increase in momentum mix-
ing due to the increased shear stress on the membrane
surface as twisting HF. It could be understood that the
Fig. 3. Illustrations of the concentration profile. (a) 0°, (b) 15°, (c) 30°, (d) 45°, (e) 60°, and (f) 90° twisted modules, respectively.Fig. 4. Changes in the concentration of the NaCl solution in response to changes in the angle of HF twisting inside the module. The black bars indicate the peak concentration at the module outlet, and the white bars indicate the high- est concentration in the module. The red line is the stand- ard deviation of the concentration.
increased shear stress on the membrane helps to dis- tribute the solution from the farthest part of the mem- brane closer to the membrane, helping to evenly dis- tribute the solution concentration inside the module. As a result, the vortex makes the fluid movement inside the module more complex, pushing out stagnant NaCl particles, evenly distributing the draw solution concen- tration, and preventing high concentrations. Therefore, the peak concentration and the standard deviation of the concentration both decreased.
Fig. 4. is a graph drawn according to the peak con- centration at the module ends and the highest concen- tration of NaCl draw solution in the module with standard deviation for the six angles of twisting. When the HFs were twisted, the draw solution was distributed more evenly than when the HFs were not. Additionally, the peak concentration was significantly lower when the HFs were twisted, regardless of the angle. There is no significant difference in these results from 15° to 90° because the internal structure does not change much with angle of twisting. This suggests that twisting membranes can achieve a uniform distribution of the draw solution concentration inside the module. Even small angles of twisting resulted in a markedly more
uniform concentration.
3.2. Pressure profile of the module
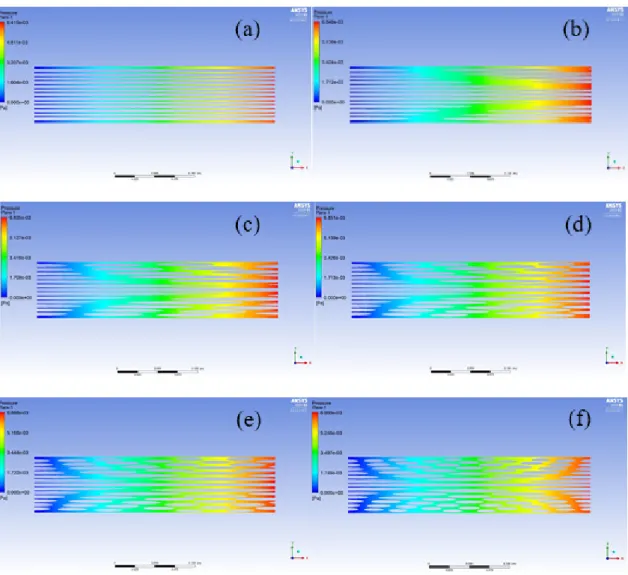
The FO process does not involve direct pressure on the membrane; however, naturally-occurring pressure could be applied on the membrane surface through the action of the pump that circulates the solution. If this pressure is sufficiently small compared to the osmotic pressure, it has a negligible impact on the operation of the module. However, when this pressure is not suffi- ciently small, it prevents efficient operation of the module. The pressure profiles of the straight HF mod- ule and the five twisted HF modules are illustrated in Fig. 5. It shows the pressure gradient of module and pressure at inlet and outlet.
Fig. 6. is a graph presenting the inlet and outlet pressure of the modules with six angles of twisting.
Regarding the inlet pressure, when the HFs were not twisted, the pressure applied was 6.282 × 10
-3Pa, while when the HFs were twisted, the applied pressure according to the angle of twisting from 15° to 90° was 6.693 × 10
-3, 6.679 × 10
-3, 6.698 × 10
-3, 6.733 × 10
-3, and 6.841 × 10
-3Pa, respectively. The inlet pressure increase due to membrane twisting was negligibly small, and there was no correlation between the angle of membrane twisting membrane and the pressure. It was anticipated that the pressure applied at the module inlet would increase due to the change in the movement of the fluid caused by membrane twisting, but the simu- lation results showed no significant increase.
However, the outlet pressure was increased by mem- brane twisting. The pressure applied at the straight module was 2.095 × 10
-9Pa, and the outlet pressure in the twisted module was 4.515 × 10
-7, 4.842 × 10
-7, 5.190
× 10
-7, 5.560 × 10
-7, and 6.220 × 10
-7Pa, respectively.
The outlet pressure increased more as a result of mem- brane twisting than the inlet pressure did, and a pos- itive relationship was found between the angle of mem- brane twisting and the outlet pressure.
As a result, the pressure at the module inlet was
constant, but the pressure at the module outlet in-
creased, which could lead to stagnation of the fluid in
Effect of Twisted Hollow Fiber Membranes in a Module 73
Fig. 6. Changes in the pressure applied at the module inlet and outlet due to changes in the angle of HF twisting in- side the module. The black bars indicate pressure at the module inlet and the white lines indicate outlet pressure.
side the module. Therefore, when the flow of fluid in- side the module is delayed, mass exchange across the membrane can occur smoothly. In addition, the concen- tration distribution inside the module became constant when the membrane was twisted, enabling it to be op- erated effectively without losing osmotic pressure.
3.3. Flux of the module
The mass flow of the module was analyzed to see how twisting the membrane affected the module flux.
In order to compare the module performance under each
condition, the ratio of membrane permeate to module
outflow was calculated. Since the boundary conditions
of the module inlet did not change, changes at the out-
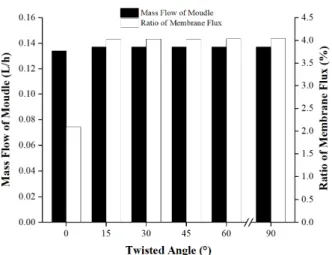
Fig. 5. Illustrations of the pressure profile. (a) 0°, (b) 15°, (c) 30°, (d) 45°, (e) 60°, and (f) 90° twisted modules, respectively.Fig. 7. Change of mass flow at the module outlet and the ratio of membrane flux due to changes in the angle of HF twisting inside the module. The black bars indicate the module mass flow, and the white bars indicate the ratio of membrane flux at the module outlet.
let were observed. To calculate the ratio, this equation was expressed, as follows:
=
(5)
The mass flow of the module inlet was 0.1314 L/h.
Fig. 7. shows the mass flow at the module outlet and the ratio of membrane flux according to the simulation results. When the HFs were not twisted, the mass flow at the module outlet was 0.1342 L/h, while when the HFs were twisted, a constant value of 0.1369 L/h was found from 15° to 90°. The ratio of water flux that pass through the membrane in the straight module flux was 2.091%, and the ratios for the twisted modules were 4.022, 4.029, 4.026, 4.034, and 4.042%, respectively.
Therefore, the mass flow of the module did not in- crease significantly, but compared to when the HFs were not twisted, the ratio of water flux pass through HF membranes in the mass flow of module was dou- bled when the HFs were twisted.
Fig. 8. presents a graphical visualization of the rela- tionship between the total module flux and the angle of
Fig. 8. Change in module flux due to changes in the angle of HF twisting inside the module.
twisting. Module flux is the number of module out-flow divided by the total area of the HFs within the module with LMH (L/m
2/hour). This represents the volume of water that travels through the unit area (1 m
2) over a unit time (1 hour), making it easier to compare the per- formance of modules under different simulation con- ditions.
When the HFs were not twisted, the flux was 0.260 LMH, while when the HFs were twisted at angles be- tween 15° and 60°, a constant value of 0.265 LMH was seen, and the 90° twisted module showed a flux of 0.264 LMH. Thus, the flux of the module was in- creased simply by twisting the HFs, without changing the membrane area. The total module flux shown in the simulation results has a huge difference between the straight module as 0° and the twisted module as 15°, and no significant change after the HF twisted.
This is because the fluid resistance inside the twisted module is bigger compared with the straight module, and no difference in fluid resistance given by the twisting angle after HF twisted.
In response to HF twisting, the ratio of membrane
permeate to module outflow increased by about two
times, and the flux of the module also increased. This
change occurred because the pressure at the outlet of
the module increased and the velocity of the fluid in-
side the module decreased. Thus, when HF twisted, the
Effect of Twisted Hollow Fiber Membranes in a Module 75
fluid velocity inside the module decreases and the ratio of the membrane permeate to mass outflow of the mod- ule increases, resulting in an increase in the total flux of the module.
4. Conclusions
This study presents a comprehensive CFD model that included changes in fluid characteristics (pressure and concentration) inside the module when HFs were twist- ed in the FO process. A module with 137 HF mem- branes twisted at six different angles, from 0° to 90°, was simulated and the simulated performance of each module was compared in terms of the concentration distribution of the NaCl draw solution and the pressure gradient of the module. The CFD simulation results in- dicated that when the HFs were twisted, the concen- tration was evenly distributed and the velocity of the fluid decreased. When the permeate of the membrane is constant and the inflow of the module is the same, twisting the HF membrane results in more mixing of the solution in the module and maintains the osmotic pressure to induce more permeate through the membrane.
Compared to straight module, the effluent from the module was further diluted (with better dilution effi- ciency) and improved module flux. As a result, the performance of the FO module is improved. These CFD results can be used as one of indicators, suggesting di- rections and possibilities for improving HF FO module performance prior to demonstration experiments.
Acknowledgements
This work was supported by Korea Environment In- dustry & Technology Institute (KEITI) through Industrial Facilities & Infrastructure Research Program, funded by Korea Ministry of Environment (MOE) (1485016290) and (1485016165).
Reference
1. S. Zhao, L. Zou, C. Y. Tang, and D. Mulcahy,
“Recent developments in forward osmosis: Oppor- tunities and challenges”, J. Membr. Sci., 396, 1 (2012).
2. D. Ma, S. B. Peh, G. Han, and S. B. Chen,
“Thin-film nanocomposite (TFN) membranes in- corporated with super-hydrophilic metal-organic framework (MOF) UiO-66: Toward enhancement of water flux and salt rejection”, ACS Appl. Mater.
Interfaces., 9, 7523 (2017).
3. S. Kook, C. D. Swetha, J. Lee, C. Lee, T. Fane, and I. S. Kim, “Forward osmosis membranes under null-pressure condition: Do hydraulic and osmotic pressures have identical nature?”, Environ. Sci.
Technol., 52, 3556 (2018).
4. A. J. Ansari, F. I. Hai, W. E. Price, J. E. Drewes, and L. D. Nghiem, “Forward osmosis as a platform for resource recovery from municipal wastewater - A critical assessment of the literature”, J. Memb.
Sci., 529, 195 (2017).
5. M. Zhan, G. Gwak, D. Inhyuk, K. Park, and S.
Hong, “Quantitative analysis of the irreversible membrane fouling of forward osmosis during waste- water reclamation: Correlation with the modified fouling index”, J. Memb. Sci., 597, 117757 (2020).
6. S. S. Manickam and J. R. McCutcheon, “Under- standing mass transfer through asymmetric mem- branes during forward osmosis: A historical per- spective and critical review on measuring structural parameter with semi-empirical models and charac- terization approaches”, Desalination, 421, 110 (2017).
7. E. Yang, C. M. Kim, J. Song, H. Ki, M. H. Ham, and I. S. Kim, “Enhanced desalination performance of forward osmosis membranes based on reduced graphene oxide laminates coated with hydrophilic polydopamine”, Carbon, 117, 293 (2017).
8. W. Xu, Q. Chen, and Q. Ge, “Recent advances in forward osmosis (FO) membrane: Chemical mod- ifications on membranes for FO processes”, De- salination, 419, 101 (2017).
9. D. M. Warsinger, S. Chakraborty, E. W. Tow, M.
H. Plumlee, C. Bellona, S. Loutatidou, L. Karimi,
A. M. Mikelonis, A. Achilli, A. Ghassemi, L. P.
Padhye, S. A. Snyder, S. Curcio, C. D. Vecitis, H.
A. Arafat, and J. H. Lienhard, “A review of poly- meric membranes and processes for potable water reuse”, Prog. Polym. Sci., 81, 209 (2018).
10. D. Xiao, W. Li, S. Chou, R. Wang, and C. Y.
Tang, “A modeling investigation on optimizing the design of forward osmosis hollow fiber modules”, J. Memb. Sci., 392-393, 76 (2012).
11. D. L. Shaffer, J. R. Werber, H. Jaramillo, S. Lin, and M. Elimelech, “Forward osmosis: Where are we now?”, Desalination, 356, 271 (2015).
12. C. M. Werner, B. E. Logan, P. E. Saikaly, and G.
L. Amy, “Wastewater treatment, energy recovery and desalination using a forward osmosis mem- brane in an air-cathode microbial osmotic fuel cell”, J. Membr. Sci., 428, 116 (2013).
13. R. V. Linares, Z. Li, S. Sarp, S. S. Bucs, G. Amy, and J. S. Vrouwenvelder, “Forward osmosis niches in seawater desalination and wastewater reuse”, Water Res., 66, 122 (2014).
14. J. Jang, I. Park, S. S. Chee, J. H. Song, Y. Kang, C. Lee, W. Lee, M. H. Ham, and I. S. Kim,
“Graphene oxide nanocomposite membrane cooper- atively cross-linked by monomer and polymer over- coming the trade-off between flux and rejection in forward osmosis”, J. Memb. Sci., DOI:10.1016/j.
memsci.2019.117684 (In press).
15. S. Lin, “Mass transfer in forward osmosis with hollow fiber membranes”, J. Memb. Sci., 514, 176 (2016).
16. https://www.forwardosmosistech.com/the-4-differ- ent-designs-of-forward-osmosis-fo-membrane-modules/, March 30 (2014).
17. https://aquaporin.com/fo/, October 17 (2019).
18. https://www.forwardosmosistech.com/hollow-fiber-for- ward-osmosis-membrane-modules/, March 28 (2014).
19. M. Brannock, Y. Wang, and G. Leslie, “Mixing characterisation of full-scale membrane bioreactors:
CFD modelling with experimental validation”, Water Res., 44, 3181 (2010).
20. P. Sousa, A. Soares, E. Monteiro, and A. Rouboa,
“A CFD study of the hydrodynamics in a desalina-
tion membrane filled with spacers”, Desalination,
349, 22 (2014).21. A. Cahyadi, S. Yang, and J. W. Chew, “CFD study on the hydrodynamics of fluidized granular acti- vated carbon in AnFMBR applications”, Sep. Purif.
Technol., 178, 75 (2017).
22. C. Lee, S. Kook, C. Choi, T. T. Nguyen, and I. S.
Kim, “Effects of membrane envelope geometry on hydrodynamics inside draw channel of forward os- mosis spiral wound membrane element”, Desalin.
Water Treat., 112, 282 (2018).
23. C. Choi, C. Lee, N.-S. Park, and I. S. Kim,
“Numerical study of fluid behavior on protruding shapes within the inlet part of pressurized mem- brane module using computational fluid dynamics”, Environ. Eng. Res., DOI:10.4491/eer.2018.423 (In Press).
24. L. Zhuang, H. Guo, P. Wang, and G. Dai, “Study on the flux distribution in a dead-end outside-in hollow fiber membrane module”, J. Membr. Sci.,
495, 372 (2015).25. F. Parvaza, S. H. Hosseinib, K. Elsayedc, and G.
Ahmadid, “Numerical investigation of effects of inner cone on flow field, performance and erosion rate of cyclone separators”, Sep. Purif. Technol.,
201, 223 (2018).26. F. Zhou, G. Sun, Y. Zhang, H. Ci, and Q. Wei,
“Experimental and CFD study on the effects of sur- face roughness on cyclone performance”, Sep. Purif.
Technol., 193, 175 (2018).
27. M. Usta, M. Morabito, A. Anqi, M. Alrehili, A.
Hakim, and A. Oztekin, “Twisted hollow fiber membrane modules for reverse osmosis-driven de- salination”, Desalination, 441, 21 (2018).
28. M. Shibuya, M. Yasukawa, S. Goda, H. Sakurai, T. Takahashi, M. Higa, and H. Matsuyama, “Expe- rimental and theoretical study of a forward osmosis hollow fiber membrane module with a cross-wound configuration”, J. Memb. Sci., 504, 10 (2016).
29. S. P. Motevalian, A. Borhan, H. Zhou, and A.
Zydney, “Twisted hollow fiber membranes for en-
hanced mass transfer”, J. Memb. Sci., 514, 586
Effect of Twisted Hollow Fiber Membranes in a Module 77
![Table 1 shows the modeling parameters used in this study, following[30].](https://thumb-ap.123doks.com/thumbv2/123dokinfo/5468079.439467/3.892.81.817.170.414/table-shows-modeling-parameters-used-study-following.webp)