pISSN 1738-3544 eISSN 2288-1662
Impact of Asymmetric Middle Cerebral Artery Velocity on Functional Recovery in Patients with Transient Ischemic Attack or Acute Ischemic Stroke
Minho Han 1 , Hyo Suk Nam 2
1
Department of Neurology, Yonsei University College of Medicine, Department of Science for Aging, Yonsei University Graduate School, Seoul, Korea
2
Department of Neurology, Yonsei University College of Medicine, Seoul, Korea
일과성허혈발작 및 급성뇌경색환자에서 경두개도플러로 측정된 중간대뇌동맥 비대칭 지수가 환자 예후에 미치는 영향
한민호 1 , 남효석 2
1
연세대학교 의과대학 신경과학교실, 연세대학교 일반대학원 노화과학협동과정,
2연세대학교 의과대학 신경과학교실
This study examined whether the difference in the middle cerebral artery (MCA) velocities can predict the prognosis of stroke and whether the prognostic impact differs among stroke subtypes.
Transient ischemic attack (TIA) or acute ischemic stroke patients, who underwent a routine evaluation and transcranial Doppler (TCD), were included in this study. The MCA asymmetry index was calculated using the relative percentage difference in the mean flow velocity (MFV) between the left and right MCA: (|RMCA MFV-LMCA MFV|/mean MCA MFV)×100. The stroke subtypes were determined using the TOAST classification. Poor functional outcomes were defined as a mRS score
≥3 at 3 months after the onset of stroke. A total of 988 patients were included, of whom 157 (15.9%) had a poor functional outcome. Multivariable analysis showed that only the MCA asymmetry index was independently associated with a poor functional outcome. ROC curve analysis showed that adding the MCA asymmetry index to the prediction model improved the discrimination of a poor functional outcome from acute ischemic stroke (from 88.6% [95% CI, 85.2
∼91.9] to 89.2% [95% CI, 85.9∼92.5]). The MCA asymmetry index has an independent prognostic value for predicting a poor short-term functional outcome after an acute cerebral infarction.
Therefore, TCD may be useful for predicting a poor functional outcome in patients with acute ischemic stroke.
Key words: Transcranial doppler ultrasonography, Middle cerebral artery, Asymmetry
Corresponding author: Hyo Suk Nam Department of Neurology, Yonsei University College of Medicine, 50-1 Yonsei-ro, Seodaemun-gu, Seoul, 03722, Korea Tel: 82-2-2228-1617
Fax: 82-2-393-0705 E-mail: [email protected]
This is an Open Access article distributed under the terms of the Creative Commons Attribution Non-Commercial License (http://creativecommons.org/licenses/by-nc/4.0) which permits unrestricted non-commercial use, distribution, and reproduction in any medium, provided the original work is properly cited.
Copyright © 2018 The Korean Society for Clinical Laboratory Science. All rights reserved.
Received: February 28, 2018 Revised 1
st: March 15, 2018 Revised 2
nd: March 28, 2018 Revised 3
rd: April 6, 2018 Revised 4
th: April 6, 2018 Accepted: April 7, 2018
INTRODUCTION
Transcranial Doppler (TCD) ultrasonography is used to noninvasively find any symptoms of intracranial
atherosclerosis by measuring the mean flow velocity
(MFV) and pulsatility index (PI) of basal cerebral arteries. A
large increase in MFV indicates vessel narrowing due to
cerebrovascular diseases, which is dependent on the
extent of arterial stenosis and strongly related to vascular risk factors [1]. In addition, the PI, which is used to estimate hemodynamics in portions distal to insonated vessels, is associated with peripheral resistance at the level of basal cerebral arteries, and consequently with disorders related to the small vessels [2]. Most studies in stroke research have investigated these 2 parameters. Some studies have shown that an increased flow velocity is a reliable parameter for assessing focal intracranial stenosis and has a prognostic value for stroke recurrence [3,4].
Other researchers have reported that an elevated PI is associated with cerebrospinal fluid pressure, cognitive performance, and infarct volume in patients with lacunar infarcts [5-7]. However, there is relatively little infor- mation on the laterality of each parameter, which includes the association between the lateral difference and some disorders such as cluster headache and acute intracerebral hemorrhage [8, 9]. Especially, a few studies have addressed the relation of the middle cerebral artery (MCA) asymmetry index to the prognosis of patients with transient ischemic attack (TIA) or acute ischemic stroke.
The laterality of the MFV means the relative difference between the MFVs of the left and right MCAs, which is called the MCA asymmetry index as an illuminating term.
The MCA asymmetry index may be increased in the presence of intracranial arterial disease [10]. In the present study, we aimed to evaluate whether the MCA asymmetry index, measured in patients with acute ischemic stroke, has a prognostic value for predicting short-term func- tional outcome and whether this prognostic value differs among stroke subtypes.
MATERIALS AND METHODS
1. Patients
This study was a hospital-based, retrospective obser- vational study. There were 7,462 candidates who were admitted to the neurology department because of acute brain infarction or TIA within 7 days of symptom onset, between January 2001 and December 2014, and were prospectively registered in the Yonsei Stroke Registry. Of
them, we excluded 3,023 patients according to the exclusion criteria. Of the remaining 4,439 candidates, 988 patients completed the TCD measurements of the MFVs of both MCAs during hospitalization.
2. Evaluation
The patients required at least 1 vascular imaging study, including conventional angiography, magnetic resonance angiography (MRA), or computed tomographic angiography (CTA). Standard systemic investigations were performed in every patient, which included 12-lead electrocardiography (ECG), chest radiography, and blood tests. Carotid duplex sonography, transthoracic echocardiography, transeso- phageal echocardiography, and 24-h Holter ECG monitoring were performed in selected patients. TCD was a part of the standard evaluation to obtain the MCA asymmetry index, except in patients with poor temporal window in either temple. The demographics, vascular risk factors, and neurologic examination including the National Institutes of Health Stroke Scale (NIHSS) score and modified Rankin Scale (mRS) score at 3 months after stroke onset were collected at baseline. We excluded patients with a history of old stroke, malignancy, and stroke of other causes, and/or those without data on the NIHSS score at admission, mRS score at 3 months after stroke onset, and complete laboratory study or cerebral angiography. The Institutional Review Board (IRB) of Severance Hospital, Yonsei University Health System approved this study and waived the need for informed consent because of the retrospective and observational nature of the analysis (IRB 4-2016-1151).
3. Measurement of TCD parameters
The patients underwent TCD examination (TC8080, Nicolet, Stockport, UK) within 7 days of admission. All TCD recordings were carried out by 2 medical technicians.
In all patients, peak systolic flow velocity (PSV) and
end-diastolic flow velocity (EDV) were measured with a
handheld 2-MHz probe in both MCAs. The MCAs were
insonated through the trans-temporal window at various
depths from 44 to 68 mm. The MFV value was auto-
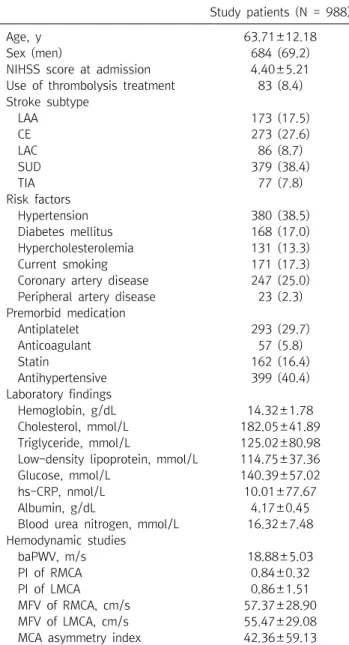
Table 1. Clinical characteristics of included patients
Study patients (N = 988)
Age, y 63.71±12.18
Sex (men) 684 (69.2)
NIHSS score at admission 4.40±5.21
Use of thrombolysis treatment 83 (8.4) Stroke subtype
LAA 173 (17.5)
CE 273 (27.6)
LAC 86 (8.7)
SUD 379 (38.4)
TIA 77 (7.8)
Risk factors
Hypertension 380 (38.5)
Diabetes mellitus 168 (17.0)
Hypercholesterolemia 131 (13.3)
Current smoking 171 (17.3)
Coronary artery disease 247 (25.0) Peripheral artery disease 23 (2.3) Premorbid medication
Antiplatelet 293 (29.7)
Anticoagulant 57 (5.8)
Statin 162 (16.4)
Antihypertensive 399 (40.4)
Laboratory findings
Hemoglobin, g/dL 14.32±1.78
Cholesterol, mmol/L 182.05±41.89
Triglyceride, mmol/L 125.02±80.98
Low-density lipoprotein, mmol/L 114.75±37.36
Glucose, mmol/L 140.39±57.02
hs-CRP, nmol/L 10.01±77.67
Albumin, g/dL 4.17±0.45
Blood urea nitrogen, mmol/L 16.32±7.48 Hemodynamic studies
baPWV, m/s 18.88±5.03
PI of RMCA 0.84±0.32
PI of LMCA 0.86±1.51
MFV of RMCA, cm/s 57.37±28.90
MFV of LMCA, cm/s 55.47±29.08
MCA asymmetry index 42.36±59.13
Data are expressed as mean±standard deviation or number (%).
The MCA asymmetry index indicates the percentage of difference between the mean velocities of the LMCA and RMCA.
Abbreviations: NIHSS, National Institutes of Health Stroke Scale;
LAA, large-artery atherosclerosis; CE, cardioembolism; LAC, small-vessel occlusion; SUD, stroke of undetermined etiology owing to multiple causes or negative evaluation; TIA, transient ischemic attack; baPWV, brachial-ankle pulse wave velocity;
RMCA, right middle cerebral artery; LMCA, left middle cerebral artery; PI, pulsatility index; MFV, mean flow velocity.
matically calculated by the Doppler machine by using the mean of 5 cycles, according to the formula MFV=EDV +(PSV-EDV)/3. The PI value was simultaneously calcu- lated as (PSV-EDV)/MFV [4]. The recorded MFV and PI values were measured for at least 2 depths to include hemodynamic information on the proximal MCA (M1, 58-68 mm) and the distal MCA (M2, 44-56 mm). The 2 highest MFVs and PIs, measured in both proximal and distal portions, were finally averaged to derive the ultimate MFV and PI for statistical analysis, respectively. We also created an asymmetry index (MCA asymmetry index) by using the bilateral ultimate MFVs to investigate whether the difference of both ultimate MFVs has prognostic value for predicting functional outcome after acute cerebral infarction, and whether the prognostic value differs among stroke subtypes. The MCA asymmetry index was calculated as the following formula [11];
The MCA asymmetry index=
100× |RMCA MFV - LMCA MFV|
(RMCA MFV+LMCA MFV)/2
4. Data collection for analysis
We collected the patients’ baseline characteristics including sex, age, severity of neurological deficit (NIHSS score) at admission, details of risk factors, and premorbid use of medications (Table 1). The NIHSS score is a tool used to objectively quantify the impairment caused by a stroke.
The high score is indicative of more severe impairment [12]. Hypertension was diagnosed when a patient was using antihypertensive medications or had systolic arterial pressures ≥140 mm Hg or diastolic arterial pressures ≥90 mm Hg on repeated measurements during admission [13].
Diabetes mellitus was diagnosed when a patient had taken an oral hypoglycemic agent or insulin or had fasting plasma glucose level ≥7.0 mmol/L [14]. Hyperchole- sterolemia was diagnosed when a patient had taken lipid-lowering agents after a diagnosis of hyperchole- sterolemia or had low-density lipoprotein cholesterol level ≥4.1 mmol/L, or total cholesterol level ≥6.2 mmol/L
[15]. Current smoking was defined as having smoked a
cigarette within 1 year before admission. Peripheral artery
disease was determined when the patient had an
ankle-brachial index of <0.9.
Figure 1. Flowchart of the inclusion and exclusion criteria. NIHSS, Na- tional Institutes of Health Stroke Scale;
mRS, modified Rankin Scale; MCA, middle cerebral artery.
5. Classification of stroke subtype
We used the TOAST (Trial of Org 10172 in the Acute Stroke Treatment) classification to subdivide the patients into 4 groups: those with small vessel occlusion (LAC), large-artery atherosclerosis (LAA), cardioembolism (CE), and stroke of undetermined cause (SUD) [12]. Cerebral angiographic findings were obtained from digital subtraction angiography, MRA, or CTA, which were performed at admission, to classify the stroke subtype. All cerebral angiographic findings and the stroke subtypes were evaluated and determined during the weekly stroke conference, after a consensus was reached by stroke specialists. The patients were then prospectively registered in the Yonsei Stroke Registry.
6. Determination of functional outcome
Stroke-related functional outcome was assessed using the mRS score through a direct interview performed by a physician or through a telephone interview conducted by a well-trained research nurse after 3 months from stroke onset. The mRS consists of 6 different grades of disability, from a score of 0 for “no symptoms at all”; to 5 for “severe
disability or bedridden, incontinent, and requiring constant nursing care and attention”; and to 6 for death.
We defined good and poor functional outcomes as mRS scores of <3 and ≥3, respectively [12].
7. Statistical analysis
Statistical significance of intergroup differences was assessed using the 2 test for categorical variables and the Mann-Whitney U-test for non-normal continuous variables. After yielding the cutoff value of the MCA asymmetry index, the 2 test was used to analyze the association between stroke subtype and MCA asymmetry index cutoff value. Before investigating the predictive effect of the MCA asymmetry index for poor functional outcome, the patients were subdivided into tertile groups (T1-T3) according to the level of MCA asymmetry index.
Then, we performed multivariable logistic regression with
adjustments for sex, age, and variables that exhibited a
P-value of <0.05 in the univariable analyses. For evaluating
the discriminatory ability of the MCA asymmetry index in
predicting functional outcomes, receiver operating cha-
racteristic curve analysis was used. The area under the
curve (AUC) was calculated, and the optimal cutoff value
Figure 2. Mean MCA asymmetry index according to stroke subtype in the total group. LAA, large-artery atherosclerosis; LAC, small-vessel occlusion; CE, cardioembolism; SUD, stroke of undetermined etiology owing to multiple causes or negative evaluation; TIA, transient ischemic attack.
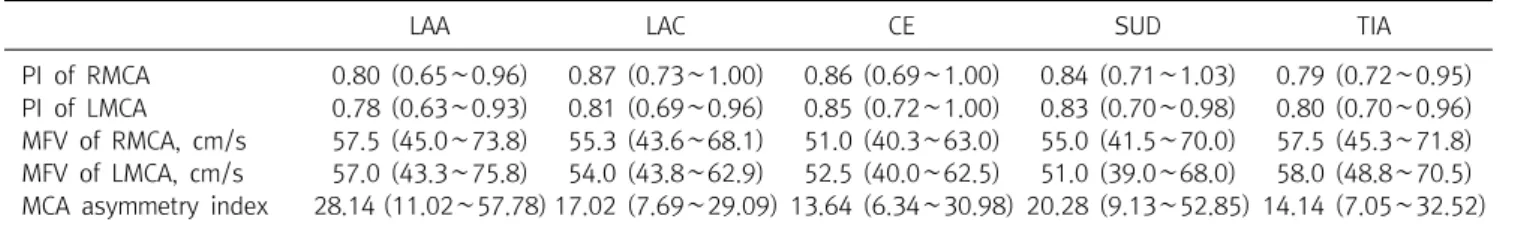
Table 2. Association between stroke subtype and MCA asymmetry cutoff value
LAA LAC CE SUD TIA
PI of RMCA 0.80 (0.65∼0.96) 0.87 (0.73∼1.00) 0.86 (0.69∼1.00) 0.84 (0.71∼1.03) 0.79 (0.72∼0.95) PI of LMCA 0.78 (0.63∼0.93) 0.81 (0.69∼0.96) 0.85 (0.72∼1.00) 0.83 (0.70∼0.98) 0.80 (0.70∼0.96) MFV of RMCA, cm/s 57.5 (45.0∼73.8) 55.3 (43.6∼68.1) 51.0 (40.3∼63.0) 55.0 (41.5∼70.0) 57.5 (45.3∼71.8) MFV of LMCA, cm/s 57.0 (43.3∼75.8) 54.0 (43.8∼62.9) 52.5 (40.0∼62.5) 51.0 (39.0∼68.0) 58.0 (48.8∼70.5) MCA asymmetry index 28.14 (11.02∼57.78) 17.02 (7.69∼29.09) 13.64 (6.34∼30.98) 20.28 (9.13∼52.85) 14.14 (7.05∼32.52) Data are expressed as median [interquartile range].
Abbreviations: LAA, large-artery atherosclerosis; LAC, small-vessel occlusion; CE, cardioembolism; SUD, stroke of undetermined etiology owing to multiple causes or negative evaluation; TIA, transient ischemic attack; baPWV, brachial-ankle pulse wave velocity; RMCA, right middle cerebral artery; LMCA, left middle cerebral artery; PI, pulsatility index; MFV, mean flow velocity.
of MCA asymmetry index was determined at the level with the highest Youden index (sensitivity + specificity-1). To measure the improvement in predictive ability by adding the MCA asymmetry index, we computed the change of AUC between the multivariable models with and without the MCA asymmetry index cutoff value. All statistical analyses were performed using the Windows SPSS package version 20.0 (SPSS Inc., Chicago, IL, USA). A 2-sided P-value of <0.05 was considered statistically significant.
RESULTS
During the study period, 7,462 patients with acute ischemic stroke were registered in the Yonsei Stroke Registry. After eliminating 3,023 patients according to the
exclusion criteria, 4,439 candidates remained for this study. Of these, 988 subjects who had completed the measurements of MFVs of both MCAs were finally included (Figure 1).
The characteristics of the participants are summarized in Table 1. In a total of 988 patients, the mean age was 63.71±12.18 years and the proportion of men was 69.2%.
The mean MCA asymmetry index value was 42.36±59.13%,
and the median (interquartile range) was 17.61 (8.02-
41.31). Of the stroke subtypes, LAA had the highest MCA
asymmetry index, followed by SUD in the total group
(Figure 2, Table 2). According to the mRS score at 3 months
after stroke onset, the patients were subdivided into 2
groups: good functional outcome (mRS score <3) and
poor functional outcome (mRS score ≥3) [12]. The poor
functional outcome group consisted of 157 (15.9%)
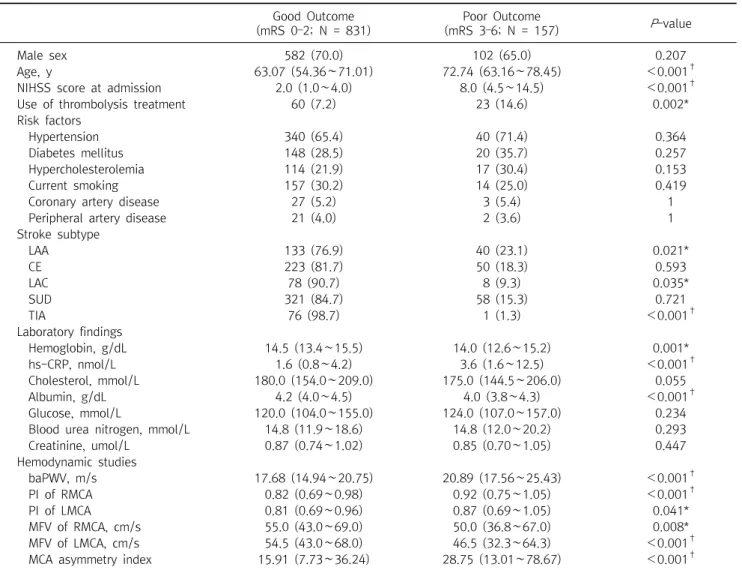
patients. Poor functional outcome was positively associated
with older age, higher NIHSS score at admission, higher
level of high-sensitivity C-reactive protein, higher
brachial-ankle pulse wave velocity (baPWV), higher PI of
the right MCA (RMCA) and left MCA (LMCA), and higher
MCA asymmetry index. Use of thrombolysis treatment,
LAA, LAC, TIA, hemoglobin, hs-CRP, albumin, and both
MFVs were negatively associated with poor functional
outcome (Table 3). In univariable analysis to evaluate the
association between stroke subtype and MCA asymmetry
index cutoff value, the group with higher MCA asymmetry
index included more patients with LAA but fewer patients
with CE (Table 4). In the multivariable analysis including
diverse forms of the MCA asymmetry index (tertiles, cutoff
value, and continuous variable), only the optimal cutoff
point of the MCA asymmetry index remained as an
Table 3. Clinical characteristics between good and poor functional outcomes Good Outcome
(mRS 0–2; N = 831)
Poor Outcome
(mRS 3–6; N = 157) P -value
Male sex 582 (70.0) 102 (65.0) 0.207
Age, y 63.07 (54.36∼71.01) 72.74 (63.16∼78.45) <0.001
†NIHSS score at admission 2.0 (1.0∼4.0) 8.0 (4.5∼14.5) <0.001
†Use of thrombolysis treatment 60 (7.2) 23 (14.6) 0.002*
Risk factors
Hypertension 340 (65.4) 40 (71.4) 0.364
Diabetes mellitus 148 (28.5) 20 (35.7) 0.257
Hypercholesterolemia 114 (21.9) 17 (30.4) 0.153
Current smoking 157 (30.2) 14 (25.0) 0.419
Coronary artery disease 27 (5.2) 3 (5.4) 1
Peripheral artery disease 21 (4.0) 2 (3.6) 1
Stroke subtype
LAA 133 (76.9) 40 (23.1) 0.021*
CE 223 (81.7) 50 (18.3) 0.593
LAC 78 (90.7) 8 (9.3) 0.035*
SUD 321 (84.7) 58 (15.3) 0.721
TIA 76 (98.7) 1 (1.3) <0.001
†Laboratory findings
Hemoglobin, g/dL 14.5 (13.4∼15.5) 14.0 (12.6∼15.2) 0.001*
hs-CRP, nmol/L 1.6 (0.8∼4.2) 3.6 (1.6∼12.5) <0.001
†Cholesterol, mmol/L 180.0 (154.0∼209.0) 175.0 (144.5∼206.0) 0.055
Albumin, g/dL 4.2 (4.0∼4.5) 4.0 (3.8∼4.3) <0.001
†Glucose, mmol/L 120.0 (104.0∼155.0) 124.0 (107.0∼157.0) 0.234
Blood urea nitrogen, mmol/L 14.8 (11.9∼18.6) 14.8 (12.0∼20.2) 0.293
Creatinine, umol/L 0.87 (0.74∼1.02) 0.85 (0.70∼1.05) 0.447
Hemodynamic studies
baPWV, m/s 17.68 (14.94∼20.75) 20.89 (17.56∼25.43) <0.001
†PI of RMCA 0.82 (0.69∼0.98) 0.92 (0.75∼1.05) <0.001
†PI of LMCA 0.81 (0.69∼0.96) 0.87 (0.69∼1.05) 0.041*
MFV of RMCA, cm/s 55.0 (43.0∼69.0) 50.0 (36.8∼67.0) 0.008*
MFV of LMCA, cm/s 54.5 (43.0∼68.0) 46.5 (32.3∼64.3) <0.001
†MCA asymmetry index 15.91 (7.73∼36.24) 28.75 (13.01∼78.67) <0.001
†Data are expressed as median [interquartile range] or number (%).
The MCA asymmetry index indicates the percentage of difference between the mean velocities of the LMCA and RMCA.
* P <0.05.
†
P <0.001.
Abbreviations: mRS, modified Rankin Scale score; NIHSS, National Institutes of Health Stroke Scale; LAA, large-artery atherosclerosis;
CE, cardioembolism; LAC, small-vessel occlusion; SUD, stroke of undetermined etiology owing to multiple causes or negative evaluation;
TIA, transient ischemic attack; baPWV, brachial-ankle pulse wave velocity; RMCA, right middle cerebral artery; LMCA, left middle cerebral artery; PI, pulsatility index; MFV, mean flow velocity.
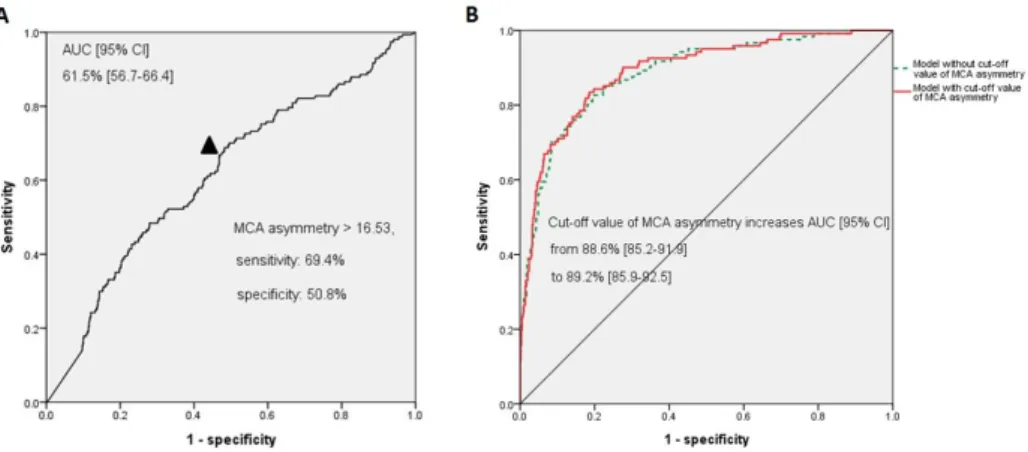
independent predictor of poor functional outcome. No significant interaction between stroke subtype and poor functional outcome was noted. NIHSS score at admission, use of thrombolysis treatment, and baPWV were still significant after adjusting for confounding variables (Table 5). In the receiver operating characteristic curve analysis (Figure 3), when the continuous value of the MCA asymmetry index was considered a predictor of poor functional outcome, the AUC was 61.5% (95% confidence interval [CI], 56.7-66.4). The optimal cutoff point of the
MCA asymmetry index was >16.53 m/s (at this point, the sensitivity was 69.4% and the specificity was 50.8%). When we compared the AUC of multivariable models with and without the MCA asymmetry index, the AUC was increased from 88.6% (95% CI, 85.2-91.9) to 89.2% (95%
CI, 85.9-92.5).
DISCUSSION
In this study, we found that a higher MCA asymmetry
Table 5. Predictive value of the MCA asymmetry index for poor functional outcomes
Univariable Multivariable
OR (95% CI) P -value HR (95% CI) P -value
Male sex 0.793 (0.554∼1.137) 0.208 0.763 (0.355∼1.640) 0.488
Age, y 1.067 (1.049∼1.085) 0.001* 1.012 (0.975∼1.051) 0.530
NIHSS score at admission 1.231 (1.190∼1.273) <0.001
†1.271 (1.179∼1.369) <0.001
†Use of thrombolysis treatment 2.206 (1.319∼3.689) 0.003* 0.285 (0.088∼0.916) 0.035*
Hemoglobin, g/dL 0.855 (0.780∼0.938) 0.001* 1.021 (0.800∼1.301) 0.869
hs-CRP, nmol/L 1.001 (0.999∼1.002) 0.466 0.999 (0.990∼1.008) 0.797
Albumin, g/dL 0.341 (0.238∼0.487) <0.001
†0.873 (0.393∼1.938) 0.738
baPWV, m/s 1.001 (1.001∼1.002) <0.001
†1.110 (1.035∼1.190) 0.004*
PI of RMCA 1.842 (1.085∼3.126) 0.024* 1.612 (0.450∼5.782) 0.464
PI of LMCA 1.003 (0.899∼1.118) 0.964 2.195 (1.007∼4.783) 0.048*
Stroke subtype
LAA 1.665 (1.061∼2.612) 0.027* 1.368 (0.598∼3.130) 0.459
CE 1.241 (0.819∼1.879) 0.308 0.420 (0.175∼1.010) 0.053
LAC 0.568 (0.260∼1.238) 0.155 1.161 (0.372∼3.623) 0.797
SUD 1 1
MCA asymmetry index tertiles
T1: <10.79 1 1
T2: 10.79∼29.86 1.485 (0.924∼2.385) 0.102 1.493 (0.642∼3.471) 0.352
T3: >29.86 2.721 (1.750∼4.229) <0.001
†2.143 (0.898∼5.113) 0.086
At optimal cut-point
MCA asymmetry index >16.53 2.343 (1.625∼3.378) <0.001
†2.420 (1.176∼4.978) 0.016*
As a continuous variable
MCA asymmetry index, per SD (59.13) 1.005 (1.002∼1.007) <0.001
†1.003 (0.997∼1.009) 0.375 Data were derived from logistic regression analysis.
The MCA asymmetry index indicates the percentage of difference between the mean velocities of the LMCA and RMCA.
* P <0.05.
†
P <0.001.
Abbreviations: NIHSS, National Institutes of Health Stroke Scale; baPWV, brachial-ankle pulse wave velocity; RMCA, right middle cerebral artery; LMCA, left middle cerebral artery; PI, pulsatility index; LAA, large-artery atherosclerosis; CE, cardioembolism; LAC, small-vessel occlusion; SUD, stroke of undetermined etiology owing to multiple causes or negative evaluation; CI, confidence interval; OR, odds ratio;
T, tertile.
Table 4. Association between stroke subtype and MCA asymmetry cutoff value
Stroke subtypes
At optimal cut-point MCA asymmetry
index ≤16.53
MCA asymmetry
index >16.53 P -value
LAA 58 (33.5) 115 (66.5) <0.001
†CE 162 (59.3) 111 (40.7) <0.001
†LAC 40 (46.5) 46 (53.5) 0.653
SUD 166 (43.8) 213 (56.2) 0.139
Data are expressed as a number (%).
The MCA asymmetry index indicates the percentage of difference between the mean velocities of the left and right MCAs.
†