Vol. 16, No. 6 pp. 3870-3881, 2015
Contemporary Financial Profile and Its Implications on the Level of Corporate Cash Holdings for Korean Chaebol Firms
Hanjoon Kim
1*1Division of Business Administration, Hoseo University
한국 재벌기업들의 현금유동성 수준 결정요인과 재무적 분석
김한준1*
1호서대학교 사회과학대학 경영학부
Abstract This study examined one of the contemporary issues on debate to identify any significant financial determinants on the cash holdings of the cheabol firms in the Korean domestic capital markets. Several important findings on the financial characteristics affecting the cash holdings were evidenced by utilizing various methodologies for statistical estimations. Financial or managerial implications with discussion were provided for the pronounced factors such as CASHFLOW, MVBV, REINVEST, and AGENCY. Assuming that the chaebol firms were overall subject to the financial constrains, they may increase or stockpile cash reserves as internal capital for future investment opportunities or repayment of existing debt, rather than external financing burdened by a high cost of capital. Given the on-going controversy on the optimal level of corporate cash holdings coupled with any foreseeable capital transfer among the associated nations through the investment vehicles such the FTAs (Free Trade Agreements) or TPP (Trans-Pacific Pacts), any empirical findings of the study may shed new light on identifying financial determinants which may significantly affect the level of cash holdings for the business conglomerates, the ‘chaebol’ firms, in the Korean capital markets.
요 약 본 논문의 주제는 최근 국내 자본시장 내에서 거시적 혹은 재무적 측면에서 정부, 기업, 그리고 투자자의 견지에서 가장 활발한 논란이 되고 있다고 판단되는 국내 기업들, 특히 재벌그룹 소속 계열사들의 적정 현금유동성 수준에 대한 내용 이다. 즉, 동 기업별로 현금 보유수준의 적정성을 탐구하기 위하여, 이와 관련된 재무적 측면에서의 결정요인을 분석하는 것이 본 연구의 주된 실행 동기이다. 다양한 계량경제적인 모델들을 활용하여, 국제금융위기 이후부터 최근의 자료 기간 동안 (2009-2013년), 동 현금유동성 수준에 영향을 줄 수 있는 대용변수들을 분석하였으며, 다양한 설명변수들의 선정관련 현금유 동성 수준의 사전적 재무이론의 국제적 근간이 되는 상충관계이론, 자금조달순서이론, 그리고 대리인비용이론 등이 중심적으 로 사용되었다. 분석결과, 재벌기업들의 현금보유 수준에 영향을 준다고 판단되는 통계적 유의성 있는 설명변수들로서는 현 금흐름, 시장가 대비 장부가 비율, 재투자비율, 그리고 대리인비용 등 4가지 변수들이었고 이 변수들은 다수의 통계적 모형들 에서 일관성 있게 유의성을 나타내었다. 종속변수인 재벌기업들의 현금유동성 수준과 동 대용변수들의 관계적 분석과 이론 적 암시 등이 본문 내용 중에 서술되었으며, 현재 활발히 진행되고 있는 국제간 투자협정들 (FTAs 혹은 TPPs) 체결 관련, 해외 투자가들의 국내 직접 혹은 간접 투자분야에서도 본 논문 결과가 해당 기업들의 현금유동성 적정성 분석에 유용하게 사용될 수 있기를 기대한다.
Key Words : Cash Holdings, Chaebol, Korean Capital Markets, Static Panel Data Models, Tobit Regression
*Corresponding Author: Hanjoon Kim(Hoseo Univ.) Tel : +82-41-560-8369 email: [email protected] Received February 28, 2015
Accepted June 11, 2015
Revised (1st May 26, 2015, 2nd June 10, 2015) Published June 30, 2015
1. Introduction
This study addresses one of the contemporary issues
in finance on the financial determinants of the level of cash holdings for the firms belonging to the chaebols in the Korean domestic capital markets. It may still be
an on-going controversial subject between the policy makers at the government and the corporate levels, since the former tends to drive domestic corporations to increase their level of external expenditures through the type of new investments or dividends. This may, in turn, boost the stagnant domestic economic condition at the macro- and/or micro-levels. It was reported that the amount of total cash holdings retained by 500 largest domestic corporations as of the 3rd quarter of 2014, enlarged to about 158 trillion increased from the previous level of 94.5 trillion KRW in the year-end of 2007. [1] While there were relatively ample researches on the possible financial attributes of corporate cash holdings or reserves in the international context, little attention seems to have been received for the domestic firms, especially classified into the large business conglomerates, so-called as the ‘chaebols’. Therefore, the primary aim of this study is to identify or demonstrate any essential elements possibly affecting the level of cash holdings for the firms belonging to the chaebols, (referred to as the 'chaebol firms’
hereafter) during the recent investigated period from the year, 2009 to 2013 in the post-era of the global financial turmoil.
The primary motivations performing this study may be described as follows: First, in line with major motives to possess cash holdings from a corporate manager’s perspective such as precautionary, transactional and speculative ones, theoretical components which may affect the level of cash and its equivalents, are rationalized in terms of the financial rationale such as trade-off, pecking order, and agency theories, respectively, as presented in [2]. Second, it would be of interest and intriguing to examine any optimal or quasi-optimal solution on the level of case reserves which may be useful to settle or reconcile any disparities between the policy decision makers at the government and the firm levels, as described.
Therefore, it is anticipated that any outcome derived from the study may be utilized as a helm to navigate for the optimal liquidity levels for the chaebol firms,
which may drive on-going controversy between the two parties into any conclusion to be a virtuous cycle.
Lastly, by employing various statistical or econometric estimation methodologies including static panel data model, two stage least squares regression, and Tobit regression, any pronounced financial determinants of cash holdings for the Korean chaebol irms tested with the estimation techniques, may gain more weights on reinforcing their robustness and consistency.
This study is organized as follow: Followed by the introduction section, theoretical rationale on a firm’s cash holding motives and major previous studies on the related subject were reviewed in the previous literature within the international context. Data and statistical methodologies were presented in the subsequent section and the results obtained from the estimations were then analyzed and interpreted for their financial implications. Concluding remarks were presented in the last section.
2. Theory and Literature Review
2.1 Theoretical Rationale
As exposited, there were mainly three theoretical principles accounting for holding cash reserves from a firm's perspective such as trade-off, pecking order, and agency theories.
Under the first proposition of the trade-off theory, a level of corporate cash holdings tends to be determined by the reconciliation between its marginal costs and marginal benefits to search for its optimal level. The former may mainly arise from the cost being involved in the differences between any earnings and expenses by holding an extra unit of cash, while the latter (i.e., the marginal benefits) may largely result from a minimization of transaction cost including of the cost of liquidating assets and also the precautionary motive in association with asymmetric information, as described in [3]. In finance, Myers’ pecking order theory in relation to a firm’s liquidity level, implied
that retained earnings in the form of cash and its equivalents may have its priority in financing over senior debt, subordinate debt and then equity in sequence, due to the possibility of any asymmetric information in terms of external financing.
Consequently, a firm with a higher degree of financial distress or undervaluation may prefer to utilize internal financing alternative channeled by its cash savings, which may minimize any informational distortion between corporate manager and investor. Moreover, Jensen [4] presented his seminal theory on agency costs of free cash flow, in which these costs may increase, as a level of cash holdings controlled by the corresponding agent or manager who may not be in his or her shareholders’ best interest, e.g., ‘moral hazard’.
To avoid or mitigate the moral hazard incurred by any excessive cash reserves saved by the company, the shareholders may well look to the level as low as possible as expected. Given the aforementioned three theories supporting to find a firm’s optimal point of cash holdings, this study employed and tested for major financial characteristics in association with representing these theories. That is, any statistically significant explanatory variables may contribute to searching for the optimal level for the chaebol firms, which is deemed to be one of the objectives of the study.
2.2 Literature Review
Al-Najjar[3] examined financial determinants of corporate cash holdings in emerging capital markets inclusive of the 'BRICs' markets such as Brazil, Russia, India, and China for the period 2002 - 2008. Moreover, the results obtained from those emerging nations were compared with the profile of the cash reserves derived from the US and the UK markets. He summarized that as one of the theoretical framework for cash reserves, trade-off theory indicates that a firm's value may be maximized by considering the marginal costs and marginal benefits of holding cash. The pecking-order theory may suggest that there is no optimal level of
cash reserves in terms of asymmetric information, which was determined by the Myers' hierarchical order of financing. By employing five explanatory variables such as leverage, dividend payout ratio, profitability, liquidity, and size along with controlling for time effect (dummy), this study found that most of the independent variables were statistically significant effects on the level of cash holdings across the investigated nations inclusive of the US and the UK during the sample period. Furthermore, he utilized the IV (instrumental variable) analysis depending on two-stage least squares procedure and argued that firm specific financial characteristics such as leverage, dividend payout ratio, and firm size, may be more important in determining cash holding decision. Strong shareholder protection in legal system seemed to be a negative and statistically significant factor on the decision as well. Anjun and Malik [5] tested 395 domestic firms listed on the Pakistan stock exchange (Karachi) during the sample period, 2005-2011, and tested to detect their financial determinants of cash holdings compared with the results obtained from the previous researches in the similar subject. Among the theoretical explanatory variables as proposed financial determinants on the cash holding decision, (i.e., firm size, net working capital, leverage, cash conversion cycle, sales growth), all of the variables except sale growth were found to be statistically significant which may affect the decision: the former proxies such as size and net working capital showed their positive relationship with cash holdings, whereas the latter ones revealed negative linkage with the dependent variable in a statistical context. Farinha and Prego [6] recently presented the results on the financial factors affecting the level of liquidity for the domestic firms headquartered in Portugal during the period of 1995 to 2012. They tested the relationships between cash flow, on one hand, and its past volatility, on the other hand, and liquidity, given the existence of financing constraints. By utilizing dynamic panel data analysis (i.e., 'first system' model), they employed major
exogenous variables (on the dependent variable of cash holding ration,) such as investment rate and cash-flow to identify any financial determinants for the domestic firms in the pre- and post-era of the European financial crisis. Moreover, the proxies for leverage and net working capital showed their negative and statistically significant impact on the level of liquidity.
Shah [7] performed empirical tests on the components on a firm's cash holdings for the firms listed on the domestic stock bourse in Pakistan over the studied period from 1996 to 2008. By utilizing static and dynamic panel models to test for those possible determinants, he found that a degree of a firm' short-term financing and it liquidity ratio other than cash holdings showed negatively significant impacts on the level of cash holdings, respectively. However, there were statistically significant and positive relationship on cash holdings with respect to a firm's growth opportunities, size, dividend payments defined by dividend per share scaled by face value of a share, and cash flow. More interestingly, the ratio of the cash-to-assets for domestic firms, was, on average, almost equivalent to those of the developed countries, which was not generally expected in theory. He argued that this phenomenon may, in large part, be attributed to relatively inefficient judicial system of the domestic market on the bankruptcy process.
To recap, primary differences of the present study in comparison with those results obtained from the previous literature, may be consummated as follows.
These, as any additional contributions, may complement the previous ones on the subject of financial characteristics of a firm's cash hoarding.
First, it is expected that any products or outcomes obtained from the study may be effectively compared to those of the previous literature based on the inter- and/or intra- country context. Taking into account the conclusions derived from the comparisons, the ultimate focus to search for an optimal point of cash holdings for the domestic firms inclusive of the chaebol subsidiaries may be reinforced by identifying and
applying their commonalities and/or unique attributes derived from the comparisons. Second, foreign (institutional) investors who may enter into the domestic markets in the type of either foreign direct investments (FDI) or indirect investments through portfolio diversification, may further gain more insight into the firm structure of the Korean business conglomerates, the chaebol firms, in terms of the liquidity level. As going on, the domestic economic policy in Korea, seems to drive in pursuing or engaging in a wide spectrum of cross-country pacts with her new counterparts such the free trade agreements (FTAs) and the trans-pacific partnership (TPPs) across the manufacturing and the service sectors. Finally, relatively little attention has been drawn to do reseach for the financial characteristics of the chaebol firms in financial theories and practices to date, thereby enhancing applications of any results obtained from the study to trace an optimal point of cash reserves for the chaebol firms.
3. Data and Ecnometric Estimations
3.1 Data Selection
The data to examine possible financial determinants on the cash holdings for the chaebol firms in the domestic markets were screened and finally selected, according to the guideline reported in Table 1, whose selection criteria for the sample chaebol firms had also similarly adopted in the previous literature such as [8].
The sample period of this study with spanned from the year, 2009 to 2013 (for 5 years), accounting for any spillover effects originated from the global financial turmoil to be mitigated.
Pertaining to selecting the proxy variables representing a dependent variable (DV) and various independent variables (IDVs) in each corresponding model, first, most of them were supported by the relevant theories such as the trade-off, pecking order, and agency costs ones, as previously illustrated.
1. All the data for the variables employed in each corresponding model were available for at least five years from 2009 to 2013, which was covering the post-era of the global financial turmoil.
2. The sample firms were listed on either the KOSPI or the KOSDAQ bourses during the studied period.
3. They were also included in the population of the database of New KisValue sourced by the NICE.
4. The criteria to classify a firm into being the chaebol one during the studied period, were set in accordance with the guidelines by the Fair Trade Commission (FTC) in the Republic of Korea, such that it was the one classified into a ‘Large Business Group’, subject to the ceiling limits on cross-shareholding mechanism.
5. Financial and regulated industries were not included in the final sample.
Table 1. Criteria to Select the Sample Chaebol Firms Listed on the Domestic Stock Exchanges
Second, a majority of these variables were also empirically tested as proposed attributes of the level of cash holdings in the previous literature of similar subject, whose results may be effectively compared with those obtained from the present study toward robustness and consistency. Finally, all the data should be available from the database adopted during the tested period.
3.1.1 Dependent Variables (DVs)
Each of the following two variables representing a firm’s cash holdings was separately employed as a dependent variable (DV) in each model of this study for the chaebol firms, The first one was adopted for the
‘level’ measurement on the DV, while the second one is for the ‘difference’ estimate for the corporate cash holdings.:
(1-1) DV1 = (Casht + Cash Equivalentst + Marketable Securitiest / Total Assetst
(1-2) DV2 = DV1t – DV1t-1 = {(Casht + Cash Equivalentst + Marketable Securitiest / Total Assetst) - {(Casht-1 + Cash Equivalentst-1
+Marketable Securitiest-1)/ Total Assetst-1}
The endogenous variables as DVs, were widely utilized for the measurement of a firm’s cash holdings in the previous researches such as in [3] and [9],
thereby enhancing the possibility of effective comparisons between the preceding results and the ones of the present study toward robustness and consistency, as described.
3.1.2. Independent Variables (IDVs)
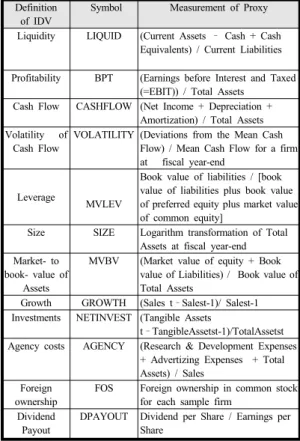
A wide spectrum of independent variables (IDVs) was screened and employed as proposed explanatory determinants to affect the level of liquidity for the chaebol firms, based on their relative importance in the finance theories and/or previous empirical results, as described below. The following table, Table 2 lists the definitions and measurement for the IDVs used in the study.
Table 2. Definition for the Independent Variables (IDVs) Definition
of IDV
Symbol Measurement of Proxy Liquidity LIQUID (Current Assets – Cash + Cash
Equivalents) / Current Liabilities Profitability BPT (Earnings before Interest and Taxed
(=EBIT)) / Total Assets Cash Flow CASHFLOW (Net Income + Depreciation +
Amortization) / Total Assets Volatility of
Cash Flow
VOLATILITY (Deviations from the Mean Cash Flow) / Mean Cash Flow for a firm at fiscal year-end
Leverage
MVLEV
Book value of liabilities / [book value of liabilities plus book value of preferred equity plus market value of common equity]
Size SIZE Logarithm transformation of Total Assets at fiscal year-end Market- to
book- value of Assets
MVBV (Market value of equity + Book value of Liabilities) / Book value of Total Assets
Growth GROWTH (Sales t–Salest-1)/ Salest-1 Investments NETINVEST (Tangible Assets
t–TangibleAssetst-1)/TotalAssetst Agency costs AGENCY (Research & Development Expenses
+ Advertizing Expenses + Total Assets) / Sales
Foreign ownership
FOS Foreign ownership in common stock for each sample firm
Dividend Payout
DPAYOUT Dividend per Share / Earnings per Share
Incorporated with their theoretical background, the following IDVs seemed to share higher commonalities with those tested in the majority of the previous empirical studies across the inter- and intra-country
context, as proposed determinant of cash reserves, ([5], [10], [11]): firm size, liquidity, leverage, profitability, growth rate of sales, cash flow, and market- to book-value of total assets. Furthermore, volatility of cash flow was tested as defined by the ratio of the deviations from mean cash flow to mean cash flow for a firm at fiscal year-end as presented in [7]. It is also of concern whether or not the domestic government policy directing to increase a firm’s dividend payout to its shareholders, may have a significant impact on the level of cash holdings it stockpiled. It is plausible that a lot of domestic firms may have conserved their cash reserves against any possibilities of financial turmoil for the precautionary purpose, which may be associated with the Myers’ theory of pecking order in corporate financing. Consequently, it was also of intriguing issue to examine any positive or inverse relationship between the level of dividend payout (DPAYOUT) and a firm’s cash holdings.
3.2 Statistical Estimations
3.2.1 Hypothesis and Estimation Techniques The following hypothesis was postulated to test for financial profile of cash reserves.
H0: There were no statistically significant financial determinants of cash holdings for the firms belonging to the chaebols in the Korean capital markets.
Several econometric estimations were utilized to identify any components affecting a chaebol firm’s level of cash with employing the aforementioned dependent variable (i.e., DV1 or DV2) and independent variables (IDVs) for robustness and consistency. The estimation methodologies included the static and the dynamic panel models, and Tobit regression model as well as two stage least squares (2SLS) regression model. The general description of the models was briefly described as follows:
3.2.1.1 Static Panel Data Model
‘Static’ panel data model applied to the present
study is a one-way group model and can be restated as follows [11]:
Yit=b0 + b1X1it + b2X2it +...+ bkXkit + ai + uit
, where ai is an unobserved effect. uit is the error term assumed to be independent and identically distributed.
i = 1, 2, ..., n (for each firm), and t=the fiscal years from 2009 to 2013. k = total number of exogenous variables, and j = 1, 2, ...., k. If Cov (Xjit, ai)=0, a random effects model. Otherwise, a fixed effects model.
'Static' panel data analysis tested either the fixed or random effects of group or time, and the major difference between the two models may be dependent on the assumption of dummy variables, as also described in [13]. In other words, if dummies are assumed to be a part of the intercept, it is estimated in terms of a fixed effect model. Otherwise, it may be a random effect one, being assumed dummy variables to be a part of an error term. [14]. When utilizing the
‘static’ panel data regression model to test for the hypothesis, this study legitimately chose the most appropriate estimate for a coefficient among the pooled OLS, the fixed effects, and the random effects model, by performing a priori tests such as F (Wald) test, Breusch-Pagan Lagrange Multiplier test, and Hausman (specification) test, as presented in [15].
3.2.1.2 Tobit Regression Model
When a regressand is classified as a limited dependent variable in the regression analysis, Tobit model (or censored regression one) may be considered to be a useful method to estimate each coefficient in the model. If a dependent variable (e.g., DV1 in the present study) has a binary classification, Tobit model may be denoted as follows [16]:
Yt = a + bXt + Ut, if Yt > 0 ,or Yt = 0 if Yt < 0
Concerning the estimations procedure for the model, an index function, It = a + bXt+Ut was utilized to be set to zero, if It < 0, otherwise the value of a dependent variable set to It, itself. The joint probability density
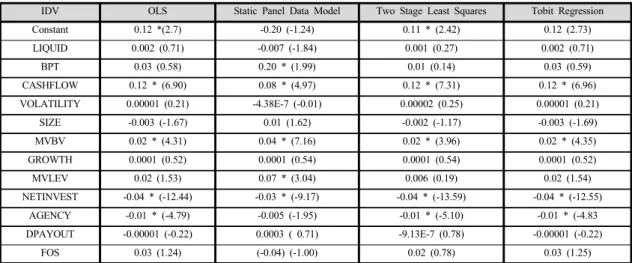
IDV OLS Static Panel Data Model Two Stage Least Squares Tobit Regression
Constant 0.12 *(2.7) -0.20 (-1.24) 0.11 * (2.42) 0.12 (2.73)
LIQUID 0.002 (0.71) -0.007 (-1.84) 0.001 (0.27) 0.002 (0.71)
BPT 0.03 (0.58) 0.20 * (1.99) 0.01 (0.14) 0.03 (0.59)
CASHFLOW 0.12 * (6.90) 0.08 * (4.97) 0.12 * (7.31) 0.12 * (6.96)
VOLATILITY 0.00001 (0.21) -4.38E-7 (-0.01) 0.00002 (0.25) 0.00001 (0.21)
SIZE -0.003 (-1.67) 0.01 (1.62) -0.002 (-1.17) -0.003 (-1.69)
MVBV 0.02 * (4.31) 0.04 * (7.16) 0.02 * (3.96) 0.02 * (4.35)
GROWTH 0.0001 (0.52) 0.0001 (0.54) 0.0001 (0.54) 0.0001 (0.52)
MVLEV 0.02 (1.53) 0.07 * (3.04) 0.006 (0.19) 0.02 (1.54)
NETINVEST -0.04 * (-12.44) -0.03 * (-9.17) -0.04 * (-13.59) -0.04 * (-12.55)
AGENCY -0.01 * (-4.79) -0.005 (-1.95) -0.01 * (-5.10) -0.01 * (-4.83
DPAYOUT -0.00001 (-0.22) 0.0003 ( 0.71) -9.13E-7 (0.78) -0.00001 (-0.22)
FOS 0.03 (1.24) (-0.04) (-1.00) 0.02 (0.78) 0.03 (1.25)
<Note> * denotes statistical significance at the 5% level and numeric number in parentheses indexes t-statistic for each estimated coefficient.
Table 3. Results of Estimation for Each IDV for DV1 by Applying Each Corresponding Econometric Method function is given by the following expression:
P1=P (1/σ) f[(Yt-a-bXt)/σ], if Yt > 0 ,or P2= P F[[(Yt-a-bXt)/σ], if Yt < 0
Based on the joint probability function for the entire sample observations being as L = P1 x P2, each coefficient in the model, (i.e.,a and b) can be obtained by applying the maximum likelihood estimation such that the likelihood function, L, is maximized with respect to the parameters in the model.
Besides the aforementioned methodologies, this study employed another statistical estimation techniques such as two stage least squares (2 SLS), For example, to mitigate a possibility of endogeneity between the dependent (i.e., cash holdings) the independent variables, the variable measuring net working capital (NWC) was adopted as an instrument variable (IV) when the dependent variable was regressed on the exogenous variables through the 2 SLS procedure, as in [3].
4. Analysis and Discussion
4.1 Analysis
As described earlier, this particular study employed various econometric estimation methods to identify
statistically significant financial determinants for the level of cash holdings of the chaebol firms. Since one of the objectives of the present study is to obtain more robust and consistent results on the financial factors, it seems to be appropriate to apply primary estimation methodologies which had also been utilized in the previous literature of the related subject. For reference, statistical estimation methods such as OLS regression, static panel data model, 2 SLS, and Tobit regression were used to estimate each coefficient of the IDVs run by the SAS (version 9.4) package. The results reported in Table 3 and Table 4, showed statistical relationships between the IDVs as proposed financial characteristics and each corresponding dependent variable, DV1 and DV2, respectively.
First, the overall goodness of fit by using the OLS regression for the DV1 and DV2 was statistically explained by the employed IDVs at the significant level of 5% with F-statistic of 85.22 (p-value < 0.0001) for the former DV and that of 2.70 (p-value = 0.0014).
Each IDV in the model showed the value of VIF less than 10, indicating a lower possibility of multi-colinearity issue. While four IDVs among the entire twelve explanatory variables such as CASHFLOW, MVBV, NETINVEST, and AGENCY were found to be statistically significant on the relationship to the DV1
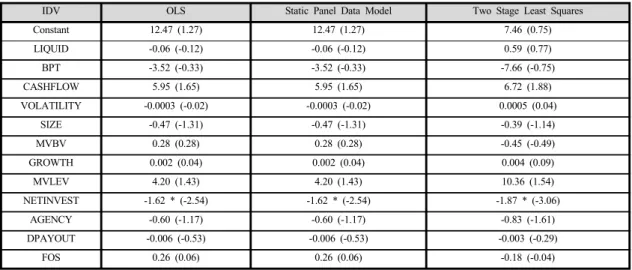
IDV OLS Static Panel Data Model Two Stage Least Squares
Constant 12.47 (1.27) 12.47 (1.27) 7.46 (0.75)
LIQUID -0.06 (-0.12) -0.06 (-0.12) 0.59 (0.77)
BPT -3.52 (-0.33) -3.52 (-0.33) -7.66 (-0.75)
CASHFLOW 5.95 (1.65) 5.95 (1.65) 6.72 (1.88)
VOLATILITY -0.0003 (-0.02) -0.0003 (-0.02) 0.0005 (0.04)
SIZE -0.47 (-1.31) -0.47 (-1.31) -0.39 (-1.14)
MVBV 0.28 (0.28) 0.28 (0.28) -0.45 (-0.49)
GROWTH 0.002 (0.04) 0.002 (0.04) 0.004 (0.09)
MVLEV 4.20 (1.43) 4.20 (1.43) 10.36 (1.54)
NETINVEST -1.62 * (-2.54) -1.62 * (-2.54) -1.87 * (-3.06)
AGENCY -0.60 (-1.17) -0.60 (-1.17) -0.83 (-1.61)
DPAYOUT -0.006 (-0.53) -0.006 (-0.53) -0.003 (-0.29)
FOS 0.26 (0.06) 0.26 (0.06) -0.18 (-0.04)
Table 4. Results of Estimation for Each IDV for DV2 by Applying Each Corresponding Econometric method
across the majority of the models tested, only one IDV as NETINVEST was detected as a significant one affecting another endogenous variable, DV2. Second, with respect to the outcome derived from the static panel data analyses, the most appropriate models fitting the relationship between the explanatory and endogenous variables were selected by the aforementioned selection criteria in the previous section such that fixed effects model was for the DV1 reported in Table 3 and pooled OLS one for the DV2 in Table 4, respectively. Therefore, regarding the former model (i.e., fixed effects model) finally selected for the DV1, the corresponding F-test for no fixed effects was not accepted with its extreme p-value (<0.0001), accompanied by the rejection of the a priori tests such as Hausman specification test (p-value <0.0001) and Breusch-Pagan (BP) test (p-value <0.0001) from the output of the SAS package. On the other hand, all of the aforementioned prior tests were accepted at the 5 % level of statistical significance so that the pooled OLS was finally chosen for the DV2. To recap, most statistically important factors affecting the chaebol firm’s cash holdings in the domestic capital market were CASHFLOW, MVBV, MVLEV, and NETINVEST for the DV1, but the proxy variable, NETINVEST, was the only regressor to influence on the second alternative regressand, DV2, which was consistent with
the OLS result in Table 4. As an alternative estimation, two SLS regressions were also conducted in the possibility of reinforcing the results of the study toward validity. In the methodological application to mitigate 'endogeneity' problem, instrumental variable (IV) of NWC as a measurement for net working capital was adopted by considering the commonalties of the variable in the various models of the previous literature. On the results obtained from the test as Table 3, the IDVs such as CASHFLOW, MVBV, NETINVEST, and AGENCY were analyzed to possess their significant effects on the DV1, while NETINVEST was still the only and most pronounced determinant to affect the DV2 with a negative sign of coefficient reported in Table 4. Finally, Tobit estimation technique was implemented by taking into account the asymmetric feature of the dependant variable, DV1, which is bounded from the value of zero. (A comparable test for the DV2 was not conducted in this case, due to the limited boundary condition greater than 0.) A majority of the theoretical variables found to be statistically significant in the other estimation techniques, shared their commonalities with those identified by Tobit procedure (i.e., CASHFLOW, MVBV, NETINVEST, and AGENCY) to account for cash holdings as reported in Table 3.
4.2 Discussion
By utilizing major statistical methodologies as presented in the section for analysis, this study provided evidences of several explanatory variables as significant determinants of the cash holdings of the chaebol firms in the Korean capital markets. These findings may provide important financial implications for the policy decision makers at the government and/or the corporate level, given the contemporary circumstance debating the optimal levels of cash reserves for the domestic large firms. The following explications may suggest important financial interpretations on the primary variables found to be significant in theory and empirical results:
First, CASHFLOW defined as (net income + depreciation + amortization) scaled by total assets in Table 2, was detected to have its positive association with the dependent variable of DV1 for the chaebol firms. Gill & Shah [2] found a statistically significant and positive linkage between the cash flow and its dependent variable as corporate cash holdings for the entire sample firms in the manufacturing and the service sectors which were headquartered in Canada, while there were no material effects on the cash holdings when separately tested for the firms in either the former or the latter sector. Holioka and Terade-Hagiwara [11] asserted that the sign and magnitude of the cash flow sensitivity of cash is theoretically ambivalent, which may be dependent of the degree of financial constraints faced by a firm and of the relationship between its cash flow and productivity. Subsequently, a firm must increase its level of liquid assets for cash flow innovations if they may be subject to financial constraint in association with a limited access to the credit. Their findings comprehending the sample firms located in Asian nations, provided an evidence of the pronounced and positive impact of cash flow on the corporate cash holdings for the Korean sample firms with and without employing industry dummies in the models. The evidence of the present study on the positive effect of
the chaebol firm’s cash flow on the level of cash flow, may be consistent with those results of the majority of the previous researches. That is, this phenomenon may imply that most firms including the larger size chaebol firms in the domestic markets, may still pay more attention or be wary of the future possibilities of the financial constraints accompanied by a limited access of credit markets, which was also related to one of the aforementioned motives of cash reserves, the precautionary one, for the preparation of future unpleasant and unanticipated financial turmoil, as experienced in the late 1990s for the Asian financial crisis and the late 2000s for the global financial. In spite of on-going advance of the corporate financing for the domestic firms inclusive of the multinational- based chaebol firms, there still seemed to exist room for further development for financing alternatives to overcome relatively constrained financial conditions, even for the chaebol firms. Second, this study identified another positive association between MVBV defined by the market- to book value of a firm, and DV1. In a majority of the previous literature, MVBV seemed to be fundamentally functioned as a proxy variable representing Tobin’s Q theorized in modern finance, given the limited availability and reliability of the data in the capital markets, for the replacement costs as a denominator in its definition. Holioka &
Terade-Hagiwara [11] presented a positive coefficient of Tobin’s Q on the cash holdings, which was largely attributed to the positive ‘productivity shocks’ resulting in higher stockpiles of cash flow. This result was also corroborated by the results of the study of Lian et al.
[9] with its positive effect on the level of cash holdings, which was utilizing the Tobin’s Q as a proxy for investment opportunities. It was generally believed in finance that a firm with more investment opportunities may well be expected to generate higher net present values (NPVs) as described in [17].
Therefore, it seems to be possible that a higher level of MVBV of a firm may direct it to conserve more cash reserves for future investment opportunities, which
may, in turn, be realized in a relatively lavish cash flow as a sequence of business cycle. However, it may be argued that a firm with higher investment opportunities deemed to be subject to less financial constraints for external financing in terms of Myers’
pecking order theory, if a degree of the information asymmetry is not a material factor when deciding to raise a capital. Even if the Korean capital markets tend to approach from semi-strong form to strong form in terms of the well-known finance theory of market hypothesis for efficiency, the chaebol firms were still likely to face with financial constrains arising from asymmetric information, thereby increasing or accruing their levels of liquidity as a source for internal financing, to commensurate with any possibilities of profitable investment opportunities. Third, as one of the theoretical backgrounds supporting the determinants of a firm’s cash holdings, agency costs may have been received little attention to be tested in the previous research. As described earlier, a proxy of AGENCY defined by [advertising expenses + research &
development expenses + total assets] / sales was adopted as a proposed financial attribute and were detected to be prominent and negative influence on the DV1, as reported in Table 3. In the study done by Subramaniam et al. [10] to investigate an a priori rationale on the inverse relationship between the proxy variable for agency costs and the level of cash holdings, they corroborated the following negative relationship between the two variables: the larger was the variable for agency costs, which means that the higher are the agency costs, and the lower must be the cash holdings. Therefore, the results obtained from the study may correspond with those of the previous studies on the theoretical linkage between the variables, which may also be applied to the Korean chaebol cases. Subsequent to the aforementioned empirical results, it may also be plausible to reinforce or enhance the status quo system of the chaebol sample firms in terms of electing or managing outside directors as well as activating the cumulative voting rights when
organizing the new boards. Fourth, NETINVEST representing the change in capital expenditure on tangible assets, year on year, demonstrated its pronounced and consistent impacts on the cash holdings of the chaebol firms measured across the DV1 and the DV2, as reported in Table 3 and Table 4. In particular, this IDV with a negative sign of its estimated coefficient was the only important variable on the latter dependent variable which was the yearly difference between the levels of cash holdings denoted as DV1. Farinha & Prego [6] presented that a negative relationship was theoretically expected between investment rates (measured by a ratio between total investment and total assets) and the level of cash holdings, due to higher aptness to be used as collateral for credit, as a firm’s investments in assets inclusive of the type of tangible assets, increase. Based on the results of the pervasively inverse relationship between the NETINVEST and the dependent variables obtained from the studies, financing practice of the chaebol firms may be patterned in accordance with the Myers’
pecking order theory which was also one of the rationale comprising a firm’s optimal level of cash savings, as discussed earlier. This phenomenon may also be in support of the previous findings on the positive association between the chaebol firms’ cash flow and cash holdings, which may indicate their financial constraints with limited access to external financing, even if most chaebol firms may maintain relatively higher credit ratings than those of small or medium size counterparts in the domestic markets.
5. Concluding Remarks
This study investigated one of the contemporary issues on debate to identify any significant financial determinants on the cash holdings of the cheabol firms in the Korean domestic capital markets.
Several important findings on the financial characteristics affecting the cash holdings were
evidenced by utilizing various methodologies for statistical estimations. That is, financial or managerial implications with discussion were provided for the pronounced factors such as CASHFLOW, MVBV, REINVEST, and AGENCY. There may be weaknesses of the study within the context of a legitimate empirical research. Any disparate results across each research over time may suffer from different data collection and methodologies to derive the its outcomes. Morevoer, new or additional proxy variables may substitute for or entered in the future study of the similar subject. For example, new explanatory variables at the macro-level, may be another elements to account for the level of a firm’s cash holdings such as interest rate and exchange rate.
However, this study may contribute to the existing literature on the corporate cash holdings in the following aspects. First, as described, relatively little attention has been drawn on the research, whose academic purposes were inclusive of the financial determinants of the liquidity level for the chaebol firms. Therefore, the results may be useful to access any optimal levels of corporate cash savings for the business organizations as well. Second, various econometric methodologies were implemented to test for the hypothesis on the financial profile. By utilizing the comprehensive estimation techniques, it is expected that any robustness and consistency on the results may be enhanced. Given the on-going controversy on the optimal level of corporate cash holdings coupled with any foreseeable capital transfer among the associated nations through the investment vehicles such the FTAs (Free Trade Agreements) or TPP (Trans-Pacific Pacts), any empirical findings of the study may shed new light on identifying financial determinants which may significantly affect the level of cash holdings for the chaebol firms. Moreover, any results obtained from the present study may be extended for further research by utilizing the financial determinants identified as significantly important factors affecting the level of cash holdings for the Korean chaebol firms. In other
words, an optimal point of cash savings for the firms, may be traced or found by applying the determinants (as explanatory variables) to an appropriate models such as a trade-off theory of corporate cash holdings.
It is, in turn, expected to utilize any models to maximize a firm's value by identifying an optimal point of liquidity in a practical purpose for mutual benefit between corporate manager and investor.
References
[1] The Yonhapnews, Available From http://www.yonhap news.co.kr/dev/9601000000.html(accessed Feb. 16, 2015) [2] A. Gill and C. Shah, “Determinants of Corporate Cash
Holdings: Evidence from Canada,” International Journal of Economics and Finance, pp. 70-79, Vol.4, No.1, 2012.
[3] B. Al-Najjar, “The Determinants of Corporate Cash Holdings: Evidence from Some Emerging Markets,”
International Business Review, pp. 77-88, Vol.22, 2013.
DOI: http://dx.doi.org/10.1016/j.ibusrev.2012.02.004 [4] M. C. Jensen, “Agency Costs of Free Cash Flow,
Corporate Finance and Takeovers,” American Economic Review, pp. 323-329, Vol.76, 1986.
[5] S. Anjun and Q. A. Malik, “Determinants of Corporate Liquidity – An Analysis of Cash Holdings,” IOSR Journal of Business and Management, pp. 94-100, Vol.7, No.2, 2013.
DOI: http://dx.doi.org/10.9790/487X-07294100
[6] L. Farinah. and P. Prego, “Cash Holdings Determinants in the Portuguese Economy,” Financial Stability Report, pp. 107-115, May, 2014.
[7] A. Shah, “The Corporate Cash Holdings: Determinants and Implications,” African Journal of Business Management, pp. 12939-12950, Vol.5, No.34, 2011.
[8] H. Kim, “Investigations on the Financial Determinants of Profitability for Korean Chaebol Firms by Applying Conditional Quantile Regression (CQR) Model,” Journal of the Korea Contents Association, pp. 973-988, vol.14, No.12, 2014.
DOI: http://dx.doi.org/10.5392/JKCA.2014.14.12.973 [9] Y. Lian, M. Sepehri, and M. Foley, “Corporate Cash
Holdings and Financial Crisis: An Empirical Study of Chinese Companies,” Eurasian Business Review, pp.
112-124, Vol.1, No.2, 2011.
[10] V. Subramaniam,, T. T. Tang, H. Yue, and X. Zhou,
“Firm Structure and Corporate Cash Holdings,” Journal of Corporate Finance, 759-773, Vol.17, 2011.
[11] C. Y. Horioka and A. Terada-Hagiwara, “Corporate Cash Holding in Asia,” Asian Economic Journal, pp. 323-345, Vol.28, No.4, 2014.
[12] J. M. Wooldridge, Introductory Econometrics: A Modern Approach, South-Western Cengage Learning, Canada, 2009.
[13] H. Kim, "Further Investigations on the Financial Attributes of the Firms Listed in the KOSDAQ Stock Market," International Journal of Contents, pp.27-37, Vol.9, No.2, 2013.
[14] H. Park, "Linear Regression Models for Panel Data Using SAS, Stata, LIMDEP, and SPSS." Working Paper, The University Information Technology Services (UITS), Center for Statistical and Mathematical Computing, Indiana University, 2009, [Available From:
http://www.indiana.edu/~statmath/stat/all/panel (Accessed Feb. 8, 2014)
[15] H. Park, “Practical Guides to Panel Data Analysis,”
2011, [Available From:http://www.iuj.ac.jp/faculty/kucc 625/writing/panel_guidelines.pdf (Accessed March. 12, 2014)
[16] R. Ramanathan, Introductory Econometrics with Applications, Dryden, Florida, 1992.
[17] H. Kim, “Further Analyses on the Contemporary Changes of Profitability for the Firms Belonging to the Chaebol in the Republic of Korea”, Journal of the Korea Contents Association, pp. 367-384, Vol.14, No.6, 2014.
DOI: http://dx.doi.org/10.5392/JKCA.2014.14.06.367
Hanjoon Kim [Regular member]
•Sept., 1987 : The George Washington Univ., MBA
•Jan., 1999 : Boston University DBA (Major: Finance)
•Mar. 2010 ~ Present: Hoseo Univ. Dept. of Business Administration, Assistant Professor
<Research Interests>
Corporate Finance, International Finance, Mergers &
Acquisitions, Equity Valuation