Socioeconomic Disparities in the Prevalence, Diagnosis, and Control of Hypertension in the Context of a Universal Health Insurance System
A lower use of preventive intervention in low socioeconomic populations has been described in countries with universal coverage health care systems, but little is known about the possible socioeconomic inequalities in secondary prevention in a universal health insurance system. Data from the 2010–2013 Korea National Health and Nutrition
Examination Survey, a nationwide survey, were analyzed. A total of 20,044 subjects older than 30 years of age were included after excluding subjects with missing data. Prevalence ratios were calculated using Poisson regression models with robust variance to explore factors associated with the prevalence, unawareness, and inappropriate control of hypertension. Hypertension prevalence decreased with increasing education and income level. We observed an inverse association between education level and undiagnosed hypertension among women, but not men. Socioeconomic level was not associated with inadequate control of hypertension among men or women. Future interventions should include primary prevention efforts targeted at lower socioeconomic populations to reduce disparities. There is substantial room for improvement in secondary prevention efforts.
Monitoring strategies may highlight gaps in the preventive and care services offered to the most vulnerable individuals and encourage governments and practitioners to address these gaps.
Keywords: Hypertension; Prevalence; Awareness; Control; Universal Coverage Hoo-Yeon Lee
Department of Social Medicine, Dankook University College of Medicine, Cheonan, Korea
Received: 17 September 2016 Accepted: 1 January 2017 Address for Correspondence:
Hoo-Yeon Lee, MD, PhD
Department of Social Medicine, Dankook University College of Medicine, 201 Manghyang-ro, Dongnam-gu, Cheonan 31116, Republic of Korea
E-mail: hylee@dankook.ac.kr
Funding: This research was supported by the research fund of Dankook University in 2014.
https://doi.org/10.3346/jkms.2017.32.4.561 • J Korean Med Sci 2017; 32: 561-567
INTRODUCTION
Hypertension, or high blood pressure, affected 26.4% of the world’s adult population (972 million) in 2000, and this rate is expected to increase to 29.2% (1.56 billion) by 2025 (1). Hyper- tension is a major contributor to the global disease burden and was responsible for 7.0% of all disability-adjusted life years in 2010 (2). It is associated with at least 7.6 million deaths per year worldwide (13.5% of all deaths), making it the leading risk fac- tor for cardiovascular disease (CVD) (3). High blood pressure has been identified as a leading risk factor for health problems in both developing and developed countries (3).
During the past 3 decades, the number of people with un- controlled hypertension has increased to approximately 1 bil- lion worldwide. Those with silent hypertension are often sus- ceptible to premature myocardial infarction and haemorrhagic stroke (4,5). Among hypertensive individuals, 25.2%–75.0% are aware of their hypertension, and among those aware of their hypertension status, treatment rates range from 37.9%–89.6%.
In developed countries, 18.7%–54.5% of treated hypertensive patients attain their blood pressure goals (1).
The importance of blood pressure as a modifiable risk factor
for CVD is well-recognized, and many effective and inexpen- sive blood pressure-lowering treatments are available. There- fore, hypertension control and prevention of subsequent mor- bidity and mortality clearly should be achievable (3). Education to encourage screening and adequate treatment is an essential part of the strategy to reduce the burden of disease associated with hypertension. Education strategies first require assessing the factors that are associated with awareness, treatment, and control of hypertension in the target population (1,6). Lower rates of preventive interventions among low socioeconomic populations have been reported in countries that have a uni- versal coverage healthcare system (7). However, little is known about the possible socioeconomic inequalities in secondary prevention among hypertension patients. Information about the prevalence, awareness, and control of hypertension in dif- ferent types of communities is necessary not only to provide a baseline for monitoring the development and implementation of new strategies, but also to allocate appropriate healthcare re- sources (6).
In this study, hypertension risk factors were evaluated accord- ing to the prevalence, awareness, and control of hypertension.
We specifically investigated socioeconomic disadvantages and Medicine General & Social Medicine
weaknesses within the context of the Korean universal health insurance system. The findings will be useful for public health decision-makers and healthcare professionals.
MATERIALS AND METHODS Data sources and participants
This study was based on data obtained from the 2010–2013 Ko- rea National Health and Nutrition Examination Survey (KNH- ANES V), a nationwide survey examining the general health and nutrition status of the Korean population. It included 4 dis- tinct measures: a health interview survey, health behaviour sur- vey, health examination, and health nutrition survey. A strati- fied, multistage probability sampling design was used.
The response rates were 81.9% in 2010, 80.4% in 2011, 80.0%
in 2012, and 79.3% in 2013. A total of 20,044 subjects older than 30 years of age were included after excluding subjects with miss- ing data.
Measurements and variables
According to standard protocol, trained nurses measured sys- tolic blood pressure (SBP) and diastolic blood pressure (DBP) using a mercury sphygmomanometer (Baumanometer; WA Baum Co, Inc., New York, NY, USA) on the right arm of the sub- ject while sitting after resting for 5 minutes. Blood pressure was measured thrice, and the second and third measurements were averaged. Subjects were asked to refrain from smoking for 30 minutes before the measurements (8).
Hypertension was defined as; 1) a self-reported previous di- agnosis of hypertension made by a physician, 2) current use of antihypertensive medication, or 3) SBP ≥ 140 mmHg or DBP
≥ 90 mmHg. Participants with hypertension who reported that they had not been diagnosed with this condition or did not take antihypertensive medication were classified as having undiag- nosed hypertension. Subjects were considered to have uncon- trolled hypertension if they had an average SBP ≥ 140 mmHg or an average DBP ≥ 90 mmHg.
Current smoking was defined as having smoked 100 cigarettes in one’s lifetime and currently smoking cigarettes. Current drink- ing was defined as alcohol intake more than once per month during the past 12 months (9). Central obesity was defined as a waist circumference of at least 90 cm in men and at least 80 cm in women. Overweight was defined as a body mass index (BMI) of 25.0–29.9, and obesity was defined as a BMI of 30.0 or higher.
A family history of hypertension was coded when first-degree relatives (parents or siblings) were reported to have the condi- tion.
We used education and household income level as indica- tors of socioeconomic status. Educational attainment was cate- gorized as follows: elementary school graduate or below, junior high school, high school graduate, and college graduate or above.
Household income was considered to include wages, pensions, unemployment benefits, social security benefits, and bank in- terest. Household income was defined as the average monthly gross income divided by an equivalence factor (number of house- hold members × 0.5) to adjust for differences in household size and composition. Income was categorized into quartiles.
Statistical analysis
We determined the prevalence and rates at which individuals were unaware of or had inadequate control over their condition by hypertension status. We compared these data between hy- pertension groups using χ2 square tests. We used survey sample weights to produce non-biased estimates for descriptive and analytical data analyses (9).
We calculated prevalence ratios (PRs) instead of odds ratios, because this study was cross-sectional, and outcomes were fre- quent (10-13). Poisson regression models with robust variance were fitted to explore factors associated with the prevalence, unawareness, and inappropriate control of hypertension. Asso- ciations with socioeconomic status are presented as PRs and 95% confidence intervals (CIs). Analyses were conducted sepa- rately for men and women and were performed using SAS ver.
9.2 (SAS Institute, Cary, NC, USA).
Ethics statement
The study protocol was approved by the Institutional Review Board of the Korea Centres for Disease Control and Prevention (No. 2010-02CON-21-C, 2011-02CON-06-C, 2012-01EXP-01- 2C, and 2013-07CON-03-4C). All subjects participated volun- tarily and provided informed consent.
RESULTS
The prevalence of hypertension was estimated at 31.2% (95%
CI, 30.2%–32.1%) among all Korean adults older than 30 years (9,178,130 individuals): 33.6% (95% CI, 32.4%–34.8%) among men and 28.9% (95% CI, 27.7%–30.1%) among women (Table 1). Of those with hypertension, 33.5% (95% CI, 31.9%–35.1%) had been unaware that they suffered from the condition (undi- agnosed rate). The undiagnosed rate was higher among men than women. Among those with diagnosed hypertension, the prevalence of inadequately controlled hypertension (uncon- trolled rate), defined as an average SBP ≥ 140 mmHg or an av- erage DBP ≥ 90 mmHg, was 33.8% (95% CI, 32.1%–35.5%).
Hypertension prevalence increased with increasing age and decreased with increasing education and income level. Hyper- tension was more prevalent among those with overweight, obe- sity or family history of hypertension. Among those aged 30–40 years, the percentage of adults ever diagnosed with hyperten- sion was lowest. Unawareness increased with higher education levels and incomes. The undiagnosed rate was more prevalent
Table 1. Prevalence and undiagnosed and inadequate control rates of hypertension in Korea, 2010–2013
Parameters
Prevalence (Estimated population = 9,178,130)
Undiagnosed rate* (Estimated population = 3,072,014)
Uncontrolled rate† (Estimated population = 2,063,088)
No. % 95% CI P % 95% CI P % 95% CI P
Overall 7,061 31.2 30.2 32.1 - 33.5 31.9 35.1 - 33.8 32.1 35.5 -
Sex Men 3,243 33.6 32.4 34.8 < 0.001 42.3 39.9 44.6 < 0.001 33.1 30.5 35.6 0.428
Women 3,818 28.9 27.7 30.1 23.9 22.1 25.7 34.4 32.2 36.6
Age, yr 30–39 330 9.4 8.3 10.4 < 0.001 77.3 72.1 82.5 < 0.001 41.5 29.4 53.6 0.073
40–49 785 20.7 19.2 22.3 56.1 52.1 60.1 38.4 32.5 44.3
50–59 1,547 36.1 34.3 37.9 34.8 31.9 37.8 35.2 31.7 38.6
60–69 2,090 54.8 52.8 56.9 20.3 18.0 22.6 31.9 29.0 34.7
≥ 70 2,309 65.4 63.4 67.3 14.7 12.8 16.5 32.0 29.5 34.5
Family history No 4,475 28.6 27.5 29.7 < 0.001 36.2 34.3 38.1 < 0.001 34.0 31.9 36.2 0.737
Yes 2,586 36.1 34.6 37.6 29.3 26.8 31.7 33.5 30.8 36.1
Waist circumfer-
ence, cm < 90 in men, < 80 in women 4,950 26.8 25.8 27.8 < 0.001 35.1 33.3 37.0 6E-04 33.3 31.3 35.4 0.432
≥ 90 in men, ≥ 80 in women 2,111 48.5 46.6 50.5 29.8 27.2 32.4 34.8 31.7 37.8
BMI, kg/cm2 < 25 3,874 24.9 23.9 26.0 < 0.001 33.9 31.8 35.9 0.582 33.9 31.6 36.1 0.692
25-29 2,756 41.7 40.1 43.3 33.4 31.0 35.8 33.3 30.7 35.8
≥ 30 431 51.7 47.3 56.1 30.8 25.3 36.3 36.1 29.7 42.4
Current smoking No 5,851 32.2 31.1 33.2 < 0.001 28.4 26.7 30.1 < 0.001 33.7 31.9 35.5 0.836
Yes 1,210 28.1 26.3 29.8 51.1 47.7 54.5 34.2 29.8 38.6
Current drinking No 3,789 32.8 31.5 34.1 2E-04 23.5 21.6 25.4 < 0.001 33.9 31.7 36.1 0.851
Yes 3,272 29.9 28.7 31.1 42.4 40.0 44.7 33.6 31.1 36.1
Educational level ≤ Elementary 3,264 54.8 53.1 56.5 < 0.001 21.3 19.4 23.3 < 0.001 32.9 30.5 35.2 0.128
Junior high 1,037 39.8 37.4 42.2 31.0 27.5 34.5 32.1 27.9 36.2
High school 1,725 25.0 23.7 26.3 41.1 38.0 44.1 34.1 30.5 37.6
≥ College 1,035 17.3 16.1 18.5 51.8 47.9 55.6 38.8 34.0 43.6
Household income level
Upper quartile 1,388 24.7 23.1 26.3 < 0.001 39.9 36.5 43.4 < 0.001 35.6 31.8 39.4 0.682
Second quartile 1,528 26.9 25.4 28.4 40.9 37.9 43.9 33.7 30.2 37.2
Third quartile 1,865 30.5 28.9 32.2 33.5 30.7 36.3 33.9 30.8 37.0
Lower quartile 2,280 49.1 47.2 51.0 21.8 19.4 24.3 32.7 29.8 35.7
CI = confidence interval, BMI = body mass index.
*Among subjects with hypertension; †Among subjects with diagnosed hypertension.
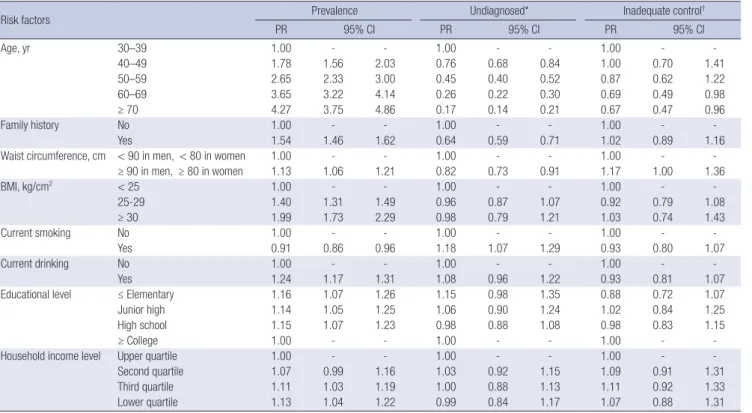
Table 2. Factors associated with prevalence and undiagnosed and inadequate control rates of hypertension in Korean men, 2010–2013
Risk factors Prevalence Undiagnosed* Inadequate control†
PR 95% CI PR 95% CI PR 95% CI
Age, yr 30–39 1.00 - - 1.00 - - 1.00 - -
40–49 1.78 1.56 2.03 0.76 0.68 0.84 1.00 0.70 1.41
50–59 2.65 2.33 3.00 0.45 0.40 0.52 0.87 0.62 1.22
60–69 3.65 3.22 4.14 0.26 0.22 0.30 0.69 0.49 0.98
≥ 70 4.27 3.75 4.86 0.17 0.14 0.21 0.67 0.47 0.96
Family history No 1.00 - - 1.00 - - 1.00 - -
Yes 1.54 1.46 1.62 0.64 0.59 0.71 1.02 0.89 1.16
Waist circumference, cm < 90 in men, < 80 in women 1.00 - - 1.00 - - 1.00 - -
≥ 90 in men, ≥ 80 in women 1.13 1.06 1.21 0.82 0.73 0.91 1.17 1.00 1.36
BMI, kg/cm2 < 25 1.00 - - 1.00 - - 1.00 - -
25-29 1.40 1.31 1.49 0.96 0.87 1.07 0.92 0.79 1.08
≥ 30 1.99 1.73 2.29 0.98 0.79 1.21 1.03 0.74 1.43
Current smoking No 1.00 - - 1.00 - - 1.00 - -
Yes 0.91 0.86 0.96 1.18 1.07 1.29 0.93 0.80 1.07
Current drinking No 1.00 - - 1.00 - - 1.00 - -
Yes 1.24 1.17 1.31 1.08 0.96 1.22 0.93 0.81 1.07
Educational level ≤ Elementary 1.16 1.07 1.26 1.15 0.98 1.35 0.88 0.72 1.07
Junior high 1.14 1.05 1.25 1.06 0.90 1.24 1.02 0.84 1.25
High school 1.15 1.07 1.23 0.98 0.88 1.08 0.98 0.83 1.15
≥ College 1.00 - - 1.00 - - 1.00 - -
Household income level Upper quartile 1.00 - - 1.00 - - 1.00 - -
Second quartile 1.07 0.99 1.16 1.03 0.92 1.15 1.09 0.91 1.31
Third quartile 1.11 1.03 1.19 1.00 0.88 1.13 1.11 0.92 1.33
Lower quartile 1.13 1.04 1.22 0.99 0.84 1.17 1.07 0.88 1.31
PR = prevalence ratio, CI = confidence interval, BMI = body mass index.
*Among subjects with hypertension; †Among subjects with diagnosed hypertension.
among subjects without a family history and among current smokers and drinkers. The diagnosed rate was significantly high- er among those with central obesity.
Results of the robust Poisson model showed the significant predictors of hypertension were older age, family history, and abdominal obesity among both men and women (Tables 2 and 3). There were socioeconomic inequalities in the prevalence of hypertension, with the highest prevalence in the lowest socio- economic level among both men and women. The PR for men with an elementary school education level or less was 1.16, and the corresponding value for women was 1.86, indicating greater magnitude compared with men.
Age and family history were protective factors with regard to unawareness. Abdominal obesity was reversely associated with undiagnosed hypertension among both men and women. Cur- rent smoking was a risk factor for undiagnosed hypertension among men. We observed an inverse association between edu- cation level and undiagnosed hypertension among women, but not men. Socioeconomic level was not associated with inade- quate control of hypertension among men or women.
DISCUSSION
The prevalence of hypertension was 31.2% in all adults older than 30 years. Projections based on sample weighting suggest that this may represent up to 9,178,130 individuals nationwide.
Undiagnosed and uncontrolled rates were 33.5% and 33.8%, re- spectively. Despite men having higher rates of hypertension, men had lower awareness rates, consistent with a large body of research on sex and health-seeking behaviour (3). Control rates were similar between men and women. We found inverse as- sociations between educational and household income levels and prevalence of hypertension among both men and women.
Education level was inversely associated with undiagnosed hy- pertension among women, but not men. Income was not asso- ciated with diagnosis or control rates (8). Socioeconomic level was not associated with inadequate control of hypertension among men or women. The results of this study provide a reli- able and meaningful snapshot of the current situation regard- ing levels of awareness and management of hypertension among Korean adults.
In 2009–2010, the prevalence of hypertension was 30.5% among men and 28.5% among women in the US: unawareness rates were 30.3% among men and 19.3% among women, and inap- propriate control rates were 59.7% among men and 43.7% among women (14). A study conducted in England reported that in 2011, 30% of all adults aged 16 years or older had hypertension, and among these, the control rate was 37% (15). Another study reported that the prevalence of hypertension is 29% in the US, 19.5% in Canada (16), and 30% in England; that hypertension unawareness rates are 19% in the US, 17% in Canada, and 35%
in England; and that uncontrolled rates are 47% in the US, 34% in Table 3. Factors associated with prevalence and undiagnosed and inadequate control rates of hypertension in Korean women, 2010–2013
Risk factors Prevalence Undiagnosed* Inadequate control†
PR 95% CI PR 95% CI PR 95% CI
Age, yr 30–39 1.00 - - 1.00 - - 1.00 - -
40–49 3.73 2.91 4.79 0.86 0.68 1.07 0.78 0.47 1.29
50–59 7.86 6.17 10.01 0.54 0.42 0.68 0.84 0.52 1.35
60–69 11.92 9.35 15.20 0.33 0.25 0.42 0.82 0.51 1.33
≥ 70 15.57 12.20 19.87 0.23 0.18 0.31 0.86 0.53 1.39
Family history No 1.00 - - 1.00 - - 1.00 - -
Yes 1.54 1.47 1.61 0.50 0.44 0.57 0.99 0.89 1.11
Waist circumference, cm < 90 in men, < 80 in women 1.00 - - 1.00 - - 1.00 - -
≥ 90 in men, ≥ 80 in women 1.05 0.99 1.11 0.73 0.60 0.89 1.10 0.95 1.27
BMI, kg/cm2 < 25 1.00 - - 1.00 - - 1.00 - -
25-29 1.32 1.25 1.39 0.80 0.70 0.92 0.88 0.78 0.99
≥ 30 1.72 1.57 1.89 0.70 0.52 0.95 0.87 0.69 1.09
Current smoking No 1.00 - - 1.00 - - 1.00 - -
Yes 1.05 0.93 1.18 1.08 0.84 1.38 0.86 0.64 1.15
Current drinking No 1.00 - - 1.00 - - 1.00 - -
Yes 0.97 0.92 1.03 1.14 1.01 1.29 0.98 0.87 1.11
Educational level ≤ Elementary 1.86 1.62 2.14 0.77 0.61 0.95 0.86 0.66 1.12
Junior high 1.69 1.46 1.96 0.80 0.63 1.00 0.91 0.69 1.20
High school 1.43 1.25 1.64 0.81 0.67 0.98 0.90 0.69 1.18
≥ College 1.00 - - 1.00 - - 1.00 - -
Household income level Upper quartile 1.00 - - 1.00 - - 1.00 - -
Second quartile 1.11 1.02 1.20 0.89 0.76 1.06 1.00 0.83 1.20
Third quartile 1.12 1.03 1.20 0.91 0.77 1.08 1.11 0.93 1.31
Lower quartile 1.10 1.02 1.19 0.87 0.73 1.05 1.17 0.98 1.38
PR = prevalence ratio, CI = confidence interval, BMI = body mass index.
*Among subjects with hypertension; †Among subjects with diagnosed hypertension.
Canada, and 73% in England (17). Despite differences between the present study and previous studies in terms of survey meth- ods and analytic strategies, our results suggest that Korea has relatively lower rates of uncontrolled hypertension than do oth- er developed countries. Korea had higher levels of unawareness than US and Canada, suggesting the nationwide demand for early diagnosis of high blood pressure in Korea. This difference might be associated with socioeconomic status, health behav- iors, and accessibility to health care services. As with other chro- nic diseases, weaknesses in health care systems probably con- tribute to the inadequate awareness of hypertension (18). Fac- tors relating to health systems are the presence of a usual source of care or health insurance. Interaction, information, emotional support, and social network resources may affect the risk of un- diagnosed hypertension (19).
A previous study using the Korean National and Nutrition Survey 2001 reported a 22.9% prevalence rate for hypertension;
rates of undiagnosed and uncontrolled hypertension were 69.8%
and 89.3%, respectively (20). Therefore, the prevalence of hy- pertension appears to have increased, while rates of unaware- ness and uncontrolled hypertension have generally decreased over time. This change suggests that the overall management of hypertension has improved (21). Although considerable advanc- es have been made in secondary prevention efforts, these low rates of diagnosis and control reflect many lost opportunities for reducing the growing burden of hypertension. Hypertension is strongly connected to modifiable risk factors that can be al- tered by making certain lifestyle changes. Public health systems should offer expanded primary prevention services based on a comprehensive approach incorporating several interrelated risks to health, including alcohol and tobacco use, central obe- sity, high BMI, physical inactivity, and inadequate consumption of fruits and vegetables (17,22,23).
According to our robust Poisson model, age, obesity, family history, income, and education level were predictors of preva- lence among both men and women (24). The prevalence of hy- pertension rose with increasing age, so lifestyle changes in young individuals should be further supported (23-25).
Age and family history were protective factors against unaware- ness, and these findings are consistent with previous reports (14,26). The protective effect of age may be attributed to increas- ed screening due to age and/or the presence of other risk fac- tors. Another plausible explanation is that elderly people are more worried about their health, particularly cardiovascular complications, compared with younger people, who generally enjoy good apparent health and are less concerned about car- diovascular problems (6). Therefore, national public healthcare policies need to stress early screening and education to reduce the increasing burden of hypertension among younger popula- tions with undiagnosed hypertension (16,21,27).
A family history of health problems increased awareness of
hypertension. Having a family member with a health problem increases awareness about possible health complications among the entire family (1,6). Additionally, obese individuals are more likely to be aware of their hypertension than slimmer individu- als, probably because they are in regular contact with primary health care providers to seek medical and dietary advice. These consultations are likely to increase their awareness of the under- lying silent metabolic pathologies associated with excess body weight (6).
Advancing age is generally associated with a decline in hy- pertension control, especially in terms of the percentage of treat- ed adults who are controlled. The declining control of hyperten- sion with age among older adults likely reflects progressive in- creases in vascular stiffness (26). However, we found that the uncontrolled rate decreased with age among men with diag- nosed hypertension. This likely reflects changes in provider and patient perceptions of complications, leading to more intensive pharmacotherapy, especially among older adults (26).
Inequalities in socioeconomic status were related to the prev- alence of hypertension among both men and women. Low so- cioeconomic status may influence nutritional habits, physical inactivity, and other unhealthy behaviours that could affect the clustering of metabolic disorders (28). Targeting people of low- er socioeconomic status may help to reduce socioeconomic in- equalities in hypertension. Educational differences were asso- ciated with greater effects on the prevalence of hypertension among women than men. The difference can be explained by inequalities in health behaviours, because disadvantaged so- cioeconomic populations tend to be associated with a higher prevalence of obesity, less physical activity, and higher psycho- social risks, and these inequalities are observed more among women than men (29-31).
Some research suggests that socioeconomically disadvan- taged individuals are less likely to receive appropriate preven- tive care, and that universal health coverage may not be suffi- cient to reduce inequalities in preventive care. Many studies have shown that populations with less education and less in- come also have less access to health services and receive less intensive preventive care (7). However, we found no associa- tions between household income level and awareness or con- trol rates in the context of Korea’s universal health insurance system, and educational levels were associated with diagnoses only among women. This is an encouraging finding, especially given the large socioeconomic inequalities characterizing many health outcomes (32), and it may suggest that optimal manage- ment does not differ according to socioeconomic status. Once a relatively high standard of access to care at the health system level is achieved, individual socioeconomic characteristics such as education or income are less likely to play an important role compared with when overall access remains poor (33). Since 1989, Korea’s national health insurance has improved access to
medical care. The Korean government provides universal med- ical check-ups every 2 years for anyone older than 40 years. Nei- ther income nor education has a statistically significant associa- tion with the likelihood that a patient with diabetes will receive medical treatment (33), and secondary prevention of diabetes is not affected by educational level (28).
The positive association between education and awareness appears to be a more consistent finding in women. Health-re- lated behaviors such as being screened by a healthcare profes- sional, seeking advice, and attending educational sessions change with gender (19). Lower socioeconomic status and less educa- tion appear to be associated with less knowledge of risk factors of stroke in both sexes but in general women seem to have bet- ter knowledge of warning signs than men. Also, men more fre- quently mentioned stress, physical activity and smoking as risk factors of stroke, while women more often reported diabetes and hypertension, which may also be attributed to the more frequent medical visits of women (34).
Chronic diseases have been proposed as good tracer condi- tions that can help identify weaknesses in a national healthcare system (23,33,35). Our findings contribute to a body of evidence that suggests that hypertension monitoring strategies should focus on prevalence and incidence trends as a function of so- cial position. There is a need for governments and practitioners to work actively to continuously monitor and address dispari- ties, and to be accountable for reducing gaps in the preventive and care services.
Several limitations of this study should be considered. First, the study was cross-sectional, so the evidence from this study is usually open to reverse causality bias. With regard to the associ- ation between hypertension and income level, it is possible that having a disease and suffering from its complications could lead to less affluence, rather than vice versa. However, education is less susceptible to reverse causation because most people have completed their schooling by the time they succumb to chronic diseases in adulthood (23,36).
Second, our blood pressure levels were based on the average of 2 measurements at a single visit only; a standard clinical hy- pertension diagnosis requires 2 or more visits. Thus, hyperten- sion status may have been incorrectly assigned to some indi- viduals. Misclassification may be because of self-reported in- formation, especially information on the use of antihyperten- sive medication. Nevertheless, this method has been supported as a way to establish the population-level prevalence of hyper- tension (8,26). Results from other countries or races are needed for the broadest interpretation and generalization of this study.
Despite these concerns, this study suggests strengthening the screening for hypertension in primary health-care settings in the high risk groups and frequent health promotion to the com- munity to enhance individual awareness and commitment of healthy living would be of immense value (37). Another major
strength of this study is its use of population-based data, which reduced the likelihood of selection bias.
The chronic care model aims to transform the system of chro- nic disease care delivery from acute and reactive to proactive, planned, and population-based (38). Identifying missed oppor- tunities for reducing illness and death from common chronic diseases could reduce long-term medical, social, and economic burdens. Monitoring is expected to reveal gaps in the preven- tive and care services offered to the most vulnerable individuals and may encourage governments and practitioners to address these gaps (23).
DISCLOSURE
The author has no potential conflicts of interest to disclose.
AUTHOR CONTRIBUTION
Conceptualization: Lee HY. Investigation: Lee HY. Writing - orig- inal draft: Lee HY.
ORCID
Hoo-Yeon Lee http://orcid.org/0000-0002-8426-2045
REFERENCES
1. Wu Y, Tai ES, Heng D, Tan CE, Low LP, Lee J. Risk factors associated with hypertension awareness, treatment, and control in a multi-ethnic Asian population. J Hypertens 2009; 27: 190-7.
2. Ikeda N, Sapienza D, Guerrero R, Aekplakorn W, Naghavi M, Mokdad AH, Lozano R, Murray CJ, Lim SS. Control of hypertension with medication: a comparative analysis of national surveys in 20 countries. Bull World Health Organ 2014; 92: 10-19C.
3. Chow CK, Teo KK, Rangarajan S, Islam S, Gupta R, Avezum A, Bahonar A, Chifamba J, Dagenais G, Diaz R, et al. Prevalence, awareness, treatment, and control of hypertension in rural and urban communities in high-, mid- dle-, and low-income countries. JAMA 2013; 310: 959-68.
4. Wolf-Maier K, Cooper RS, Kramer H, Banegas JR, Giampaoli S, Joffres MR, Poulter N, Primatesta P, Stegmayr B, Thamm M. Hypertension treatment and control in five European countries, Canada, and the United States.
Hypertension 2004; 43: 10-7.
5. Damasceno A, Azevedo A, Silva-Matos C, Prista A, Diogo D, Lunet N. Hy- pertension prevalence, awareness, treatment, and control in mozambique:
urban/rural gap during epidemiological transition. Hypertension 2009;
54: 77-83.
6. Alkerwi A, Pagny S, Lair ML, Delagardelle C, Beissel J. Level of unaware- ness and management of diabetes, hypertension, and dyslipidemia among adults in Luxembourg: findings from ORISCAV-LUX Study. PLoS One 2013; 8: e57920.
7. Munoz MA, Rohlfs I, Masuet S, Rebato C, Cabañero M, Marrugat J; ICAR Study Group. Analysis of inequalities in secondary prevention of coro- nary heart disease in a universal coverage health care system. Eur J Pub-
lic Health 2006; 16: 361-7.
8. Yoon SS, Gu Q, Nwankwo T, Wright JD, Hong Y, Burt V. Trends in blood pressure among adults with hypertension: United States, 2003 to 2012.
Hypertension 2015; 65: 54-61.
9. Ministry of Health and Welfare, Korea Centers for Disease Control and Prevention. Korea Health Statistics 2012: Korea National Health and Nu- trition Examination Survey (KNHANES V-3). Cheongwon, Korea Centers for Disease Control and Prevention, 2013.
10. Espelt A, Kunst AE, Palència L, Gnavi R, Borrell C. Twenty years of socio- economic inequalities in type 2 diabetes mellitus prevalence in Spain, 1987–2006. Eur J Public Health 2012; 22: 765-71.
11. Deddens JA, Petersen MR. Approaches for estimating prevalence ratios.
Occup Environ Med 2008; 65: 501-6.
12. Barros AJ, Hirakata VN. Alternatives for logistic regression in cross-sec- tional studies: an empirical comparison of models that directly estimate the prevalence ratio. BMC Med Res Methodol 2003; 3: 21.
13. Spiegelman D, Hertzmark E. Easy SAS calculations for risk or prevalence ratios and differences. Am J Epidemiol 2005; 162: 199-200.
14. Guo F, He D, Zhang W, Walton RG. Trends in prevalence, awareness, man- agement, and control of hypertension among United States adults, 1999 to 2010. J Am Coll Cardiol 2012; 60: 599-606.
15. Falaschetti E, Mindell J, Knott C, Poulter N. Hypertension management in England: a serial cross-sectional study from 1994 to 2011. Lancet 2014;
383: 1912-9.
16. Lee Yh, Lee SG, Lee MH, Kim JH, Lee BW, Kang ES, Lee HC, Cha BS. Se- rum cholesterol concentration and prevalence, awareness, treatment, and control of high low-density lipoprotein cholesterol in the Korea National Health and Nutrition Examination Surveys 2008–2010: beyond the tip of the iceberg. J Am Heart Assoc 2014; 3: e000650.
17. Danaei G, Finucane MM, Lin JK, Singh GM, Paciorek CJ, Cowan MJ, Far- zadfar F, Stevens GA, Lim SS, Riley LM, et al. National, regional, and glob- al trends in systolic blood pressure since 1980: systematic analysis of health examination surveys and epidemiological studies with 786 country-years and 5·4 million participants. Lancet 2011; 377: 568-77.
18. Maimaris W, Paty J, Perel P, Legido-Quigley H, Balabanova D, Nieuwlaat R, McKee M. The influence of health systems on hypertension awareness, treatment, and control: a systematic literature review. PLoS Med 2013;
10: e1001490.
19. Chu SH, Baek JW, Kim ES, Stefani KM, Lee WJ, Park YR, Youm Y, Kim HC.
Gender differences in hypertension control among older Korean adults:
Korean social life, health, and aging project. J Prev Med Public Health 2015;
48: 38-47.
20. Choi KM, Park HS, Han JH, Lee JS, Lee J, Ryu OH, Lee KW, Cho KH, Yoon D, Baik SH, et al. Prevalence of prehypertension and hypertension in a Korean population: Korean National Health and Nutrition Survey 2001. J Hypertens 2006; 24: 1515-21.
21. Shin J, Park JB, Kim KI, Kim JH, Yang DH, Pyun WB, Kim YG, Kim GH, Chae SC; Guideline Committee of the Korean Society of Hypertension. 2013 Korean Society of Hypertension guidelines for the management of hy- pertension: part I–epidemiology and diagnosis of hypertension. Clin Hy- pertens 2015; 21: 1.
22. Kearney PM, Whelton M, Reynolds K, Muntner P, Whelton PK, He J. Glob- al burden of hypertension: analysis of worldwide data. Lancet 2005; 365:
217-23.
23. Lee HY, Hahm MI, Choi KS, Jun JK, Suh M, Nam CM, Park EC. Different
socioeconomic inequalities exist in terms of the prevention, diagnosis and control of diabetes. Eur J Public Health 2015; 25: 961-5.
24. Estoppey D, Paccaud F, Vollenweider P, Marques-Vidal P. Trends in self- reported prevalence and management of hypertension, hypercholester- olemia and diabetes in Swiss adults, 1997–2007. BMC Public Health 2011;
11: 114.
25. Cheung BM, Cheung TT. Challenges in the management of hypertension in Asia. Eur Heart J Suppl 2012; 14: A37-8.
26. Wozniak G, Khan T, Gillespie C, Sifuentes L, Hasan O, Ritchey M, Kmetik K, Wynia M. Hypertension control cascade: a framework to improve hy- pertension awareness, treatment, and control. J Clin Hypertens (Green- wich) 2016; 18: 232-9.
27. Moon JY, Park KJ, Hwangbo Y, Lee MR, Yoo BI, Won JH, Park YH. A trend analysis of the prevalence, awareness, treatment, and control of hyper- tension by age group. J Prev Med Public Health 2013; 46: 353-9.
28. Agyemang C, van Valkengoed I, Hosper K, Nicolaou M, van den Born BJ, Stronks K. Educational inequalities in metabolic syndrome vary by eth- nic group: Evidence from the SUNSET study. Int J Cardiol 2010; 141: 266- 74.
29. Vernay M, Salanave B, de Peretti C, Druet C, Malon A, Deschamps V, Her- cberg S, Castetbon K. Metabolic syndrome and socioeconomic status in France: the French nutrition and health survey (ENNS, 2006–2007). Int J Public Health 2013; 58: 855-64.
30. Agardh E, Allebeck P, Hallqvist J, Moradi T, Sidorchuk A. Type 2 diabetes incidence and socio-economic position: a systematic review and meta- analysis. Int J Epidemiol 2011; 40: 804-18.
31. Espelt A, Borrell C, Roskam AJ, Rodríguez-Sanz M, Stirbu I, Dalmau-Bue- no A, Regidor E, Bopp M, Martikainen P, Leinsalu M, et al. Socioeconom- ic inequalities in diabetes mellitus across Europe at the beginning of the 21st century. Diabetologia 2008; 51: 1971-9.
32. Gakidou E, Mallinger L, Abbott-Klafter J, Guerrero R, Villalpando S, Rid- aura RL, Aekplakorn W, Naghavi M, Lim S, Lozano R, et al. Management of diabetes and associated cardiovascular risk factors in seven countries:
a comparison of data from national health examination surveys. Bull World Health Organ 2011; 89: 172-83.
33. Do YK, Eggleston KN. Educational disparities in quality of diabetes care in a universal health insurance system: evidence from the 2005 Korea Na- tional Health and Nutrition Examination Survey. Int J Qual Health Care 2011; 23: 397-404.
34. Kautzky-Willer A, Dorner T, Jensby A, Rieder A. Women show a closer as- sociation between educational level and hypertension or diabetes melli- tus than males: a secondary analysis from the Austrian HIS. BMC Public Health 2012; 12: 392.
35. Nolte E, Bain C, McKee M. Diabetes as a tracer condition in international benchmarking of health systems. Diabetes Care 2006; 29: 1007-11.
36. Dasgupta K, Khan S, Ross NA. Type 2 diabetes in Canada: concentration of risk among most disadvantaged men but inverse social gradient across groups in women. Diabet Med 2010; 27: 522-31.
37. Naing C, Yeoh PN, Wai VN, Win NN, Kuan LP, Aung K. Hypertension in Malaysia: an analysis of trends from the National Surveys 1996 to 2011.
Medicine (Baltimore) 2016; 95: e2417.
38. Cramm JM, Nieboer AP. Short and long term improvements in quality of chronic care delivery predict program sustainability. Soc Sci Med 2013;
101: 148-54.