ABSTRACT
Background: The aim of this study was to assess the prognostic value of massive transfusion (MT), critical administration threshold (CAT), and resuscitation intensity (RI) for the mortality of trauma patients with severe hemorrhage.
Methods: Seventeen relevant articles were obtained by searching the PubMed databases through February 15, 2019. The estimated mortality rates and injury severity scores were obtained through a meta-analysis. In addition, diagnostic test accuracy (DTA) reviews were conducted to obtain the sensitivity, specificity, diagnostic odds ratio, and the summary receiver operating characteristic curve.
Results: At 24 hours, the estimated mortality rates were 0.194, 0.126, and 0.168 in assessments using MT, CAT, and RI, respectively. In addition, the pooled sensitivity of CAT (0.89; 95%
confidence interval [CI], 0.82–0.94) was significantly higher than that of MT (0.63; 95% CI, 0.57–0.68) and RI (0.69; 95% CI, 0.63–0.75). Overall, the pooled specificity of MT and CAT was 0.82 (95% CI, 0.80–0.83) and 0.85 (95% CI, 0.83–0.88), respectively, while the pooled sensitivity was 0.49 (95% CI, 0.44–0.54) and 0.50 (95% CI, 0.38–0.62), respectively.
Conclusion: CAT may be a more sensitive predictor for 24-hour mortality than other predictors. Furthermore, RI also appears to be a useful predictor for 24-hour mortality. Both MT and CAT showed high specificity for overall mortality.
Keywords: Trauma; Massive Transfusion; Hemorrhage; Injuries; Mortality
Original Article
Wu Seong Kang ,1 In Soo Shin ,2 Jung-Soo Pyo ,3 Sora Ahn ,1
Seungwoo Chung ,1 Young Jun Ki ,1 Junepill Seok ,1 Chan Yong Park ,1 and Sungdo Lee 4
1Department of Trauma Surgery, Wonkwang University Hospital, Iksan, Korea
2College of Education, Jeonju University, Jeonju, Korea
3Department of Pathology, Eulji University Hospital, Eulji University School of Medicine, Daejeon, Korea
4Trauma Center, Wonkwang University Hospital, Iksan, Korea
Prognostic Accuracy of Massive
Transfusion, Critical Administration Threshold, and Resuscitation Intensity in Assessing Mortality in Traumatic Patients with Severe Hemorrhage:
a Meta-Analysis
Received: Sep 29, 2019 Accepted: Nov 1, 2019 Address for Correspondence:
Jung-Soo Pyo, MD, PhD
Department of Pathology, Eulji University Hospital, Eulji University School of Medicine, 95 Dunsanseo-ro, Seo-gu, Daejeon 35233, Republic of Korea.
E-mail: [email protected] Chan Yong Park, MD, PhD
Department of Trauma Surgery, Wonkwang University Hospital, 895 Muwang-ro, Iksan 54538, Republic of Korea.
E-mail: [email protected]
© 2019 The Korean Academy of Medical Sciences.
This is an Open Access article distributed under the terms of the Creative Commons Attribution Non-Commercial License (https://
creativecommons.org/licenses/by-nc/4.0/) which permits unrestricted non-commercial use, distribution, and reproduction in any medium, provided the original work is properly cited.
ORCID iDs Wu Seong Kang
https://orcid.org/0000-0003-0136-4458 In Soo Shin
https://orcid.org/0000-0001-7535-3511 Jung-Soo Pyo
https://orcid.org/0000-0003-0320-8088 Sora Ahn
https://orcid.org/0000-0003-2572-0349 Seungwoo Chung
https://orcid.org/0000-0003-3774-6933 Young Jun Ki
https://orcid.org/0000-0002-6169-9957
Emergency &
Critical Care Medicine
Junepill Seok
https://orcid.org/0000-0002-9010-6495 Chan Yong Park
https://orcid.org/0000-0002-5111-3270 Sungdo Lee
https://orcid.org/0000-0002-8945-7255 Disclosure
The authors have no potential conflicts of interest to disclose.
Authors Contributions
Conceptualization: Kang WS, Pyo JS, Park CY. Data curation: Kang WS, Pyo JS. Formal analysis: Kang WS, Pyo JS. Writing - original draft: Kang WS, Pyo JS, Park CY. Writing - review & editing: Kang WS, Pyo JS, Shin IS, Ahn S, Ki YJ, Chung S, Lee S, Seok J.
INTRODUCTION
Recently, although advanced trauma care such as damage control surgery and resuscitation have been developed, uncontrolled bleeding remains the most common cause of preventable death among severe trauma patients.1,2 The core concept of damage control resuscitation (DCR) consists of a 1:1:1 blood component transfusion ratio as well as early recognition of hemorrhage with early hemostasis.2 However, even a well-experienced trauma surgeon's gestalt is not enough to recognize any underlying severe hemorrhage.3 Thus, early
recognition of the need for transfusion in severe traumatic patients has been a challenge for trauma surgeons, and it is a crucial sign that implies a major catastrophe.
The traditional definition of massive transfusion (MT) is a patient who receives 10 or more units of packed red blood cells (PRBC) within the first 24 hours.4 However, the conventional definition of MT is an arbitrary and insufficient measurement for predicting mortality with substantial survival bias.4 Many patients die within 24 hours, and they are excluded by the traditional MT definition. Therefore, survival bias can arise in these cases, and the estimated risk can be biased (usually underestimated).5 In addition, it is necessary to assess the risk for mortality within first 24 hours. As a result, some investigators argued that a modified definition of MT should be as follows: patients receiving 5 or more units of PRBC in 4 hours6 and 10 or more units of PRBC in 6 hours.7 Instead, Savage et al.8 proposed an alternative definition of significant blood transfusion requirement. It focused on the concept of critical administration threshold (CAT), which is defined as any patients receiving 3 or more units of PRBC within the first hour. Another alternative metric, which was introduced by Rahbar et al.,9 is the resuscitation intensity (RI), defined as the sum of each unit of resuscitation product, including each unit of blood product (PRBC, plasma, or platelets), every 500 mL of colloid solution, and every 1,000 mL of crystalloid solution administrated within the first 30 minutes. Previous studies demonstrated that both CAT and RI performed better than MT in terms of predicting risks for early mortality.10
The aim of this study was to assess the value of MT, CAT, and RI as predictors of the mortality of trauma patients with severe hemorrhage. In a meta-analysis, the estimated mortality rates of trauma patients and injury severity scores (ISS) were analyzed through division into evaluating predictors. In addition, diagnostic test accuracy (DTA) reviews were conducted to compare the prognostic values of various predictors.
METHODS
Published study search and selection criteria
This study was performed in accordance with the Preferred Reporting Items for Systematic Reviews and Meta-Analysis (PRISMA) statement.11 Relevant articles were obtained by searching the PubMed databases through February 15, 2019. This database was searched using the following keywords: “(trauma) AND (hemorrhage) AND (transfusion) AND (mortality)” and “(trauma) AND (critical administration threshold) AND (transfusion) AND (mortality).” In addition, we searched the reference lists of relevant articles manually. The titles and abstracts of all searched articles were screened for exclusion. Review articles and previous meta-analyses were also screened to obtain additional eligible studies. Search results were then reviewed, and articles were included if the study investigated the trauma patients and provided information on the mortality of patients with MT. Those articles that were case reports, non-original articles, or non-English language publications were excluded.
Data extraction
Data from all eligible studies were extracted by two individual authors. Extracted data from each of the eligible studies included the following3,6,9,10,12-24: first author's name; year of publication; study location; study design; study period; number of patients analyzed; and patients' ages, ISS, and mortality with and without MT. In addition, the number of true positives, false positives, false negatives, and true negatives for each MT (≥ 10 pRBC/24 hours), CAT (≥ 3 pRBC/1 hour), and RI (≥ 4 units) were investigated to obtain the sensitivity, specificity, diagnostic odds ratio (OR), and summary receiver operating characteristic (SROC) curve.
Quality assessment
All studies were independently reviewed by two investigators. Any disagreement concerning the study selection and data extraction were resolved by consensus. As recommended by the Cochrane Collaboration, Prediction model Risk Of Bias ASsessment Tool (PROBAST) was used to assess the risk of bias and applicability of diagnostic and prognostic prediction model studies.25 The disagreement was resolved by discussion with the participation of the third independent author.
Statistical analysis
To obtain the estimated mortality rates of traumatic patients with MT, a meta-analysis was performed using the Comprehensive Meta-Analysis software package (Biostat, Englewood, NJ, USA). The mortality was investigated from eligible studies. Because the eligible studies used populations with various traumas, a random-effects model was more appropriate than a fixed-effects model. Heterogeneity between the eligible studies was checked using probability statistics (P value). To evaluate publication bias, Begg's funnel plot and Egger's test were conducted. The results with P < 0.05 were considered statistically significant. If significant publication bias was found, the fail-safe N and trim-fill tests were also conducted to confirm the degree of publication bias. The results were considered statistically significant with P < 0.05.
Additionally, we performed DTA reviews of MT, CAT, and RI for predicting mortality using the Meta-DiSc program (version 1.4; Biostatistics, the Ramon y Cajal Hospital, Madrid, Spain).
We calculated the pooled sensitivity, specificity, and diagnostic ORs according to individual data collected from each eligible study in the various categories of comparison. By plotting the
“sensitivity” and “1−specificity” of each study, the SROC curve was constructed first, and the curve fitting was performed through linear regression using the Moses-Littenberg linear model.
Because each of the data was heterogeneous, the accuracy data were pooled by fitting the SROC curve and measuring the value of the area under the curve (AUC). An AUC close to 1 means the test is strong, and an AUC close to 0.5 means the test is considered poor. A subgroup analysis based on evaluation time and evaluation tool was conducted.
RESULTS
Selection and characteristics
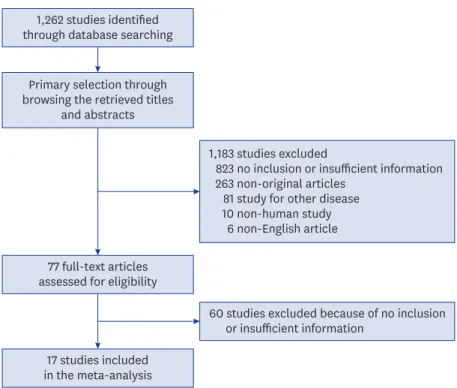
A total of 1,262 studies were searched and identified through database searching. Among the searched studies, 823 were excluded due to insufficient information. An additional 263 studies were excluded because they were non-original, 81 were excluded owing to being a study for other diseases, 10 were excluded because they were studies about non-humans,
and 6 studies were excluded because they were written in a non-English language. Finally, 17 studies comprising 17,511 patients were included in the present meta-analysis and DTA review (Fig. 1 and Table 1), and detailed information about the eligible studies is shown in Table 1.
ISS and mortality of patients with MT
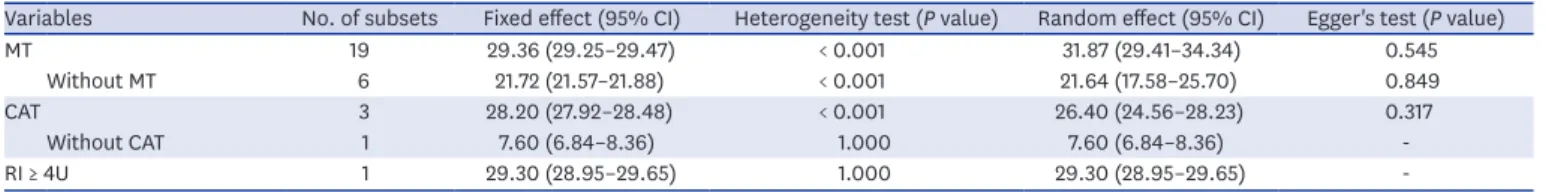
Before analyzing the mortality rate, the estimated ISS was investigated. The estimated ISS of patients with and without MT were 29.36 (95% confidence interval [CI], 29.25–29.47) and 21.72 (95% CI, 21.57–21.88), respectively. In patients with and without CAT, the estimated ISS were 28.20 (95% CI, 27.92–28.48) and 7.60 (95% CI, 6.84–8.36), respectively (Table 2).
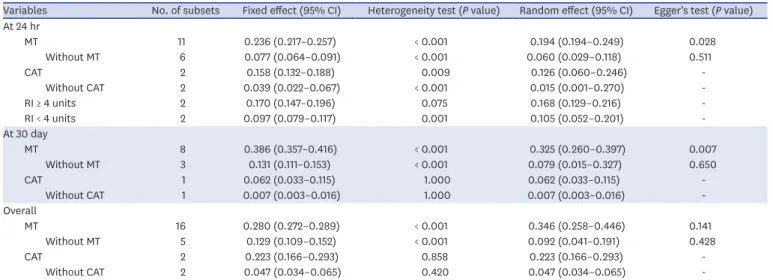
The estimated ISS of patients with RI ≥ 4U was 29.30 (95% CI, 28.95–29.65). At 24 hours, the estimated mortality rates were 0.194 (95% CI, 0.194–0.249), 0.126 (95% CI, 0.060–0.246), and 0.168 (95% CI, 0.129–0.216) in patients with MT, CAT, and RI, respectively (Table 3).
Overall, the estimated mortality rates were 0.346 (95% CI, 0.258–0.446) and 0.223 (95%
CI, 0.166–0.229) in patients with MT and CAT, respectively. The mortality rates were lower in patients without MT compared to patients with MT or CAT. To assess publication bias, Begg's funnel plot and Egger's test were preferentially conducted. In a mortality assessment of patients with MT at 24 hours and 30 days, there was significant publication bias (P = 0.028 and P = 0.007, respectively). To define the degree of publication bias, the fail-safe N and trim and fill tests were conducted as secondary assessments, and no significant publication bias was found. In assessing other subgroups, no significant publication bias emerged.
Predicting roles of MT, CAT, and RI through a DTA review
DTA review was performed to evaluate the predicting roles of MT, CAT, and RI in trauma patients (Supplementary Table 1). At 6 hours, the pooled sensitivity and specificity of RI were 0.72 (95% CI, 0.64–0.78) and 0.55 (95% CI, 0.52–0.57), respectively (Fig. 2). At 24 hours, the paired forest plot of the pooled sensitivity and specificity of MT, CAT, and RI are shown in Fig. 3. The pooled sensitivity of CAT (0.89; 95% CI, 0.82–0.94) was significantly higher than
1,262 studies identified through database searching
Primary selection through browsing the retrieved titles
and abstracts
77 full-text articles assessed for eligibility
17 studies included in the meta-analysis
1,183 studies excluded
no inclusion or insufficient information non-original articles
study for other disease non-human study non-English article 823263
1081 6
60 studies excluded because of no inclusion or insufficient information
Fig. 1. Flow diagram for identification of eligible studies.
Table 1. Main characteristics of the eligible studies
Study Location Study design Study period Assessment Subgroup No. of
patients Age, yr ISS
Mean SD Mean SD
Boutefnouchet et al.12 UK Observational,
single center 2008–2010 MT MTP 1 52 40.8 16.4 25.5 13.0
MTP 2 66 41.3 19.8 30.7 14.2
Broxton et al.13 USA Observational,
single center 2014–2015 MT MT (+) 16 42.0 17.0
MT (−) 42 44.0 21.0
Hamidi et al.14 USA Observational,
TQIP database 2013–2014 MT Level I trauma center 2,184 40.0 20.0 29.5 3.7
MT Level II trauma center 594 41.0 19.0 27.5 3.3
Huber-Wagner et al.15 Germany Observational,
German databasea 1993–2001 MT Group I (0–9 pRBC) 7,021 Group II (10–19 pRBC) 661 Group III (20–29 pRBC) 253 Group IV (≥ 30 pRBC) 148 Johansson et al.16 Denmark Observational,
single center 2010–2011 MT Non-survivors 21 63.4 8.5 32.2 3.3
Survivors 161 40.8 4.2 15.3 2.8
Maegele et al.17 Germany Observational,
German databasea 2002–2006 MT pRBC:FFP ratio > 1.1 484 41.0 19.0 41.0 16.0 pRBC:FFP ratio 0.9–1.1 114 40.0 18.0 41.0 14.0 pRBC:FFP ratio < 0.9 115 37.0 16.0 41.0 13.0
Meyer et al.10 USA RCT 2012–2013 MT With MT 301 35.3 4.5 32.5 3.3
PROPPR
(secondary analysis) CAT With CAT 521 35.3 4.2 28.3 3.8
RI ≥ 4 units 445 35.8 4.5 29.3 3.8
Moore et al.18 USA Observational,
multicenter (7 centers) 2005–2006 MT With MT 113 38.0 17.0 32.0 16.0
Without MT 267 39.0 17.0 26.0 15.0
Murry et al.19 USA Observational,
single center 2011–2013 MT Non-elderly (< 60) 52 35.0 11.0 32.0 15.8
Elderly (≥ 60) 14 73.0 12.0 28.0 10.7
Nunez et al.20 USA Observational,
single center 2005–2006 MT With MT 76 40.0 18.0 32.7 3.2
Without MT 510 48.0 24.0 22.0 4.0
Ogura et al.21 Japan Observational,
single center 2008–2009 MT With MT 62 64.0 20.7 30.1 14.4
2010–2012 Without MT 57 50.6 26.6 26.1 76.5
Ohmori et al.22 Japan Observational,
single center 2007–2015 MT With MT 74 78.0 1.7 34.0 2.8
Without MT 306 77.0 1.8 22.0 1.7
Mitra et al.6 Australia Observational,
single center 2004–2008 With MT 303 42.8 19.9 34.8 3.2
Without MT 84 43.0 19.2 29.3 3.8
Pommerening et al.3 USA Observational,
multicenter (10 centers) 2009–2010 MT With MT 221 38.0 4.7
Without MT 745 38.5 5.0
Rahbar et al.9 USA Observational,
multicenter (10 centers) 2009–2010 RI ≥ 4 units 473 37.5 4.7 27.0 3.7
PROMMTT
(secondary analysis) < 4 units 762 38.8 5.2 23.5 3.3
Stone et al.23 USA Observational,
single center 2012–2015 MT With MT 8 59.1 20.5 31.1 15.8
Without MT 59 38.8 17.0 8.2 3.0
CAT With CAT 21 46.8 19.6 20.1 5.5
Without CAT 46 38.7 17.6 7.6 2.6
Tran et al.24 Canada Observational,
single center 2014–2017 MT With MT 48 40.5 33.8 6.8
CAT With CAT 145 53.0 28.5 3.3
ISS = injury severity score, SD = standard deviation, MT = massive transfusion (≥ 10 pRBC/24 hours), CAT = critical administration threshold (≥3 pRBC/1 hour), RI = resuscitation intensity, MTP = massive transfusion protocol, pRBC = packed red blood cells, FFP = fresh frozen plasma, TQIP = the American College of Surgeons Trauma Quality Improvement Program, PROPPR = the Pragmatic, Randomized, Optimal Platelet and Plasma Ratios trial, RCT = randomized controlled trial, PROMMTT = Prospective, Observational, Multicenter, Major Trauma Transfusion study.
aThe trauma registry of the German trauma society.
Table 2. The estimated injury severity score in trauma patients: ISS
Variables No. of subsets Fixed effect (95% CI) Heterogeneity test (P value) Random effect (95% CI) Egger's test (P value)
MT 19 29.36 (29.25–29.47) < 0.001 31.87 (29.41–34.34) 0.545
Without MT 6 21.72 (21.57–21.88) < 0.001 21.64 (17.58–25.70) 0.849
CAT 3 28.20 (27.92–28.48) < 0.001 26.40 (24.56–28.23) 0.317
Without CAT 1 7.60 (6.84–8.36) 1.000 7.60 (6.84–8.36) -
RI ≥ 4U 1 29.30 (28.95–29.65) 1.000 29.30 (28.95–29.65) -
CI = confidence interval, ISS = injury severity score, MT = massive transfusion (≥ 10 pRBC/24 hours), CAT = critical administration threshold (≥3 pRBC/1 hour), RI = resuscitation intensity.
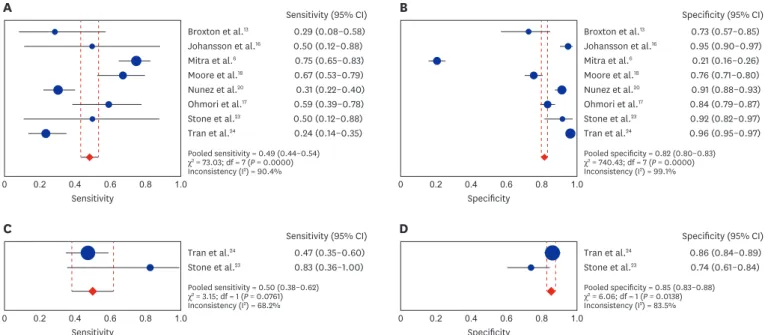
MT (0.63; 95% CI, 0.57–0.68) and RI (0.69; 95% CI, 0.63–0.75). Overall, the paired forest plot of the pooled sensitivity and specificity of MT and CAT are shown in Fig. 4. The pooled specificity of MT and CAT was 0.82 (95% CI, 0.80–0.83) and 0.85 (95% CI, 0.83–0.88), respectively, while the pooled sensitivity was 0.49 (95% CI, 0.44–0.54) and 0.50 (95% CI, 0.38–0.62), respectively. At 24 hours and overall, the AUC on SROC of MT were 0.6838 and 0.6557, respectively. At 24 hours, diagnostic ORs of MT, CAT, and RI were 3.75 (95% CI, 1.71–8.24), 9.25 (95% CI, 0.91–94.42), and 2.74 (95% CI, 2.05–3.67), respectively.
Quality assessment
The details of quality assessment are described in Supplementary Table 2. The risk of bias was unclear in seven studies (41.1%) and the concern of applicability was unclear in three studies (17.6%). The majority of the included studies were retrospective observational studies.
DISCUSSION
To the best of our knowledge, the present study is the first meta-analysis addressing the prognostic value of MT, CAT, and RI for mortality. In the present study, the DTA review suggested that CAT was the most sensitive surrogate for 24-hour mortality among the three assessments. RI appears as sensitive as MT for 24-hour mortality. Because CAT and RI are assessed within one hour, these are useful surrogates for 24-hour mortality, while MT is useless within 24 hours. Overall, the sensitivity of both MT and CAT were insufficient (0.49 Table 3. The estimated mortality rates in trauma patients
Variables No. of subsets Fixed effect (95% CI) Heterogeneity test (P value) Random effect (95% CI) Egger's test (P value) At 24 hr
MT 11 0.236 (0.217–0.257) < 0.001 0.194 (0.194–0.249) 0.028
Without MT 6 0.077 (0.064–0.091) < 0.001 0.060 (0.029–0.118) 0.511
CAT 2 0.158 (0.132–0.188) 0.009 0.126 (0.060–0.246) -
Without CAT 2 0.039 (0.022–0.067) < 0.001 0.015 (0.001–0.270) -
RI ≥ 4 units 2 0.170 (0.147–0.196) 0.075 0.168 (0.129–0.216) -
RI < 4 units 2 0.097 (0.079–0.117) 0.001 0.105 (0.052–0.201) -
At 30 day
MT 8 0.386 (0.357–0.416) < 0.001 0.325 (0.260–0.397) 0.007
Without MT 3 0.131 (0.111–0.153) < 0.001 0.079 (0.015–0.327) 0.650
CAT 1 0.062 (0.033–0.115) 1.000 0.062 (0.033–0.115) -
Without CAT 1 0.007 (0.003–0.016) 1.000 0.007 (0.003–0.016) -
Overall
MT 16 0.280 (0.272–0.289) < 0.001 0.346 (0.258–0.446) 0.141
Without MT 5 0.129 (0.109–0.152) < 0.001 0.092 (0.041–0.191) 0.428
CAT 2 0.223 (0.166–0.293) 0.858 0.223 (0.166–0.293) -
Without CAT 2 0.047 (0.034–0.065) 0.420 0.047 (0.034–0.065) -
CI = confidence interval, MT = massive transfusion (≥ 10 pRBC/24 hours), CAT = critical administration threshold (≥ 3 pRBC/1 hour), RI = resuscitation intensity.
Sensitivity (95% CI)
Sensitivity
A
Meyer et al.10 Rahbar et al.9
Pooled sensitivity = 0.72 (0.64–0.78) χ2 = 2.95; df = 1 (P = 0.0860) Inconsistency (I2) = 66.1%
0.78 (0.67–0.87) 0.67 (0.57–0.76)
0 0.2 0.4 0.6 0.8 1.0
Specificity (95% CI)
Specificity
B
Meyer et al.10 Rahbar et al.9
Pooled specificity = 0.55 (0.52–0.57) χ2 = 125.52; df = 1 (P = 0.0000) Inconsistency (I2) = 99.2%
0.36 (0.32–0.40) 0.64 (0.61–0.67)
0 0.2 0.4 0.6 0.8 1.0
Fig. 2. Paired forest plot of the sensitivity and specificity of RI > 4 unit for 6 hours mortality after admission.
RI = resuscitation intensity, CI = confidence interval.
Sensitivity (95% CI)
Sensitivity
A
Broxton et al.13 Meyer et al.10
Pooled sensitivity = 0.63 (0.57–0.68) χ2 = 16.15; df = 7 (P = 0.0238) Inconsistency (I2) = 56.6%
0.29 (0.04–0.71) 0.63 (0.53–0.72) Mitra et al.6
Moore et al.18
0.74 (0.61–0.84) 0.77 (0.60–0.90) Murry et al.19 (elderly)
Murry et al.19 (non-elderly)
0.29 (0.04–0.71) 0.64 (0.44–0.81) Pommerening et al.3
Tran et al.24
0.55 (0.45–0.65) 0.64 (0.35–0.87)
Meyer et al.10 0.59 (0.55–0.63) Mitra et al.6
Moore et al.18
0.21 (0.17–0.26) 0.75 (0.70–0.80) Murry et al.19 (elderly)
Murry et al.19 (non-elderly)
0.86 (0.42–1.00) 0.63 (0.41–0.81) Pommerening et al.3
Tran et al.24
0.81 (0.78–0.84) 0.96 (0.94–0.97)
0 0.2 0.4 0.6 0.8 1.0
Specificity (95% CI)
Specificity
B
Broxton et al.13
Pooled specificity = 0.74 (0.72–0.75) χ2 = 779.33; df = 7 (P = 0.0000) Inconsistency (I2) = 99.1%
0.73 (0.58–0.84)
0 0.2 0.4 0.6 0.8 1.0
Sensitivity (95% CI)
Sensitivity
C
Meyer et al.10 Tran et al.24
Pooled sensitivity = 0.89 (0.82–0.94) χ2 = 0.22; df = 1 (P = 0.6381) Inconsistency (I2) = 0.0%
0.90 (0.82–0.95) 0.86 (0.57–0.98)
0 0.2 0.4 0.6 0.8 1.0
Specificity (95% CI)
Specificity
D
Meyer et al.10 Tran et al.24
Pooled specificity = 0.61 (0.59–0.64) χ2 = 536.85; df = 1 (P = 0.0000) Inconsistency (I2) = 99.8%
0.26 (0.22–0.29) 0.85 (0.82–0.87)
0 0.2 0.4 0.6 0.8 1.0
Sensitivity (95% CI)
Sensitivity
E
Meyer et al.10 Rahbar et al.9
Pooled sensitivity = 0.69 (0.63–0.75) χ2 = 10.13; df = 1 (P = 0.0015) Inconsistency (I2) = 90.1%
0.80 (0.71–0.87) 0.61 (0.53–0.69)
0 0.2 0.4 0.6 0.8 1.0
Specificity (95% CI)
Specificity
F
Meyer et al.10 Rahbar et al.9
Pooled specificity = 0.55 (0.53–0.58) χ2 = 111.46; df = 1 (P = 0.0000) Inconsistency (I2) = 99.1%
0.38 (0.34–0.42) 0.65 (0.62–0.68)
0 0.2 0.4 0.6 0.8 1.0
Fig. 3. Paired forest plot of the sensitivity and specificity of (A, B) MT, (C, D) CAT, and (E, F) RI for 24 hours mortality after admission.
MT = massive transfusion, CAT = critical administration threshold, RI = resuscitation intensity, CI = confidence interval.
Sensitivity (95% CI)
Sensitivity
A
Broxton et al.13 Johansson et al.16
Pooled sensitivity = 0.49 (0.44–0.54) χ2 = 73.03; df = 7 (P = 0.0000) Inconsistency (I2) = 90.4%
0.29 (0.08–0.58) 0.50 (0.12–0.88) Mitra et al.6
Moore et al.18
0.75 (0.65–0.83) 0.67 (0.53–0.79) Nunez et al.20
Ohmori et al.17
0.31 (0.22–0.40) 0.59 (0.39–0.78) Stone et al.23
Tran et al.24
0.50 (0.12–0.88) 0.24 (0.14–0.35)
Johansson et al.16 0.95 (0.90–0.97) Mitra et al.6
Moore et al.18
0.21 (0.16–0.26) 0.76 (0.71–0.80) Nunez et al.20
Ohmori et al.17
0.91 (0.88–0.93) 0.84 (0.79–0.87) Stone et al.23
Tran et al.24
0.92 (0.82–0.97) 0.96 (0.95–0.97)
0 0.2 0.4 0.6 0.8 1.0
Specificity (95% CI)
Specificity
B
Broxton et al.13
Pooled specificity = 0.82 (0.80–0.83) χ2 = 740.43; df = 7 (P = 0.0000) Inconsistency (I2) = 99.1%
0.73 (0.57–0.85)
0 0.2 0.4 0.6 0.8 1.0
Sensitivity (95% CI)
Sensitivity
C
Tran et al.24 Stone et al.23
Pooled sensitivity = 0.50 (0.38–0.62) χ2 = 3.15; df = 1 (P = 0.0761) Inconsistency (I2) = 68.2%
0.47 (0.35–0.60) 0.83 (0.36–1.00)
0 0.2 0.4 0.6 0.8 1.0
Specificity (95% CI)
Specificity
D
Tran et al.24 Stone et al.23
Pooled specificity = 0.85 (0.83–0.88) χ2 = 6.06; df = 1 (P = 0.0138) Inconsistency (I2) = 83.5%
0.86 (0.84–0.89) 0.74 (0.61–0.84)
0 0.2 0.4 0.6 0.8 1.0
Fig. 4. Paired forest plot of the sensitivity and specificity of (A, B) MT and (C, D) CAT for overall mortality.
MT = massive transfusion, CAT = critical administration threshold, CI = confidence interval.
and 0.50, respectively). However, specificity was 0.82 and 0.85, respectively. This high specificity compared to sensitivity implies that patients with MT have higher mortality rates than those without MT. The present study also revealed the estimated mortality rate and ISS for each assessment (MT, CAT, and RI). The pooled mortality rate and ISS were high in each positive assessment. This indicates that all assessments are associated with the severity of the patients' condition.
In the era of DCR,2 transfusion for severe traumatic hemorrhage is a major concern and a big challenge for trauma surgeons. Two recent major trials regarding DCR have suggested that the guidance of damage control is needed. One is multicenter prospective observational study conducted at 10 level 1 trauma centers in the United States.26 The other is multicenter randomized control trial conducted at 12 level 1 trauma centers in the United States.27 Both studies supported the benefits of high ratios of plasma and platelets. The primary variable in the design of these studies was the ratio of blood components, not the amount of blood.
Three studies, using secondary analysis of both major studies, were included in the present study.3,9,10
The need for transfusion implies latent hemorrhage of internal organs, which is related to an adverse prognosis. Additionally, the transfusion itself can contribute to transfusion- related acute lung injury and various immunologic or non-immunologic adverse reactions.28 Thus, the amount of transfused blood is possibly a major risk factor for predicting mortality.
However, survival bias may influence results in the setting of the classic definition of MT because excluded patients who died early and the treatment for severe trauma patients are usually time-dependent variables.5,29 Therefore, other assessments, such as CAT and RI, are warranted for predicting early mortality within 24 hours; however, as shown in our systematic review, evidence of these assessments is limited.
Tran et al.,24in their recent systematic review and meta-analysis including 84 studies, noted acceptable prediction models for mortality describing the mechanisms of injury, systolic blood pressure, heart rate, hemoglobin, lactate, international normalized ratio, and focused abdominal sonography for trauma. All pooled ORs for each variable were significant.
However, the authors noted that a high-quality, evidence-based prediction model was lacking; MT, CAT, and RI were not eligible in their analysis. The prediction of traumatic mortality still needs more evidence.
Among eligible studies, only three had CAT outcomes. In a retrospective review of a single level 1 trauma center in Canada,24 CAT+ demonstrated significantly higher sensitivity than MT+ for the composition of 24-hour hemorrhage-related mortality and the need for hemostatic intervention as determined by the AUC (0.815 vs. 0.644, P > 0.001). Meyer et al.,10 in the secondary analysis of the Pragmatic, Randomized, Optimal Platelet and Plasma Ratios trial (PROPPR) study,27 demonstrated that both CAT and RI are valid surrogates for early mortality. In this study, CAT+ showed the best sensitivity and RI+ showed better specificity with good positive predictive value. Another study,23 which had CAT outcomes, was a pilot study that had a small sample size.
Rahbar et al.9 reported in their re-analysis of the PROMMTT study,26 which was an
observational clinical study conducted at 10 level 1 trauma centers in the United States, that RI in the first 30 minutes was significantly associated with 6- and 24-hour mortality. The study highlighted that the patients who received 4U or more of fluids were 2.2 fold more
likely to die regardless of fluid type and 2.4 fold more likely to go to the operation room.
The authors suggested that RI would be a more generalized definition for sickness and serve as surrogate for bleeding and mortality in severe trauma patients. Both CAT and RI appear potentially useful as surrogates for predicting early mortality in the trauma field. However, the distribution of both RI and CAT in published studies is limited based on our analysis.
The current analysis has several limitations. First, the number of extracted CAT and RI datasets was only two. Because of the small number of studies regarding CAT, the robustness of the statistical model was not secured, and more future studies will be needed. Although we acknowledge that an analysis including a small number of studies is not really the best option, paradoxically, we suggest that the present study takes the initiative in attempting to find a meaningful predictor for mortality. More sufficient studies regarding this issue are warranted. Second, the eligible studies for the present study included various heterogeneous datasets composed of single-center cohorts, multi-center cohorts, and a nationwide database. Although this heterogeneity, we could obtain a large number of patients' data, especially due to national cohorts. Third, one of the eligible studies is an RCT and the others are non-RCT. Some other meta-analyses that were conducted distinguished RCTs from non-RCTs in their analyses. However, the key distinction should not be the design of the studies but an unbiased estimate of the effect size in question.30 The key question of the present study was not focused on an intervention that determines a randomized allocation of patients; it focused instead on the prognosis of patients. Additionally, the original primary variable of the eligible RCT was the ratio of transfused blood components, and it was the secondary analysis of the original study. Thus, regardless of the study design, we computed the estimate of the summarized effect size. Fourth, we computed the estimated mortality rate and ISS used to combine single descriptive statistics.30 Occasionally, a meta-analysis is used to assess the prevalence as shown in a previous study.31 We aimed to investigate the mortality across the studies in terms of each assessment (MT, CAT, and RI).
Based on the present meta-analysis, CAT may be a more sensitive predictor for 24-hour mortality than other predictors. Furthermore, RI also appears to be a useful predictor for 24- hour mortality. Both MT and CAT showed high specificity for overall mortality. Despite limited evidence owing to the heterogeneous studies with small sample sizes, we suggest that these are the best available outcomes from the limited evidence at this point in time. Our analysis highlights the need for further large-scale prospective investigations regarding this issue.
However, in hemodynamically unstable patients, such research designs will be a big challenge.
SUPPLEMENTARY MATERIALS
Supplementary Table 1
DTA review in mortality of trauma patient with massive transfusion Click here to view
Supplementary Table 2
Quality assessment of eligible studies by PROBAST resultsa Click here to view
REFERENCES
1. Shackelford SA, Colton K, Stansbury LG, Galvagno SM Jr, Anazodo AN, DuBose JJ, et al. Early
identification of uncontrolled hemorrhage after trauma: current status and future direction. J Trauma Acute Care Surg 2014;77(3 Suppl 2):S222-7.
PUBMED | CROSSREF
2. Cannon JW, Khan MA, Raja AS, Cohen MJ, Como JJ, Cotton BA, et al. Damage control resuscitation in patients with severe traumatic hemorrhage: a practice management guideline from the Eastern Association for the Surgery of Trauma. J Trauma Acute Care Surg 2017;82(3):605-17.
PUBMED | CROSSREF
3. Pommerening MJ, Goodman MD, Holcomb JB, Wade CE, Fox EE, Del Junco DJ, et al. Clinical gestalt and the prediction of massive transfusion after trauma. Injury 2015;46(5):807-13.
PUBMED | CROSSREF
4. Malone DL, Hess JR, Fingerhut A. Massive transfusion practices around the globe and a suggestion for a common massive transfusion protocol. J Trauma 2006;60(6 Suppl):S91-6.
PUBMED | CROSSREF
5. Austin PC, Platt RW. Survivor treatment bias, treatment selection bias, and propensity scores in observational research. J Clin Epidemiol 2010;63(2):136-8.
PUBMED | CROSSREF
6. Mitra B, Cameron PA, Gruen RL, Mori A, Fitzgerald M, Street A. The definition of massive transfusion in trauma: a critical variable in examining evidence for resuscitation. Eur J Emerg Med 2011;18(3):137-42.
PUBMED | CROSSREF
7. Kashuk JL, Moore EE, Johnson JL, Haenel J, Wilson M, Moore JB, et al. Postinjury life threatening coagulopathy: is 1:1 fresh frozen plasma:packed red blood cells the answer? J Trauma 2008;65(2):261-70.
PUBMED | CROSSREF
8. Savage SA, Sumislawski JJ, Zarzaur BL, Dutton WP, Croce MA, Fabian TC. The new metric to define large- volume hemorrhage: results of a prospective study of the critical administration threshold. J Trauma Acute Care Surg 2015;78(2):224-9.
PUBMED | CROSSREF
9. Rahbar E, Fox EE, del Junco DJ, Harvin JA, Holcomb JB, Wade CE, et al. Early resuscitation intensity as a surrogate for bleeding severity and early mortality in the PROMMTT study. J Trauma Acute Care Surg 2013;75(1 Suppl 1):S16-23.
PUBMED | CROSSREF
10. Meyer DE, Cotton BA, Fox EE, Stein D, Holcomb JB, Cohen M, et al. A comparison of resuscitation intensity and critical administration threshold in predicting early mortality among bleeding patients: a multicenter validation in 680 major transfusion patients. J Trauma Acute Care Surg 2018;85(4):691-6.
PUBMED | CROSSREF
11. Moher D, Liberati A, Tetzlaff J, Altman DGPRISMA Group. Preferred reporting items for systematic reviews and meta-analyses: the PRISMA statement. BMJ 2009;339:b2535.
PUBMED | CROSSREF
12. Boutefnouchet T, Gregg R, Tidman J, Isaac J, Doughty H. Emergency red cells first: rapid response or speed bump? The evolution of a massive transfusion protocol for trauma in a single UK centre. Injury 2015;46(9):1772-8.
PUBMED | CROSSREF
13. Broxton S, Medeiros R, Abuzeid A, Peterson C, Schumacher A. Implementation of a massive transfusion protocol: evaluation of its use and efficacy. J Trauma Nurs 2018;25(2):92-7.
PUBMED | CROSSREF
14. Hamidi M, Zeeshan M, Kulvatunyou N, Adun E, O'Keeffe T, Zakaria ER, et al. Outcomes after massive transfusion in trauma patients: variability among trauma centers. J Surg Res 2019;234:110-5.
PUBMED | CROSSREF
15. Huber-Wagner S, Qvick M, Mussack T, Euler E, Kay MV, Mutschler W, et al. Massive blood transfusion and outcome in 1062 polytrauma patients: a prospective study based on the Trauma Registry of the German Trauma Society. Vox Sang 2007;92(1):69-78.
PUBMED | CROSSREF
16. Johansson PI, Sørensen AM, Larsen CF, Windeløv NA, Stensballe J, Perner A, et al. Low hemorrhage- related mortality in trauma patients in a Level I trauma center employing transfusion packages and early thromboelastography-directed hemostatic resuscitation with plasma and platelets. Transfusion 2013;53(12):3088-99.
PUBMED | CROSSREF
17. Maegele M, Lefering R, Paffrath T, Tjardes T, Simanski C, Bouillon B, et al. Red-blood-cell to plasma ratios transfused during massive transfusion are associated with mortality in severe multiple injury: a retrospective analysis from the Trauma Registry of the Deutsche Gesellschaft für Unfallchirurgie. Vox Sang 2008;95(2):112-9.
PUBMED | CROSSREF
18. Moore FA, Nelson T, McKinley BA, Moore EE, Nathens AB, Rhee P, et al. Massive transfusion in trauma patients: tissue hemoglobin oxygen saturation predicts poor outcome. J Trauma 2008;64(4):1010-23.
PUBMED | CROSSREF
19. Murry JS, Zaw AA, Hoang DM, Mehrzadi D, Tran D, Nuno M, et al. Activation of massive transfusion for elderly trauma patients. Am Surg 2015;81(10):945-9.
PUBMED
20. Nunez TC, Voskresensky IV, Dossett LA, Shinall R, Dutton WD, Cotton BA. Early prediction of massive transfusion in trauma: simple as ABC (assessment of blood consumption)? J Trauma 2009;66(2):346-52.
PUBMED | CROSSREF
21. Ogura T, Nakamura Y, Nakano M, Izawa Y, Nakamura M, Fujizuka K, et al. Predicting the need for massive transfusion in trauma patients: the Traumatic Bleeding Severity Score. J Trauma Acute Care Surg 2014;76(5):1243-50.
PUBMED | CROSSREF
22. Ohmori T, Kitamura T, Ishihara J, Onishi H, Nojima T, Yamamoto K, et al. Early predictors for massive transfusion in older adult severe trauma patients. Injury 2017;48(5):1006-12.
PUBMED | CROSSREF
23. Stone ME Jr, Kalata S, Liveris A, Adorno Z, Yellin S, Chao E, et al. End-tidal CO2 on admission is associated with hemorrhagic shock and predicts the need for massive transfusion as defined by the critical administration threshold: a pilot study. Injury 2017;48(1):51-7.
PUBMED | CROSSREF
24. Tran A, Nemnom MJ, Lampron J, Matar M, Vaillancourt C, Taljaard M. Accuracy of massive transfusion as a surrogate for significant traumatic bleeding in health administrative datasets. Injury 2019;50(2):318-23.
PUBMED | CROSSREF
25. Wolff RF, Moons KG, Riley RD, Whiting PF, Westwood M, Collins GS, et al. PROBAST: a tool to assess the risk of bias and applicability of prediction model studies. Ann Intern Med 2019;170(1):51-8.
PUBMED | CROSSREF
26. Holcomb JB, del Junco DJ, Fox EE, Wade CE, Cohen MJ, Schreiber MA, et al. The prospective,
observational, multicenter, major trauma transfusion (PROMMTT) study: comparative effectiveness of a time-varying treatment with competing risks. JAMA Surg 2013;148(2):127-36.
PUBMED | CROSSREF
27. Holcomb JB, Tilley BC, Baraniuk S, Fox EE, Wade CE, Podbielski JM, et al. Transfusion of plasma, platelets, and red blood cells in a 1:1:1 vs a 1:1:2 ratio and mortality in patients with severe trauma: the PROPPR randomized clinical trial. JAMA 2015;313(5):471-82.
PUBMED | CROSSREF
28. Sahu S, Hemlata, Verma A. Adverse events related to blood transfusion. Indian J Anaesth 2014;58(5):543-51.
PUBMED | CROSSREF
29. van Walraven C, Davis D, Forster AJ, Wells GA. Time-dependent bias was common in survival analyses published in leading clinical journals. J Clin Epidemiol 2004;57(7):672-82.
PUBMED | CROSSREF
30. Borenstein M, Hedges LV, Higgins JP, Rothstein HR. Introduction to Meta-analysis. Chichester: John Wiley &
Sons; 2009.
31. Rona RJ, Keil T, Summers C, Gislason D, Zuidmeer L, Sodergren E, et al. The prevalence of food allergy: a meta-analysis. J Allergy Clin Immunol 2007;120(3):638-46.
PUBMED | CROSSREF