ISSN 2234-3806 • eISSN 2234-3814
https://doi.org/10.3343/alm.2019.39.6.572
EDTA Treatment for Overcoming the Prozone Effect and for Predicting C1q Binding in HLA Antibody Testing
Hoon Seok Kim , M.D., Ae-Ran Choi , M.T., Mina Yang , M.D., and Eun-Jee Oh , M.D., Ph.D.
Department of Laboratory Medicine, Seoul St. Mary’s Hospital, College of Medicine, The Catholic University of Korea, Seoul, Korea
The Luminex-based single antigen bead (SAB) assay is widely used to detect HLA anti- body in transplant recipients. However, one limitation of the SAB assay is the prozone ef- fect, which occurs mostly as a result of complement interference. We investigated the effi- cacy of EDTA treatment for overcoming the prozone effect and predicting C1q binding of HLA antibody. We subjected 27 non-treated (naïve) and EDTA-treated serum samples from highly sensitized patients to IgG-SAB assays, and we confirmed the prozone effect in 53% and 31% of class I and class II antibody tests, respectively, after EDTA treatment.
When we conducted additional assays after dithiothreitol treatment and serum dilution, EDTA was the most efficacious in eliminating the prozone effect. Reducing the prozone ef- fect by EDTA treatment strengthened the correlation between IgG mean fluorescence in- tensity (MFI) and C1q MFI values (ρ=0.825) as compared with the naïve sera (ρ=0.068).
Although C1q positivity was dependent on the concentration of HLA antibody in EDTA- treated sera, the correlations varied individually. Overall, our results confirmed the efficacy of EDTA treatment for overcoming the prozone effect. EDTA treatment showed a positive effect on the correlation between IgG MFI and C1q MFI values.
Key Words: Prozone effect, EDTA, Single antigen bead assay, C1q binding, HLA antibody
Received: January 4, 2019 Revision received: April 1, 2019 Accepted: June 9, 2019 Corresponding author:
Eun-Jee Oh, M.D., Ph.D.
Department of Laboratory Medicine, Seoul St. Mary’s Hospital, College of Medicine, The Catholic University of Korea, 222 Banpo-daero, Seocho-gu, Seoul 06591, Korea
Tel: +82-2-2258-1641 Fax: +82-2-2258-1719 E-mail: [email protected]
© Korean Society for Laboratory Medicine This is an Open Access article distributed under the terms of the Creative Commons Attribution Non-Commercial License (http://creativecom- mons.org/licenses/by-nc/4.0) which permits unrestricted non-commercial use, distribution, and reproduction in any medium, provided the original work is properly cited.
Accurate assessment of HLA antibody is crucial for successful transplant management [1]. The Luminex-based single antigen bead (SAB) assay is widely used for sensitive detection of low concentrations of antibody [2-5]. In the SAB assay, antibody amount is determined semi-quantitatively and is expressed as the mean fluorescence intensity (MFI) after reaction with anti- human IgG antibody reagent labeled with a fluorescent dye.
MFI values correlate with transplant-related outcomes; thus, monitoring MFI values may be useful for risk assessment after transplantation [6, 7]. In addition, SAB assays for detecting C1q- binding HLA antibodies (C1q SAB) have been introduced to bet- ter discriminate clinically relevant antibodies [8].
However, clinical application of the SAB assay is limited be- cause of technical issues, including assay variability, complement
interference, and the prozone effect [9]. Inhibition causing false- negative or falsely decreased MFI values has been observed in approximately 70% of highly sensitized patients [10]. Several studies have attempted to eliminate the prozone effect by treat- ment with EDTA or dithiothreitol (DTT), preheating, and/or dilu- tion of serum [9, 11, 12]. There are multiple explanations for the prozone effect, including bead saturation [13, 14], steric hindrance from complement complex [11], and the presence of IgM HLA-specific antibodies [15]. Complement interference in- volves covalent binding and accumulation of C4 and C3 degra- dation products on the immune complex, which prevent fluo- rescent anti-IgG from binding to IgG. EDTA eliminates the pro- zone effect because, as an iron-chelating reagent, it can inhibit the formation of C1qrs complement complex and prevent com-
2017-03-16 https://crossmark-cdn.crossref.org/widget/v2.0/logos/CROSSMARK_Color_square.svg
plement cascade activation [16]. DTT disrupts the pentameric structure of IgM and the disulfide bonds in complement mole- cules, thus reducing the prozone effect [15]. In this respect, SAB assays as a standard should include serum treatment to correct the prozone effect because MFI values are often used as a surrogate marker of antibody strength. Although a recent meeting report recommended EDTA and/or titration [1], there is currently no verified standard method, and different treatment methods are used across different laboratories.
We compared MFI values of SAB assays in serum samples treated with or without EDTA, DTT, or dilution. In addition, we evaluated the correlation between IgG-MFI and C1q-MFI values after EDTA treatment. To our knowledge, this is the first study to investigate the effects of EDTA on specific HLA loci in combina- tion with C1q-MFI.
We collected leftover sera from 27 highly sensitized patients (median age =49 years, M:F =14:13). All samples contained strong HLA antibodies (MFI≥10,000), and the median panel- reactive antibody (%) was 95%. The patients had become sen- sitized by previous transplantation with or without transfusion or pregnancy (81.5%, N =22), previous pregnancy and transfu- sion (7.4%, N=2), previous pregnancy alone (7.4%, N=2), or previous transfusion alone (3.7%, N=1). The Institutional Re- view Board of Seoul St. Mary’s Hospital, Seoul, Korea, approved this study (KC18SESI0323). LABScreen Single Antigen kits and
the LABScan 3D system (One Lambda, A Thermo Fisher Scien- tific Brand, Canoga Park, CA, USA) were used to detect HLA antibodies (11 samples for class I only, eight samples for class II only, and eight samples for both class I and class II). For EDTA treatment, a 0.5 M EDTA solution was diluted 1:20 (final con- centration of 25 mM), added to the serum, vortexed, and centri- fuged at room temperature for 10 minutes before testing [10].
We defined the prozone effect as doubled MFI values, with an MFI cutoff of 1,000, or 5,000 MFI increment after serum treat- ment compared with the results from naïve serum, considering recent recommendations and reports [1, 12, 17].
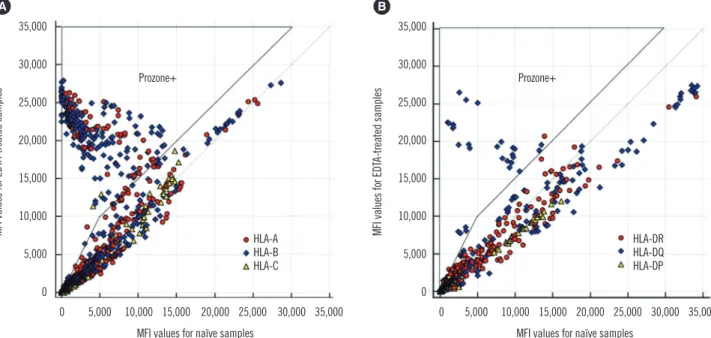
In a comparison of naïve and EDTA-treated samples, we in- vestigated MFI data from 3,363 beads (1,843 class I and 1,520 class II) from 35 tests (19 class I and 16 class II) (Fig. 1). The prozone effect was identified in 53% (10 out of 19) of class I antibody tests and in 31% (5 out of 16) of class II antibody tests after EDTA treatment. Of all beads, 8.3% (26.5% of positive beads) were affected by complement inhibition, with the me- dian MFI increasing from 2,921 (range, 0–13,890) to 21,043 (1,024–27,874) after EDTA treatment. Regarding HLA specific- ity, prozone effect incidences were as follows: HLA-A, 28.1%;
HLA-B, 43.6%; HLA-C, 3.6%; HLA-DR, 2.7%; HLA-DQ, 18.0%;
and HLA-DP, <0.1% of positive beads. These findings were consistent with a previous report wherein HLA-C beads were the least affected among class I beads and HLA-DQ beads were the
Fig. 1. Comparison of MFI values in naïve and EDTA-treated sera. (A) Class I IgG-SAB results in 19 sera (1,843 beads); (B) Class II IgG- SAB results in 16 sera (1,520 beads).
Abbreviations: MFI, mean fluorescence intensity; SAB, single antigen bead.
35,000
30,000
25,000
20,000
15,000
10,000
5,000
0
0 5,000 10,000 15,000 20,000 25,000 30,000 35,000 MFI values for naïve samples
MFI values for EDTA-treated samples
Prozone+
HLA-A HLA-B HLA-C A
35,000
30,000
25,000
20,000
15,000
10,000
5,000
0
0 5,000 10,000 15,000 20,000 25,000 30,000 35,000 MFI values for naïve samples
MFI values for EDTA-treated samples
Prozone+
HLA-DR HLA-DQ HLA-DP B
most affected among class II beads [18].
We selected five sera and additionally tested class I IgG after 1:8 dilution in phosphate-buffered saline and treatment with 5 mM DTT at 37°C for 30 minutes [19]. When we compared the three serum treatment methods, EDTA treatment was the most efficacious for overcoming prozone effect (Fig. 2). This finding was consistent with previous studies that showed the superior efficacy of EDTA for overcoming the prozone effect [12, 16].
DTT treatment and dilution resulted in small increases in MFI values in some of the beads, indicating a residual prozone ef- fect, presumably because only IgM antibodies were removed (Supplemental Data Table S1).
We subjected 10 samples with the prozone effect (N=5 for class I and N=5 for class II HLA antibodies) to C1qScreen as- says (One Lambda). We selected beads that were positive in EDTA-treated sera to calculate Spearman’s correlation coeffi- Fig. 2. MFI values for naïve samples and samples treated with 1:8 dilution, DTT, and EDTA, and C1q assay using sera from five sensitized patients. (A) MFI values for all samples with various treatments. (B) Correlations between MFI values for naïve, diluted, DTT-treated, and EDTA-treated samples.
Abbreviations: MFI, mean fluorescence intensity; DTT, dithiothreitol.
A
B
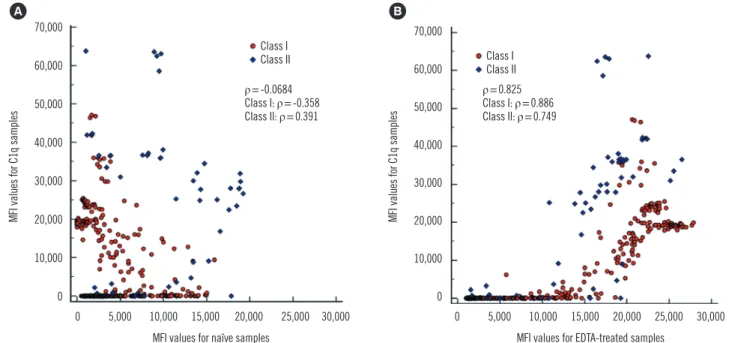
Fig. 3. Correlation of MFI values from C1q- and IgG-SAB assays using (A) naïve sera and (B) EDTA-treated sera.
Abbreviations: MFI, mean fluorescence intensity; SAB, single antigen bead.
70,000
60,000
50,000
40,000
30,000
20,000
10,000
0
0 5,000 10,000 15,000 20,000 25,000 30,000 MFI values for naïve samples
MFI values for C1q samples
Class I Class II ρ=-0.0684 Class I: ρ=-0.358 Class Il: ρ=0.391 A
70,000
60,000
50,000
40,000
30,000
20,000
10,000
0
0 5,000 10,000 15,000 20,000 25,000 30,000 MFI values for EDTA-treated samples
MFI values for C1q samples
B
Class I Class II ρ=0.825 Class I: ρ=0.886 Class Il: ρ=0.749
cient (ρ). MFI values were summarized as median (range). For statistical analysis, we used MedCalc Statistical Software version 18.9 (MedCalc Software, Ostend, Belgium).
When naïve sera were used, the correlation between IgG-MFI values and C1q-MFI values was weak (ρ=-0.0684; class I: -0.358, class II: 0.391). After EDTA treatment, the correlation between IgG-MFI values and C1q-MFI values became stronger (ρ=0.825;
class I: 0.886, class II: 0.749) (Fig. 3). Beads that displayed low IgG-MFI values in naïve sera, but high C1q-MFI values, showed high IgG-MFI values after EDTA treatment. In naïve sera, C1q- SAB beads with MFI≥1,000 (19.7% of all beads) had a median IgG-MFI value of 2,842 (range, 0–19,256). In EDTA-treated sera, C1q-positive beads had a median IgG-MFI value of 20,900 (1,539–27,874). These results supported previous findings that C1q binding ability depends on the concentration of HLA anti- body [12]. Tambur and Wiebe [9] reported that MFI cutoffs that predicted C1q positivity varied from 6,237 to 14,154 using non- treated samples. However, not all beads that had high IgG-MFI values in EDTA-treated sera showed C1q positivity, and some high-level IgG antibodies did not bind to C1q. When we plotted IgG-MFI against C1q-MFI values from the data in 10 patients separately, we found a wide range of correlation coefficients (0.283–0.977). Therefore, it remains to be elucidated whether there is an interdependence between C1q positivity and IgG- MFI values.
Some limitations of the present study were that we could not
test serial dilutions of samples, and we did not confirm the HLA- specific antibodies against intact HLA antigen on the lympho- cyte. Because high-level antibodies against denatured HLA pro- tein might also bind to C1q [20], future studies on interference by denatured HLA are needed. In addition, we selected samples with high panel-reactive antibody and strong HLA antibodies.
Thus, our results may not represent the frequency of the pro- zone effect in SAB assays in general.
In conclusion, we confirmed the efficacy of EDTA treatment for eliminating the prozone effect. Further, EDTA treatment had a positive effect on the correlation between IgG MFI and C1q MFI values. Our study highlights the importance of method stan- dardization to correct the prozone effect.
Authors’ Disclosures of Potential Conflicts of Interest
No potential conflicts of interest relevant to this article are re- ported.
Acknowledgments
This work was supported by the National Research Foundation of Korea (NRF) grant funded by the Korea government (MSIP) (NRF-2017R1A2B4011181), Korea.
ORCID
Hoon Seok Kim https://orcid.org/0000-0001-8980-8177 Ae-Ran Choi https://orcid.org/0000-0001-6150-1800 Mina Yang https://orcid.org/0000-0001-7431-6380 Eun-Jee Oh https://orcid.org/0000-0001-5870-915X
REFERENCES
1. Tambur AR, Campbell P, Claas FH, Feng S, Gebel HM, Jackson AM, et al.
Sensitization in transplantation: assessment of risk (STAR) 2017 work- ing group meeting report. Am J Transplant 2018;18:1604-14.
2. Oh EJ, Park H, Park KU, Kang ES, Kim HS, Song EY. Interlaboratory comparison of the results of Lifecodes LSA Class I and Class II Single Antigen Kits for Human Leukocyte Antigen Antibody Detection. Ann Lab Med 2015;35:321-8.
3. Gebel HM and Bray RA. The evolution and clinical impact of human leukocyte antigen technology. Curr Opin Nephrol Hypertens 2010;19:
598-602.
4. Jang JY, Kim YJ, Kim Y, Park YJ, Han K, Oh EJ. Application of calculat- ed panel reactive antibody using HLA frequencies in Koreans. Ann Lab Med 2012;32:66-72.
5. Min JW, Lee H, Choi BS, Park CW, Yang CW, Kim YS, et al. Clinical im- pact of pre-transplant antibodies against angiotensin II Type I receptor and major histocompatibility complex class I-related chain A in kidney transplant patients. Ann Lab Med 2018;38:450-7.
6. Mujtaba MA, Goggins W, Lobashevsky A, Sharfuddin AA, Yaqub MS, Mishler DP, et al. The strength of donor-specific antibody is a more reli- able predictor of antibody-mediated rejection than flow cytometry cross- match analysis in desensitized kidney recipients. Clin Transplant 2011;
25:E96-102.
7. Zachary A and Reinsmoen NL. Quantifying HLA-specific antibodies in patients undergoing desensitization. Curr Opin Organ Transplant 2011;
16:410-5.
8. Lee H, Han E, Choi AR, Ban TH, Chung BH, Yang CW, et al. Clinical impact of complement (C1q, C3d) binding de novo donor-specific HLA antibody in kidney transplant recipients. PLoS One 2018;13:e0207434.
9. Tambur AR and Wiebe C. HLA diagnostics: evaluating DSA strength by titration. Transplantation 2018:102:S23-30.
10. Tambur AR, Herrera ND, Haarberg KM, Cusick MF, Gordon RA, Leven- thal JR, et al. Assessing antibody strength: comparison of MFI, C1q, and titer information. Am J Transplant 2015;15:2421-30.
11. Schnaidt M, Weinstock C, Jurisic M, Schmid-Horch B, Ender A, Wernet D. HLA antibody specification using single-antigen beads—a technical solution for the prozone effect. Transplantation 2011;92:510-5.
12. Zhang X and Reinsmoen NL. Comprehensive assessment for serum treatment for single antigen test for detection of HLA antibodies. Hum Immunol 2017;78:699-703.
13. Ellis TM. Interpretation of HLA single antigen bead assays. Transplant Rev (Orlando) 2013;27:108-11.
14. Tambur AR, Glotz D, Herrera ND, Chatroop EN, Roitberg T, Friedewald JJ, et al. Can solid phase assays be better utilized to measure efficacy of antibody removal therapies? Hum Immunol 2016;77:624-30.
15. Kosmoliaptsis V, Bradley JA, Peacock S, Chaudhry AN, Taylor CJ. De- tection of immunoglobulin G human leukocyte antigen-specific alloanti- bodies in renal transplant patients using single-antigen-beads is com- promised by the presence of immunoglobulin M human leukocyte anti- gen-specific alloantibodies. Transplantation 2009;87:813-20.
16. Schwaiger E, Wahrmann M, Bond G, Eskandary F, Böhmig GA. Com- plement component C3 activation: the leading cause of the prozone phenomenon affecting HLA antibody detection on single-antigen beads.
Transplantation 2014;97:1279-85.
17. Liu C, Pang S, Phelan D, Brennan DC, Mohanakumar T. Quantitative evaluation of the impact of ethylenediaminetetraacetic acid pretreat- ment on single-antigen bead assay. Transplant Direct 2017;3:e194.
18. Guidicelli G, Visentin J, Franchini N, Borg C, Merville P, Couzi L, et al.
Prevalence, distribution and amplitude of the complement interference phenomenon in single antigen flow beads assays. HLA 2018;91:507- 13.
19. Hahn AB. Inactivation of IgM antibodies. In: Hahn AB, Land GA, Stroth- man RM, et al. eds. ASHI laboratory manual. 4th ed. I. Mount Laurel:
Society for Histocompatibility and Immunogenetics, 2000:4.1.
20. Taylor CJ, Kosmoliaptsis V, Martin J, Knighton G, Mallon D, Bradley JA, et al. Technical limitations of the C1q Single-Antigen Bead Assay to de- tect complement binding HLA-specific antibodies. Transplantation 2017;
101:1206-14.
Supplemental Data Table S1. MFI values of Class I 97 beads in SAB assays among naïve, dilution, DTT, and EDTA treatments using sera from five sensitized patients A llele specificitySample 1Sample 2Sample 3Sample 4Sample 5 NaïveDilutionDTTEDTANaïveDilutionDTTEDTANaïveDilutionDTTEDTANaïveDilutionDTTEDTANaïveDilutionDTTEDTA A*01:013982251734763,427 705*1,0083,97910,4206,04210,42611,66236011102420000 A*02:012,60310,93918,80623,6285,9557,80810,32215,52600001,69716,34121,95120,609944769154 A*02:033,8848,59915,03518,9547,7534,8618,31612,43940001,52216,63921,89121,6181064878174 A*02:064,74813,30417,83221,8658,6046,3098,70613,49400002,11916,54621,50720,909782564116 A*03:016491173965427,7572,2564,5269,64311,4837,54513,04614,65020016527220264956 A*11:0196391987,4081,6574,3179,09912,6378,52714,90716,6114,095613*1,3182,39532695144545 A*11:0200003,3381,8425,0708,65411,37810,13316,52718,6063,385643*1,5452,959262123189784 A*23:01348108172409000011,9315,04110,81412,2721,687118*40*1,1215852411071,022 A*24:0284368353764000010,19810,41115,44416,32900000000 A*24:031,356158*623*1,28400009,8208,34112,66912,886285001133202337 A*25:011300212,6218,59813,32920,2578,7092,9987,9719,61013,7763,7267,60610,38216747117188 A*26:0114101702742,4577,27814,46420,7885,0321,5894,6175,67413,1533,2026,4399,2605002367 A*29:014461071774931,4758,51618,16224,2666301196459611,12261*313*619*2,7351,3672,2373,779 A*29:027072173147281,0818,37218,02124,5728041557521,1361,21870*297*675*1,985867*1,4072,948 A*30:016031324505591,0099,20822,24026,32947660444709000016090 A*30:0249042462,28411,32721,79925,20038358407632000010132 A*31:01000006,55121,88625,952584705048016532325532520166117327 A*32:01187201121372,2248,82013,86720,6585,5801,4234,5396,16969868208391564114570784 A*33:0140401,2608,67919,64725,4172,5041,1692,9223,4752,843328*934*1,5875704582 A*33:0300008088,31719,46425,1248462108561,2033,929488*1,2162,13511529161168 A*34:01182101651963,1359,65418,30123,7858022389351,2883,991464*1,1632,296220219 A*34:027731435636785847,35518,73726,2011,705620*1,7082,2695,113623*1,5863,1442402532 A*36:0153023742,025 171*137*2,4032,6472,8943,9504,5952290511531013565193 A*43:01254543324822,8426,59611,93119,1746,3012,1235,6346,9486,6811,0862,2933,9547,6765,0595,9999,492 A*66:01420641381,1127,45018,54124,4666,6142,0045,7446,85413,6533,4086,7869,82211701867 A*66:0210,6716,1546,5179,8301,5998,75718,81624,7921,243349*1,4131,7442,242200*560*1,25710,2445,1736,39510,680 A*68:015,8557,54818,12521,6257,2622,9273,4247,0397651606861,0483,56010,69615,12519,14117253146202 A*68:027,7017,40016,82620,5757,2422,9653,6597,0664,6401,6964,2485,8803,10011,59416,75519,037144083141 A*69:017,5449,06416,81419,8056,5952,9384,5298,103557954797643,88012,66316,01719,4362051380189 A*74:019571947456917117,71719,30425,3065321064747905887025037018861128373 (Continued to the next page)
A llele specificitySample 1Sample 2Sample 3Sample 4Sample 5 NaïveDilutionDTTEDTANaïveDilutionDTTEDTANaïveDilutionDTTEDTANaïveDilutionDTTEDTANaïveDilutionDTTEDTA A*80:01151681711114,090554*2,1834,3387,2362,6466,6187,0823110982291350102126 B*07:029,80214,96018,64620,92900001,328440*1,5121,7325,017704*2,2092,8615,48410,96116,47318,046 B*08:011,062575*1,1641,0450001577,7707,88313,73215,575165001141,305490*1,5871,903 B*13:0114,83111,11111,80013,3243,7727,72414,18320,6585,30613,52116,34219,563000010,1457,55810,15210,626 B*13:025,31914,00717,94020,4921485,74118,14324,8932,06015,26914,03222,06300057,11711,53615,14616,887 B*14:0155041655766,38218,85022,5452,83811,22213,86118,70341004642852379486 B*14:0233027412,5488,38417,38920,0076,1007,68411,90213,172000533015255392 B*15:0110,7007,3848,63210,28504,99421,17826,9868409,0619,84723,57000004,4144,7399,34311,715 B*15:0295136480184304,38422,33226,4937077,7019,19723,5407000514,8461,3666,0237,751 B*15:039,3266,1857,7888,93606,01122,37326,3689419,37510,02222,923000164,4024,8969,96012,050 B*15:104,5642,7543,7854,57305,72821,77126,4635887,6579,29123,637138027993,6661,2743,7354,963 B*15:118834889079143616,91222,53325,7531,09310,82511,75121,8602100201,648280*1,8642,053 B*15:124,9392,6074,1935,04304,22121,78427,6827308,5219,27824,4264,507629*1,8402,7633,803749*3,3664,190 B*15:132041072252534936,67621,82224,4421,68811,07112,11922,035539215037415953225177 B*15:16000005,15121,09725,8088399,92710,17322,3042,68388*1,0321,7691090133245 B*18:011250661112406,03922,30927,8742,11213,79513,36222,6715600516,3573,6276,4477,555 B*27:052,0569,54620,64423,8735,6366,4477,97012,309000012,2464,7509,9189,6497,27311,56014,98416,692 B*27:081,7858,84021,17024,6302,6438,05811,84816,220000010,9213,5869,0087,3112,3419,53819,78721,511 B*35:012,023966*1,9011,985815,99720,82425,7871,2199,34110,41822,10449016495,4733,2987,0247,893 B*37:016,87911,85419,14722,43604,90117,88123,4053,99812,25614,62419,4621,960203*637*1,1667,3413,4545,8215,736 B*38:0113,2968,62911,11412,638535,39318,69723,2413,14913,68815,84320,6805,350859*2,4583,5254,3402,0214,1464,698 B*39:0111,9806,80010,37111,45603,73717,51722,5112,67912,53515,52720,7453,455429*1,4722,3767,3167,77311,64612,694 B*40:0112,86416,31818,12820,67800004,59014,12316,94920,6832,717337*1,2881,4772,63010,45820,70823,258 B*40:0210,00115,58118,10420,90000003,65613,65815,80021,3091,781179*767*1,0371,9339,29519,68821,703 B*40:0615,92215,83816,99518,85600005,93813,02916,19919,8428711124995302,83410,05318,49120,256 B*41:0114,99410,79412,40013,9590001102,98915,35515,29721,138682952544125,3807,16410,80612,420 B*42:014,48213,14619,13521,77478615008558111091222,051190*677*1,1505,5063,1335,7737,494 B*44:023,4341,0752,8092,9648,61911,97416,26618,9902,81513,86913,32321,2985,605858*2,0273,360463136424518 B*44:036,2382,6075,2725,8321,9239,32819,50322,78994110,99110,27423,7917,6441,3703,5084,9981,154420*1,0861,370 B*45:014,6551,7063,9454,2781,2568,69520,11423,77592210,4589,77322,8114,564718*1,9002,8367,1535,4108,82510,091 (Continued to the next page)
Supplemental Data Table S1. Continued
A llele specificitySample 1Sample 2Sample 3Sample 4Sample 5 NaïveDilutionDTTEDTANaïveDilutionDTTEDTANaïveDilutionDTTEDTANaïveDilutionDTTEDTANaïveDilutionDTTEDTA B*46:010013405,57521,68325,1952,97413,79814,40520,93300002909147 B*47:0114,0428,64611,21912,8498,4606,3917,08111,18412,82810,23715,74916,9132,598226*616*1,4539,7215,6048,2199,699 B*48:0113,40515,43417,49519,4154,9268,61415,22319,2524,20813,77916,60820,2122,409246*958*1,2653,24210,93219,22621,672 B*49:0111,6378,70710,53611,7859479,44522,80525,5317908,0469,61023,8512,887305*784*1,8597,7765,6718,3849,727 B*50:0113,2529,98911,19812,9341,0059,79422,05824,2628538,9699,92623,771303331452124,3497,38313,19315,020 B*51:01000005,89922,16626,3569979,38910,35122,7871,583166*430*1,0490060 B*51:0236220449156305,38121,34626,4178488,3439,91122,9501,494123*250*963*5809174 B*52:018162718308021,0168,99722,05924,9131,45211,20512,23221,7907070464486543948211,178 B*53:012,3551,0481,9952,0211036,26821,24525,3111,25210,54311,12921,8171,897138*518*1,182609202990841 B*54:0111,3179,45213,55214,9194,5359,75615,84218,9606,5142,2855,7697,68334801152373,6981,5153,8104,359 B*55:0115,03610,60412,34013,9167,61610,56114,61118,1827,3573,8667,1478,586792923154943,2931,2643,1603,510 B*56:016,68513,12917,58919,7571,1569,87322,15524,8342,20912,82414,21020,445600292593964,0252,8436,0377,519 B*57:01000005,18421,05625,5861,32910,49111,10822,1574,5471,4296,2565,61522865450468 B*57:03000004,21921,15926,7568959,64710,17222,6703,0331,5127,6296,3985112009671,024 B*58:0100007208,73722,65325,1531,26710,97111,61322,7284,8861,4286,0185,547576168897968 B*59:017,1533,9896,3746,6325,0667,26911,01815,0306,35711,23715,45917,6761,36179*330*911*529188721656 B*67:012,01010,17820,07923,2906557,02517,37320,863970971262,357246*967*1,4656,4734,7607,2758,857 B*73:012,1329,50520,13223,3586721663971,1481190941622,221180*936*1,2355,9579,23914,73316,464 B*78:011100005,58321,54226,4691,04910,02610,63922,90020921102158358159491475 B*81:012,86811,10920,02123,65100001,368438*1,4341,6835,007695*2,0842,8052,6219,52520,29322,345 B*82:0111,23613,36516,25318,4474,4429,96517,36020,6106,4622,5066,3817,5582,988442*1,2871,908898245772832 C*01:0251410737742700093007141171025862604623 C*02:021,351505*1,0581,0973883860852736254884967000013,3166,0236,86312,998 C*03:0200000007711,5265,98311,81113,03000007055141,4751,233 C*03:030000000010,9544,70510,05511,41500001,013729*2,0221,522 C*03:04202000009,7634,3029,35710,69100005714421,290935 C*04:0161082873555006252224240753500001080 C*05:01005211000072414378985400001807514 C*06:026001876700019273814276786800194052013078 C*07:02380130460000173554685641,11845*113*574*1,071521*1,8341,248
Supplemental Data Table S1. Continued (Continued to the next page)
A llele specificitySample 1Sample 2Sample 3Sample 4Sample 5 NaïveDilutionDTTEDTANaïveDilutionDTTEDTANaïveDilutionDTTEDTANaïveDilutionDTTEDTANaïveDilutionDTTEDTA C*08:011150151124000017039360000567125732544 C*12:03770110690009764012710800003304329 C*14:02520615900024570104132000000130 C*15:026701201200002407561467591,00069713420426100210 C*16:0147012558000144520105710002548236946686 C*17:01207253592998902978231,1848682971,3791,3711,06759*279*538*14,1227,5469,79114,438 C*18:0224088310002297501528238280015803608631 Beads exhibiting the prozone effect are bolded and underscored. *MFI value of bead was ≥1,000 in the naïve sample and decreased to <1,000 after serum treatment. Abbreviations: MFI, mean fluorescence intensity; SAB, single antigen bead; DTT, dithiothreitol.
Supplemental Data Table S1. Continued