3-Dimensional Numerical Analysis for Thermal Stratification in Surgeline in Nuclear Power Plant
(원전 밀림관 열성층의 3 차원 수치해석)
김영종†· 김만원* · 고은미*
Young-Jong Kim, Maan-Won Kim and Eunmi Ko
Key Words : Thermal stratification, Surgeline, Fluid-structure interaction, 3-D transient Analysis Abstract
A thermal stratification may occur in the horizontal parts of the surge line during operating transients of the pressurizer, which produces relatively high fatigue usage factor. Heat-up transient is the most severe case among the transient conditions. In this study, to study the relationship between the magnitude of thermal stratification and the length of vertical part of the surge line, some parametric fluid-structure interaction (FSI) analyses with different length variables of the vertical part of the surge line were performed for plant heat-up transient condition by using 3-dimensional numerical analysis. The conservativeness of the traditional finite element model for thermal stratification analysis based on the conservative assumption in the surge line was also discussed by comparison of the results of 3-dimensional transient FSI analysis of this study. Stresses calculated with 3-dimensional transient model were considerably reduced comparing with the traditional analysis.
1. INTRODUCTION
A thermal stratification occurs when two fluids with big temperature difference flow very slowly in a long horizontal pipe. It has been known that stratified flow could cause a big thermal gradient in the cross-section of horizontal pipes, so that makes the thermal stress as well as fatigue damage. The surge line has a relatively small margin against the environmental fatigue usage factor compared to other primary coolant pipes. Thermal stratification contributes to the increase in the secondary stress and fatigue usage factor. Thus, the existence of thermal stratification should be checked and assessment should be performed to confirm the safety during the whole plant lifetime in accordance with Bulletin 88-08 which is issued by USNRC in 1988 [1]. Especially assessment of thermal stratification is required by Bulletin 88-8 for the pressurizer surge line.
A lot of studies have been performed to reduce the thermal stratification in the surge line, but study about
the effect of the vertical length of the surge line on thermal stratification has not been found in the literature.
Therefore in this study we set the vertical pipe length of surge line as parametric variable and performed the full three-dimensional time transient fluid-structure interaction (FSI) analyses with FLUENT code [2].
Geometry and dimension of the Ulchin #5 and 6 surge line were used for the three-dimensional fluid-structure interaction analysis model.
In the traditional thermal stratification analysis of the surge line two-dimensional conservative model has been used, where temperature of the pressurizer has been applied to the top of the cross-section of the surge line and temperature of the hot leg to the bottom of the surge line. This condition leads very conservative results in the stress analysis. The actual temperature differences between top and bottom of the surge line section measured through the time transient temperature monitoring system have been reported much smaller than those calculated from the two-dimensional conservative model [3-4]. Thus, in addition to the effect of vertical length of the surge line, we calculated the quantitative magnitude of the conservativeness of traditional two- dimensional analysis comparing to three-dimensional analysis.
†
회원,
(주)지엔이씨 E-mail : [email protected]TEL : (042)863-4633 FAX : (042)863-4630
* (주)지엔이씨
대한기계학회 2008년도 추계학술대회 논문집
2. NUMERICAL MODEL FOR STRATIFIED FLOW IN SURGELINE
2.1 GEOMETRY AND BOUNDARY
CONDITIONS
Geometry used in the three dimensional transient FSI analysis in this study is shown in Fig. 1, which is taken from the design specification of the surge line of Ulchin Unit 5 and 6 [5]. Pipe material is SA-212 Type 347 stainless steel with 32.9 cm diameter and 3.33 cm thickness. Vertical pipe length adjacent to the pressurizer is 2.508 m and the other one adjacent to the hot leg is 2.06 m as depicted in the Fig. 1. The sum of these two values was assumed as a standard value marked with 1M for the purpose of comparison with each other: equal to one half (0.5M), twice (2M) and 3 times (3M) of vertical pipe length of the model 1M. Thus we have finally four analysis models marked with 0.5M, 1M, 2M and 4M, where 211988 ~ 336175 cells and 229108 ~ 362877 nodes were used for models depending on the vertical length of the pipe. In this problem thermal flow is unidirectional and sequential, in which thermal energy transferred from fluid to solid. We assumed that fluid is a water and solid is a stainless steel for material property input.
Fig. 1 Dimension used in analysis model (surge line of Ulchin unit 5 and 6)
Pressurizer heat-up event was chosen for the time transient analysis with total 27000 second transient time.
We considered only a outsurge flow that the flow surge
out from pressurizer to hot leg in the stratified flow condition. For the stratified flow case with outsurge flow, the transient begins with the fluid in the top half of the pipe at the temperature of pressurizer and that in the bottom half at the temperature of hot leg and no flow in either fluid. With outsurge flow, the fluid in the top half of the pipe instantaneously starts flowing at the indicated rate. This flow continues until thermal equilibrium is reached, then the flow stops.
Initial temperature of the fluid and solid region is assumed to 21.1℃. Time-temperature and time-flow curves shown in Fig. 2 were applied to the model as a boundary condition: dashed curve for the inlet fluid and wall cross-section face, and solid curve for the outlet solid cross-section face. The Neumann condition was applied to the outlet fluid face. Outside of the pipe wall was assumed to be adiabatic: . The operating internal pressure was assumed to be zero all through the heat-up transient to obtain a pure thermal stratification effect and whole material properties are assumed to be constant during the temperature variation.
=0
q
&2.2 ANALYSIS METHOD
For a cell based gradient field, FLUENT provides a discretization equation on a given cell as follows [2]:
∑
faces ⋅ =∑
facesΓ ∇ ⋅ +N
f
N
f
f n f
f f
f
v φ A
φφ A S
φV
ρ
r r ( ) r(1)
where N
facesmeans number of faces enclosing cell,
φ
fand A
rfmeans a value of φ convected through face f and area of face f, respectively. is the diffusion coefficient for
Γφ
φ . Left hand side term ρ
fv
r ⋅fA
rfis a mass flux through the face, right hand side terms
)n
(∇
φ is the magnitude of
∇φ normal to face f, and is a cell volume. The face value
V φ
fis computed by
using the second-order upwind scheme expressed as follows:
f
s
Δr
⋅
∇ +
=
φ φ
φ (2) In the Eq. (2), φ and
∇φ are the cell-centered value and its gradient in the upstream cell, and Δ s r is the displacement vector from the upstream cell centroid to the face centroid. The gradient
∇φ is computed in each cell using the divergence theorem. In this study we used the under-relaxation factor to reduce the change of
φ produced during each iteration: 0.3 for the pressure
term and 0.7 for the momentum. To adjust the solution
parameters, we used the PRESTO! scheme provided in
FLUENT 6 for the interpolation of the pressure values at
the faces, and the SIMPLE algorithm to enforce the mass conservation and to obtain the pressure field in the pressure-velocity coupling.
0 2 4 6 8
0 200 400 600 800
1.35hrs
100oF/hr
100oF/hr 1.85hrs
5.1hrs
70oF 120oF
653oF
333oF 440oF
563oF
Temperature (deg.F)
Time (hours) Bottom Region of Horizontal Pipe Top Region of Horizontal Pipe
0 2 4 6 8 10
0 1 2 3 4 5
(1.5 gpm)
Flow (gpm)
Time (hours) Inlet Flow
3 Fig. 2 Temperature and flow variation during the
heat-up transient
3. RESULTS AND DISCUSSION
Temperature differences between top and bottom of the pipe section at the locations shown in Fig. 3 were obtained from the simulation results for the full surge line model with time transient temperature and flow loading conditions. Fig. 4 ~ Fig.7 show the temperature differences at each location when the vertical pipe lengths vary from 0.5M to 4M. Here the unit of temperature is ℃.
In the figures 4 ~ 7, the maximum temperature difference occurred at the location 9A and the magnitude of temperature difference tends to be small as the measurement points are far from the inlet vertical pipe toward the outlet one. The temperature difference showed oscillation during the time transient and the maximum fluctuation of the temperature difference was appeared at the location 9A. The locations far from the inlet vertical pipe showed a low temperature difference and a small fluctuation compared with the locations near the inlet vertical pipe.
Fig. 3 Locations for temperature measurement from the simulation results
0.5M
0 5 10 15 20 25 30 35 40
1 3 5 7 9 11 13 15 17 19 21 23 25 27 Time (*1000 sec)
Temperature Difference (deg.
5A 5B 61A 61B 62A 62B 71A 71B 72A 72B 8A 8B 9A
Fig. 4 Variation of the temperature difference at each location in the model 0.5M
1M
0 5 10 15 20 25 30 35 40
1 3 5 7 9 11 13 15 17 19 21 23 25 27 Time (*1000 sec)
Temperature Difference (deg. 5A
5B 61A 61B 62A 62B 71A 71B 72A 72B 8A 8B 9A
Fig. 5 Variation of the temperature difference at each
location in the model 1M
2M
0 5 10 15 20 25 30 35 40 45 50
1 3 5 7 9 11 13 15 17 19 21 23 25 27 Time (*1000 sec)
Temperature Difference (deg.
5A 5B 61A 61B 62A 62B 71A 71B 72A 72B 8A 8B 9A
Fig. 6 Variation of the temperature difference at each location in the model 2M
4M
0 10 20 30 40 50 60
1 3 5 7 9 11 13 15 17 19 21 23 25 27 Time (*1000 sec)
Temperature Difference (deg.
5A 5B 61A 61B 62A 62B 71A 71B 72A 72B 8A 8B 9A
Fig. 7 Variation of the temperature difference at each location in the model 4M
As the total vertical pipe length is increased, the maximum temperature difference at the same location is slightly increased and the initiation time of the thermal stratification was delayed. While the maximum temperature difference in the 0.5M model is a similar level compared with 1M model’s as shown in Fig. 4 and Fig. 5, 0.5M model shows a very stiff and high temperature difference at the time section of the first stratification occurrence. It is shown that the slop of the first stratification curve becomes gentle as the vertical pipe length increases. When a low amount of flow exists, it is considered that the hot water can penetrate into the upper part of the cold water more easily in a pipe with a short vertical pipe than in a pipe with a long vertical pipe because the length of total flow is relatively short.
According to the References 3, 4 and 6, the measured temperature difference between top and bottom of the surge line was about 10~35℃. The temperature
difference in the three-dimensional transient analysis for 1M model, which has standard dimension for the surge line of Ulchin Unit 5 and 6 [5], is about 37℃.
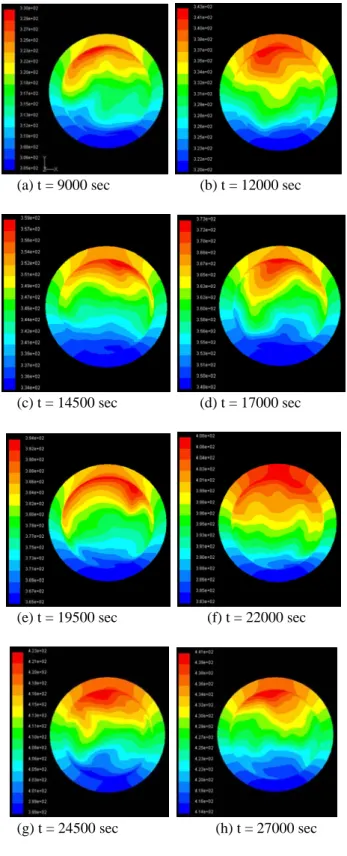
(a) t = 9000 sec (b) t = 12000 sec
(c) t = 14500 sec (d) t = 17000 sec
(e) t = 19500 sec (f) t = 22000 sec
(g) t = 24500 sec (h) t = 27000 sec Fig. 8 Temperature distribution on the section at the
location 9A according to the variation of the
time
UPPER REGION
LOWER REGION
H2, TH.L H1, TPZR
x y
INSULATION
Fig. 9 Boundary condition for 2-D thermal stratification analysis
Fig. 8 shows a stratified fluid at the section of the location 9A in the 1M model in accordance with time increase at regular intervals of 2500 seconds. For the 1M model, thermal stratification started when t is about 8000 second and maximum value (≈ 37℃) appeared at t = 26000 seconds.
Fig. 10 Finite element mesh for structural analysis
Table 1 Comparison of the bending moments calculated from 2-D and 3-D analysis results.
Generally, the fatigue usage factor of the surge line is comparatively higher than other primary coolant pipes because of its operating temperature and pressure transient. In particular, the thermal stratification cyclic load contributes to the rise of the fatigue usage factor during pressurizer heat-up and cool-down. We calculated the thermal stratification induced bending moments and axial forces, which are used in the stress analysis, for the three-dimensional thermal transient model and compared the results with the values obtained from the two- dimensional thermal model.
3-D transient analysis (in-kips)
2-D analysis [4]
(in-kips) Ratio Loca -
tion
Ma Mb Mc Mi Ma Mb Mc Mi Mi
1 -641 -230 761 1021 225 -2695 554 2761 0.37 2A -641 -137 1312 1466 233 -451 -2447 2499 0.59 2B -109 -669 -938 1157 439 280 -2387 2443 0.47 H1Y 109 747 -525 920 439 433 -2370 2449 0.38 5A 109 -560 764 954 439 2365 482 2453 0.39 5B 612 159 623 888 -2359 433 410 2433 0.36 61A -612 -335 804 1065 -2359 -418 707 2498 0.43 61B 198 665 916 1149 -1400 -1934 779 2511 0.46 62A -198 -616 -1188 1353 -1400 -1939 935 2568 0.53 62B -288 556 1217 1369 441 -2340 934 2558 0.54 H2Y 288 -1187 -519 1327 441 -879 -2333 2532 0.52 71A 288 -247 -1048 1115 441 -2363 600 2478 0.45 71B 358 81 -979 1045 1984 -1368 530 2468 0.42 H3Y 358 -859 147 942 1983 -412 -1376 2449 0.38 72A 358 -20 -722 806 1983 -1384 295 2436 0.33 72B -316 122 594 683 2383 421 195 2428 0.28 8A 316 686 342 829 2383 -410 563 2483 0.33 8B 813 439 -540 1070 416 2392 739 2538 0.42 9A -813 629 -786 1294 416 -545 2414 2509 0.52 9B 657 841 715 1284 468 455 2299 2390 0.54 10 657 -961 -4 1164 -483 2024 -947 2286 0.51
According to the Reference 7, the experimental data can be approximated by assuming that the total flow is confined to one half (upper or lower) of the pipe while the fluid in the other half (lower or upper) of the pipe is stationary. Thus the wall temperature is a function of the bulk fluid temperatures and heat transfer coefficients the fluid layers and the wall. This approach to treating stratified flow in a horizontal pipe is conservative relative to yielding the greatest circumferential temperature gradients and has been applied to the traditional two-dimensional thermal model for the surge line stress analysis.
In this study, we performed a thermal stress analysis with structural model which has a same dimension with the thermal transient model. In this analysis, the temperature on the inner surface of the pipe when t = 19769 seconds was applied as a temperature load in the structural model as shown in Fig.10. And then the axial forces and the bending moment were obtained at the locations defined in the Fig. 3.
5
The bending moments were compared with two- dimensional data taken from the Reference 5 in the Table 1. In the Table 1, the lower-case characters a, b and c represent an axial direction and its two orthogonal directions normal to the axial axis in the local rectangular coordinate system, respectively. And Mi is a square-root summation of three components of bending moment. All Mi ratio values are smaller than one. Thus, we can confirm that the two-dimensional analysis obviously yields an excessive conservative moments for the stress analysis of surge line heat-up event. It is clear that the conservativeness of the two-dimensional finite element model in the surge line could be reduced if the maximum temperature difference is used instead of the conservative two-dimensional thermal analysis assumption.
4. CONCLUSION
Three-dimensional transient analyses for the thermal stratification in the surge line have been performed with the three-dimensional fluid-wall models which have different vertical pipe length. As the vertical pipe length was increased, the maximum temperature difference also grew higher. The magnitude of temperature difference tended to be small as the measurement points are far from the inlet vertical pipe toward the outlet one.
Thermal temperature distribution obtained from fluid- wall model transient analysis was applied to the structural model to calculate the bending moments and the results were compared with those of the two- dimensional thermal model. The traditional two- dimensional thermal model led far more conservative results than the three-dimensional model.
REFERENCES