Spatial and Temporal Analysis Methods of Red Tide Using HABAS
Jong-chul Jeong
Department of Geoinformatics Engineering, Namseoul University, 21 Maeju-ri , Choongnam 330-800, Korea (Manuscript received 23 January 2007; accepted 15 February 2007)
HABAS를 이용한 적조의 시-공간분석기법
정 종 철
남서울대학교 지리정보시스템공학과 (2007년 1월 23일 접수, 2007년 2월 15일 승인)
요 약
본 연구의 목적은 한반도 연안해역에서 적조로부터 양식장을 보호하기 위한 연안환경모니터링시 스템을 구축하는데 있다. 1995년 이후 적조의 발생은 한반도 남부 연안해역에서 빈번하게 발생하고 넓게 확산되었다. 따라서 적조연구의 가장 중요한 점은 유해성적조의 발생 초기단계에 적조를 탐지 하는 것이다. 지리정보시스템 기술은 적조발생의 공간적, 시간적 변화를 분석하는데 필요한 적조모 니터링 시스템을 만드는데 적합하다. 유해성 적조 분석시스템 프로그램은 매일 매일의 적조 분포범 위, 적조 생물 종, 적조 밀도 등을 제공해준다. 우리는 유해성 적조분석프로그램을 이용하여 적조로 부터 양식장의 보호지역을 찾을 수 있다. 적조의 공간분석은 현장조사에 의한 참조자료를 바탕으로 수행되었다.
주요어 : 적조, HABAS, GIS, 공간분석
Corresponding Author: Jeong Jong Chul, Dep. Geoinformatics Eng. Namseoul Univ. E-mail: [email protected] 연구논문
I. Introduction
Korea has experienced 14 occurrences of red tide blooms within last 14 years from 1993 to 2006. Especially since 1995, HABs (Harmful Algal Blooms) have become more frequent and wide-
spread in whole coastal areas of the Korean South Sea and East Sea of Korean peninsula, spanning more than two months.
These HABs have eventually declined the health of marine ecosystem and environments, and have given a great damage of coastal fish-
eries and caused national problems of socio-eco- nomics. Thus it is necessary to know beforehand the characteristics of meteorological and oceano- graphic conditions, and the possibility of satellite monitoring and prediction for preventing disas- ters related to red tides. Therefore, an early HAB warning system is very necessary to mitigate serious economic loss of aquaculture industries.
Several studies pertaining to red tides have been carried out at the limited fields as taxono- my, physiology, ecology and molecular biology (lizuka and Mine, 1979), but they have not given full and satisfying answers. Recent investigations have studied the mechanisms causing red tides in the fields of physics, dynamics, remote sens- ing, and GIS (Jeong, 2003; Ahn et al., 2005).
In the fields, HAB monitoring was carried out by vessel cruising, patrolling coastal waterfront, aircraft observation and remote sensing. The dis- persion area of HABs was collected by vessel cruising and aircraft observation images (NFRDI, 2003, 2004, 2005, 2006).
The biological and chemical parameters of coastal water environment were monitored, including phytoplankton abundance, density, chlorophyll concentration, nutrients and physical parameters such as temperature, salinity, pH, water transparency and tidal currents. Meteorological data such as wind, precipitation, sun light inten- sity were analyzed for the dispersion of HABs (Kim, 2003). However, we need to make the more organized HAB information system for HAB database system and to develop the detec- tion algorithm using satellite data. The aim of this study is to analyze the temporal and spatial distribution aspects of HABs using HABAS (Harmful Algal Blooms Analysis System) pro- gram (Fig. 1.).
II. Method
In this study, we introduce the HABAS (devel- oped by Jeong, 2005), which is developed by visual basic 6.0, ArcGIS 9.1 and Mapobjects.
HABAS program shows the dispersion area, species and density of daily algal bloom from 1995 to 2005 in Korean waters. The damage caused by HABs takes place according to various aspects such as the species, concentration and spatial distribution of red tide plankton.
Therefore, in order to prevent the damage of red tide it is important to understand the distribution characteristics of red tide by each species accord- ing to time and space. In this perspective, we analyzed the area of early outbreak, frequency and spatial distribution and migration of red tide using HABAS program. The spatial data used for this study was constructed by digitizing from the red tide quick report of NFRDI (National Fisheries Research and Development Institute) and coupling with various attributes such as species, concentration and sea surface tempera- ture.
The ocean color sensor, such as SeaWiFs, OCM, MODIS were used for detection of HABs and compared with in-situ data collected by ves- Fig. 1. The HABAS main page (developed by Jeong, 2005)
sel cruising (Tyler, M. A. and R. P. Stumpf, 1989).
But, these satellite data have some problems because of inadequate spatial resolution and no appropriate algorithm has been developed for detecting the HABs from satellite data.
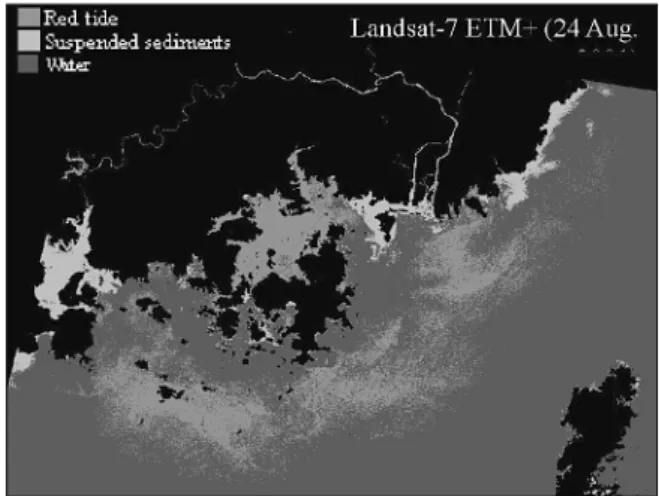
However, field survey monitoring was carried out by vessel cruising during the outbreak of HABs every year. We compared the area of HAB with detectable feature in the Landsat imagery, which means that the filament features of HABs are wider than 30 m. The Landsat satellite images of HABs were processed by 2-Dimension scatter plot analysis and displayed with HABAS program.
The study area of this research is the Korean South Sea and the temporal period is from 1995 to 2005. The remote sensing study of HABs detection has led to the derivation of the distribution maps for the Korean South Sea. Field data collected by NFRDI during different cruises were available on the NFRDI web site, and report and NFRDI field survey data were also essential to the production of maps of the HABs for Korean South Sea.
Advance warning of HABs increases the
options for managing these events. The HAB forecasting system provided by HABAS supplies information on the location, extent, and potential development or movement of algal blooms in coastal waters.
The forecasting system relies on satellite imagery, field observations, and buoy data and provides the large spatial scale and high frequen- cy of observations required assessing the bloom location and movements. Conditions are posted to this system everyday during the HAB season.
Additional analysis is included in the HABAS system that is provided to state and local resource managers in the region.
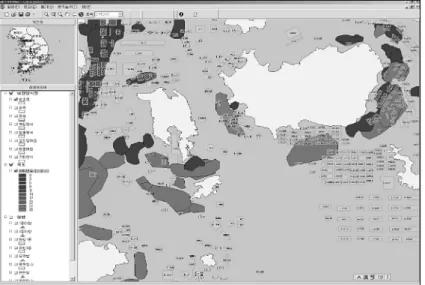
The HABAS is an interactive mapping tool that can be used to access recent data on HABs in coastal waters on the environmental conditions that may affect the spread of these blooms. This interactive mapping tool is powered by ESRI’s ArcGIS and users can use the tool to select data layers, zoom in and out of areas, pan around dif- ferent areas, query data by location and data type, and print custom maps (Fig. 2).
Fig. 2. The HABAS main structure and HAB distribution map display with more information such as water temp, cell number, Species, and fish farm site...
Map products for HABAS include HAB distri- bution map from field observations using research vessel (Fig. 3), geo-referenced HAB dis- tribution area derived from digital mapping method(Fig. 4) and estimated areas of HABs
from the satellite imagery (Fig. 5).
III. Results
The HABAS is an interactive searching system Fig. 3. The HABs distribution map from field observation data and display technique for
attribute data
Fig.4. The HABs sites of geo-referenced polygon were derived from red tide news and satellite data.
that can be used to access brief description of data layers, sea surface temperature (SST) images, cell counts, bathymetry contours. The cell counts results of the most recent in-situ sampling for red tide are obtained. The process of the derivation of map is described in detail in Fig. 6.
Available data layers are displayed within a folder structure. Folders can be opened and closed by clicking on them. The layers can be turned on and off in the map window using the check boxes, and the active layer can be chosen by clicking on the button. Different layers are
viewable at different scales. Legends for the lay- ers can also be viewed in this window by click- ing the toggle buttons.
This window shows the interactive HAB map, with selected layers. The legends for the HABs and red tide distribution area image are dis- played here. These functions play zooming the display to the selected state. These are the tools available for working within the application.
Three kinds of control options, such as directly mapping on the satellite image, overlay with HAB polygon, and searching species and cell Fig. 5. Detection of HABs from Landsat-7 ETM+ image of 24 August 2001 using Minimum
Spectral Distance Classification (MSD) technique (Ahn et al., 2006).
Fig. 6. The process of the derivation of map for HABAS
numbers of HABs are available in the HABAS system.
Recently blooms of C. polykrikoides are occurring more often and in more regions across the nation than ever before. These intense population explo- sions of algae can kill marine life, clog water- ways, and create conditions that impact human health. While algal blooms are a natural phenom- enon, it is believed that human activities, such as nutrient excess in runoff, may be triggering their increasingly common occurrence. Along the coast of the Southern part of Korea, the most common type of harmful algal bloom is the Cochlodinium polykrikoides.
The HABAS system is an interactive mapping tool that can be used to access recent data on HABs in the aquaculture site and on the environ- mental conditions that may affect the spread of these blooms. HABAS is an unique component of the red tide analysis system, responsible for mon- itoring water quality to manage aquaculture har- vesting areas that must be closed when harmful algae or other pollutants are present.
To ensure safe seafood, the local government and NFRDI work together to test aquaculture harvesting areas for the presence of red tide and to regulate harvesting. The coastline of Korean South Sea has hundreds of miles that are identi- fied as a suitable habitat for aquaculture. To effi- ciently allocate resources needed to monitor water quality, managers use the chlorophyll-a concentrations and plankton species provided by HABAS data. The information, including the interpreted image, the last-known position of the red tide bloom, and the speed and direction of local winds, is supported.
We used various spatial analysis methods such as union, intersect, tracking, buffer and spatial
interpolation for analyzing temporal and spatial characteristics of HABs. From the result of analy- sis methods, we could get the information on the spatial and temporal characteristics of red tide using HABAS.
A red tide bloom has been identified from Goheung province to Yosu Dolsan coast, these areas were affected by frequent HABs in 2002 and 2003, and most of red tide outbreaks took place from Dolsan coastal area. Chlorophyll data obtained from in-situ field survey were compared with the areas of daily HAB dispersion and over- laid on daily polygons (Yoon, Y. H., 2001).
Considering the oceanographic factors, the favorable conditions for the initiation of HABs are as follows; the calm weather increase sea water temperature, heavy precipitation brings some pollutants in river, nutrients and other chemical substances to the ocean area, low salini- ty, high suspended solid, low phosphorus and high nitrogen, respectively.
We determined the potential areas in the coastal zones vulnerable to the red tide occur- rence based on the oceanic parameters and fre- quency of HAB occurrence using HABAS. The representative criteria are selected with statistical analysis such as nutrients, sea surface tempera- ture and suspended solids in the study area. By using GIS technique, HABAS through the over- lap for three subject figures nitrogen, surface tem- perature and suspended solids, potential areas of red tide occurrence were obtained and compared with red tide occurrence polygons(Jeong, 2003, 2006).
IV. Conclusion
In the middle coastal area of the Korean South
Sea, the occurrence of HABs appeared and increased every year, enlarged from Yeosu to Goheung and concentrated in July, August, and September.
The spatial analysis of oceanographic factors and HABs occurrence polygons showed favor- able marine environmental conditions for the red tide blooms. In order to determine whether coastal managers are supplementing aquaculture harvesting areas, spatial analysis and field mea- surements data matching with HABAS will sup- port the spatial suitability of aquaculture sites.
To establish a database system with a Geographic Information System, HABAS enables efficient compilation of relevant data and information on red tides blooms in Korea. This system not only streamlines recording of all data on red tide monitoring and investigation, but also enables near real time visualization of spatial and tempo- ral distribution of red tide near future. It there- fore enables faster and more accurate risk assess- ment as well as facilitates prompt early warning to marine culturists and communication amongst concerned departments during red tide out- breaks. In addition, the system also enables faster response to enquiries and retrospective analysis of trends and relationships of red tide outbreaks with environmental changes which are important in further improving the effectiveness of red tide management.
Reference
Ahn, Y. H., Shanmugam, P., Ryu, J. H., and Jeong, J.
C., 2006, Satellite detection of harmful algal bloom occurrences in Korean waters, Harmful Algae., 21, 234-243. .
Iizuka, S. and Mine, K., 1979, Maximum growth rate of Gymnodinium sp. (Type- ’65), a red tide dinoflagellate, expected under culture condition.
Kim, H. G., 2003, Korean Red Tide Monitoring and Prediction system, workshop on red tide monitoring in Asian Coastal Waters, University of Tokyo, p. 6.
Jeong, J. C., 2003, Study on a GIS Database of Red Tide Information System, The Journal of geographic information system association of Korea, 12, 263-274.
Jeong, J. C., 2006, The Assessment of Coastal Water Quality Grade Using GIS, J, of Environment Impact Assessment, 15, 234-242.
NFRDI, 2003, Harmful algal blooms in Korean coastal waters in 2002 Report. pp.17-182
NFRDI, 2004, Harmful algal blooms in Korean coastal waters in 2003, Report, pp.12-27.
NFRDI, 2005, Harmful algal blooms in Korean coastal waters in 2004. Report, pp.20-34.
Tester, P. A., Stumpf, R. P., F. M. Vukovich, P. K.
Flower, and J. T. Turner, 1991, An expatriate red tide bloom: transport, distribution, and persistence, Limnol. Ocenaogr., 36, 1053-1061.
Tyler, M. A. and R. P. Stumpf, 1989, Feasibility of using satellite for detection of kinetics of small phytoplankton blooms in estuaries: tidal and migrational effects, Remote Sens. Environ., 27, 233-250.
Yoon, Y. H., 2001, A summary on the red tide mechanisms of the harmful dinoflagellate.
Cochlodinium polykrikoides in Korean coastal waterts, Bull. Plankton Soc. Japan, 48(2), 113-120.
최종원고채택 07. 02. 22