The Intensification of Walker Circulation over the Past 15 Years from 1999 and Its Relation to TC Activity in the Western North Pacific
Jae-Won Choi*, Yumi Cha, and Jeoung-Yun Kim
Research Planning and Management Division/National Institute of Meteorological Sciences, Jeju, Korea
Abstract: The time-series of Walker circulation index (WCI) in this study shows the strengthening of the Walker circulation in recent years. To further understand the large-scale features related to the WCI strengthening, a difference between the averaged meteorological variables in two time periods 1999-2013 and 1984-1998 is analyzed. The difference in 850 hPa stream flows between the two periods shows that the anomalous easterlies (anomalous trade wind) are dominant due to the strengthening of anomalous anticyclonic circulations at the subtropical Pacific of both hemispheres.
The difference between the averaged zonal atmospheric circulations over 5oS-5oN in the two periods confirms that upward flows are strengthened at the tropical western Pacific and downward flows are strengthened at the tropical central and eastern Pacific in recent years. It matches the WCI strengthening in recent years. The time-series of tropical cyclone (TC) genesis frequency from July to September shows that a mean TC genesis frequency from 1999-2013 decreases compared to that of the time period 1984-1998. The monsoon trough in the period 1984-1998 was located in the further east direction and stronger than that in the period 1999-2013. TCs in the recent period that are generated in further west than TCs in the past period moved from the west. Thus, the TC intensity along the coasts in East Asia becomes weaker in recent period. The intensification of Walker circulation in recent years is related to the weaker TC intensity in East Asia through strengthened anomalous anticyclones at the subtropical western Pacific.
Keywords: Walker circulation index, equatorial western Pacific, equatorial central and eastern Pacific, tropical cyclone
1. Introduction
The Walker circulation is one of the most globally distinctive and important atmospheric systems. The circulation has the following characteristics. (1) Trade winds blown from the east to the west, (2) streng- thening of ascending air current in the western Pacific, Southeast Asia, and northern Australia through strengthened convection, (3) strengthening ascending air currents in the western Pacific through trade winds, and (4) strengthening descending air currents in the eastern Pacific (see, e.g., Gill, 1982).
Changes in the Walker circulation are related to important changes in rainfall (Ropelewski and Halpert,
1989; Allan et al., 1996; Power et al., 1999), river flow (Kahya and Dracup, 1993; Merendo, 1995;
Power et al., 1999), agricultural production (Phillips et al., 1998; Hammer et al., 2000; Power et al., 1999), ecosystems (Holmgren et al., 2001), severe weather (e.g., Callaghan and Power, 2011), and disease (Nicholls, 1993; Bouma and Dye, 1997). Furthermore, interdecadal changes in the Walker circulation are also related to El Niño-Southern Oscillation (ENSO) that causes important changes in monsoonal circulations and rainfall in neighboring nations (e.g. Philander, 1990; Kumar et al., 1999; Krishnamurthy and Goswami, 2000; Lu et al., 2004). The intensity of equatorial Pacific zonal wind-stress that is related to the Walker circulation crucially influences equatorial Pacific Ocean circulation (e.g. Vecchi and Soden, 2007).
During the 20th century, much attention has been paid to the weakening trend in the Walker circulation (Tanaka et al., 2004; Vecchi et al., 2006; Zhang and Song, 2006). The weakening trend is caused by the anthropogenic climate change and can be understood through energy and mass balance of the ascending
*Corresponding author: [email protected]
*Tel:
*Fax:
This is an Open-Access article distributed under the terms of the Creative Commons Attribution Non-Commercial License (http://
creativecommons.org/licenses/by-nc/3.0) which permits unrestricted non-commercial use, distribution, and reproduction in any medium, provided the original work is properly cited.
branch in the circulation (Held and Soden, 2006;
Vecchi et al., 2006). On the contrary, several studies in recent years explained differently (Karnauskas et al., 2009; Sohn and Park, 2010; Meng et al., 2012). In particular, Sohn and Park (2010) analyzed the water vapor transport and described strengthening of tropical circulation during the past three decades. However, a number of atmospheric and oceanic processes control the intensity of the Walker circulation including a tropical hydrological cycle about radiative forcing that explains partially the opposite result (DiNezio et al., 2010).
Furthermore, Vecchi et al. (2006) demonstrated that large interdecadal variability can be superimposed on the long-term weakening trend. The interdecadal variability can be opposite to signals caused by anthropogenic greenhouse gas forcing during the limited period of time and can incur considerable changes in convection and ocean circulation. The success and forced climate change in prediction of both interdecadal climate variabilities are crucially important to understand not only long-term trend but also interdecadal variability.
The interdecadal shift of climates in the Pacific Ocean in the late 1990s has been confirmed via a number of recent studies (e.g. Cummins et al., 2005;
Burgman et al., 2008; Chen et al., 2008; Wang and Mehta, 2008). Cummins et al. (2005) demonstrated rapid warming in the North Pacific and increases in sea surface height in 1998 in contrast to changes occurred in the climate shift in the mid-1970s, which was accompanied via changes in Interdecadal Pacific Oscillation (IPO; Power et al., 1999) from the negative phase to positive phase. Burgman et al. (2008) and Chen et al. (2008) proved that the interdecadal regime shift of the sea surface temperature pattern in the late 1990s was an opposite pattern to signals related to well-known climate shift in the mid-1970s. Wang and Mehta (2008) reported rapid warming in the western Pacific warming pool since the late 1990s. However, none of the above studies have focused on inter- decadal changes in the tropical zonal circulation.
In general, a climate regime is divided into 1961- 1974, 1977-1997, and after 1999. A climate shift
occurred around 1976/77 is reflected for a difference between former two periods (e.g. Nitta and Yamada, 1989) while the most recent interdecadal change since 1990s is reflected for a difference between the latter two periods (Chen et al., 2008; Burgman et al., 2008;
Wang and Mehta, 2008). Furthermore, the simulation of the atmospheric general circulation model (AGCM) evaluated a role of imposed IPO sea surface temperature anomalies at the rapid transition of the zonal over- turning circulation in the tropics (Zhang et al., 2011).
For the tropical cyclone (TC) activity, Lander (1994), Yumoto and Matsuura (2001), and Matsuura et al.
(2003) noted in common that the annual frequency of TCs in the western North Pacific is high in the 1960s, low in the 1970s, and again high in the 1980s with a gradual increasing trend.
In this paper, we first discuss a climate regime shift in the Walker circulation in Section 3 and present the differences between atmospheric circulations and western North Pacific TC activity related to the climate shift in Section 4. In Section 5, the results are summarized.
2. Data and Methods
2.1. Data
The TC data used in this study is the TC best-track data set provided by the Regional Specialized Meteo- rological Center (RSMC)-Tokyo Typhoon Center. This data includes TC name, latitude and longitude location of TC, TC central pressure, and TC Maximum Sustained Wind Speed (MSWS), which were observed every 6 hours for 30 years from 1984 to 2013. TC is generally classified into the following four categories according to the MSWS criteria: Tropical Depression (TD, MSWS < 17 m s
−1), Tropical Storm (TS, 17 m s
−1≤ MSWS ≤ 24 m s
1), Severe Tropical Storm (STS, 25
m s
−1≤ MSWS ≤ 32 m s
−1), Typhoon (TY, MSWS ≥ 33
m s
−1). Along with the four classes of TC above, this
study includes extratropical cyclone, which was trans-
formed from TC for analysis. This is because such
extratropical cyclones also incurred great damage on
property and human life in the mid-latitude regions in
East Asia.
This study also uses the variables of geopotential height, zonal and meridional winds, specific humidity, air temperature, sea level pressure, velocity potential, and interpolated Outgoing Longwave Radiation (OLR) data from National Centers for Environmental Prediction- National Center for Atmospheric Research (NCEP- NCAR) reanalysis in 1984 to 2013 (Kalnay et al., 1996; Kistler et al., 2001). This NCEP-NCAR reanalysis data comprises spatial resolution such as 2.5
ο×2.5
οlatitude-longitude and 17 vertical levels (specific humidity is 16 vertical levels and sea level pressure is one vertical level).
The NOAA Extended Reconstructed monthly Sea Surface Temperature (SST) (Reynolds et al., 2002), available from the same organization, is also used.
The data have a horizontal resolution of 2.0
ο×2.0
οlatitude-longitude and are available for the period of 1854 to present day.
In addition, the Climate Prediction Center (CPC) Merged Analysis of Precipitation (CMAP) data (Xie and Arkin, 1997), the horizontal spatial resolution of which is the same as the NCEP-NCAR reanalysis dataset. This data is based on the monthly average and is available from 1979 to present day. The CMAP data, which is global precipitation data that covers the ocean, are derived by merging rain gauge observations, five different satellite estimates, and numerical model outputs.
2.2. Methods
The index of the Walker circulation (WCI) and the passage and genesis frequencies of TC are calculated in the following ways. The WCI is defined to the difference of sea level pressure averaged over the eastern (5
οS-5
οN, 160
οW-80
οW) and western (5
οS-5°N, 80
οE-160
οE) equatorial Pacific Ocean (Vecchi et al., 2006; Vecchi and Soden, 2007). Each TC is calculated after being relocated within a 5
ο×5
οgrid. Even if a TC passes over the same grid multiple times, it is regarded as a single passage. TC genesis frequencies are also calculated in the same way. The season from July to September is of main interest in this study.
Niño-3.4 index is derived by Climate Prediction Center (CPC) of NOAA (http://www.cpc.noaa.gov/
products/analysis_monitoring/ensostuff/ensoyears.shtml).
This study uses the Student’s t test to determine significance (Wilks, 1995). In the case in which two independent time series follow a t distribution and their time averages are denoted as and , respectively, the test statistic is given by
,
where, S
1and S
2are standard deviations, and n
1and n
2are numbers of the two time series, respectively.
From the above formula, if the absolute value of t is greater than threshold values with a level of significance, the null hypothesis would be rejected at the α(×100)% significance level.
3. Time Series Analysis
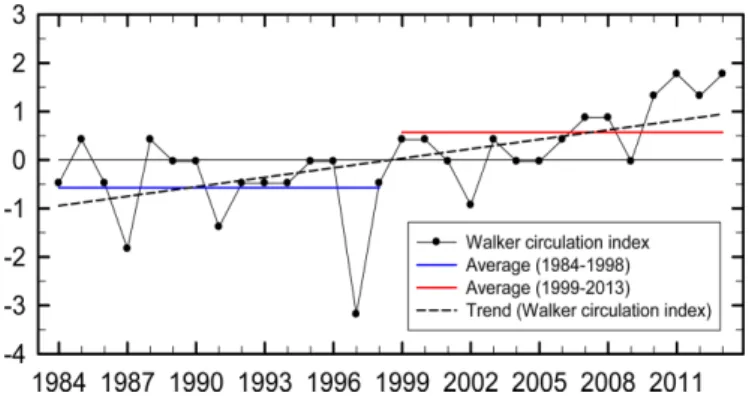
Figure 1 shows the time-series of the Walker circulation index (WCI). This figure shows an increasing trend overall and this increasing trend is statistically significant at the 95% confidence level.
This figure implies that upward flows are strengthened in the tropical western Pacific and downward flows in the tropical central and eastern Pacific. It also shows that many of the prior years of 1998 have negative values whereas many of the years after 1998 have positive values. A mean value of 1984-1998 is -0.58 whereas a mean value of 1999-2013 is 0.58. A difference in mean values between two periods is significant at the 95% confidence level. Accordingly, a difference between mean values between in 1999-2013 and 1984-1998 periods is analyzed in order to determine the cause of the increase in the WCI in recent years.
4. Differences between 1999-2013 and 1984-1998
4.1. Large-scale environments
The present study analyzes OLR to see the
x
1x
2t x
1– x
2s
12⁄ n
1+ s
22⁄ n
2( )
1 2⁄---
=
difference of convective activity between two periods (Fig. 2a). Positive anomalies are strengthened from the equatorial eastern Pacific to the equatorial central Pacific and negative anomalies are strengthened in the Maritime Continent and the subtropical western North Pacific. This result means that convection is not
developed in the former regions whereas convection is developed in the latter regions. As a result, negative anomalies are revealed in the former regions while positive anomalies are located in the latter regions with regard to difference in precipitation between two periods (Fig. 2b).
Fig. 1. Time series of Walker circulation index (solid line and with a closed circle) and its trend (thick dashed line) in July-Sep- tember.
Fig. 2. Differences in (a) outgoing longwave radiation (OLR) and (b) precipitation in July-September between 1999-2013 and 1984-1998.
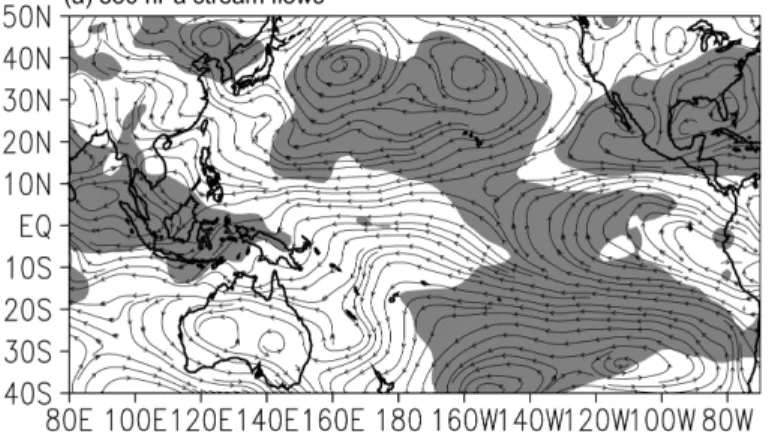
Differences between 850 hPa stream flows in two periods are also analyzed to find out the reason for the spatial distribution of the precipitation differences between the two periods (Fig. 3a). As anomalous anticyclonic circulations are strengthened in the both
hemispheres, anomalous easterlies (anomalous trade winds) are strengthened along the equatorial Pacific.
This is a typical anomalous atmospheric circulation pattern displayed at La Niña events. Thus, convection can become weak from the equatorial eastern Pacific
Fig. 3. Same as in Fig. 2, but for (a) 850 hPa stream flows and (b) 200 hPa stream flows. Shaded areas are significant at the 95% confidence level.Fig. 4. Same as in Fig. 2, but for sea surface temperature (SST).
to the equatorial central Pacific while convection can become strengthened in the Maritime Continent and the subtropical western North Pacific.
Anomalous cyclonic circulations are strengthened in the subtropical Pacific in the both hemispheres in the analysis on differences between 200 hPa stream flows in the two periods and anomalous northerlies blown from the anomalous cyclonic circulations in the Southern Hemisphere are blown into the anomalous cyclonic circulations in the Northern Hemisphere (Fig.
3b).
A difference in the SST between two periods is analyzed to determine whether the above results of differences between two periods actually reveal the La Niña pattern (Fig. 4). Cold anomalies are exhibited from the equatorial eastern Pacific to the equatorial central Pacific whereas warm anomalies are exhibited in the other waters. This is a spatial distribution of the typical SST displayed in La Niña events, which implies that La Niña pattern has been strengthened in recent years.
In order to determine whether upward flows are strengthened in the tropical western Pacific and downward flows are strengthened in the tropical central and eastern Pacific in recent years, a difference in zonal atmospheric circulation averaged over 5
οS- 5
οN between two periods is analyzed (Fig. 5a). The result shows that anomalous upward flows are strengthened in western regions of 170°E whereas anomalous downward flows are strengthened in eastern regions of 170
οE. That is, the Walker circulation, in which air ascends in the equatorial western Pacific descends in the equatorial central and eastern Pacific, is strengthened more in recent years.
All layers in the western regions of 170
οE reveal positive anomalies in specific humidity whereas most of the layers show negative anomalies in the eastern regions of 170°E (Fig. 5b).
Warm anomalies are revealed at all layers in the western regions of 170
οE whereas cold anomalies are revealed at the lower layer and warm anomalies at the upper layer in the eastern regions of 170°E, showing thermally stable atmospheric conditions (Fig. 5c).
In order to determine whether the recent streng- thening of the Walker circulation is related to La Niña patterns, time series of the WCI and the Niño-3.4 index are analyzed (Fig. 6a). In the Niño-3.4 index, a distinctive trend is not shown. However, two time
Fig. 5. Composite differences of longitude-pressure cross section of (a) vertical velocity (contours) and zonal circula- tions (vectors), (b) specific humidity, and (c) air temperature averaged along 5oS-5oN between 1999-2013 and 1984-1998 in July-September. The values of vertical velocity are multi- plied by 100. Bold arrows and shaded areas are significant at the 90% confidence level. Contour intervals are 1−2h Pa s−1 for vertical velocity, 0.5 g kg−1 for specific humidity, and 0.3oC for air temperature, respectively.
series show a clear out-of-phase and have a high negative correlation (-0.67) between two variables.
This correlation is statistically significant at the 99%
confidence level. This result means that as the Walker circulation becomes stronger (weaker), the SST will be lower (higher) in the Niño-3.4 region.
We also analyze time series of 850 hPa zonal wind averaged over the Niño-4 region and the WCI (Fig.
6b). 850 hPa zonal wind is a normalized value. The reason for the use of 850 hPa zonal wind in the Niño- 4 region rather than the Niño-3.4 region is because the Niño-4 region shows more apparent anomalous easterlies than the Niño-3.4 region in the previous analysis. The 850 hPa zonal wind index shows a decreasing trend and this decreasing trend is significant at the 90% confidence level. The two time series show a clear out-of-phase and had a high negative correlation (−0.83) between two variables. This correlation is statistically significant at the 99%
confidence level. This result means that as the Walker circulation becomes stronger (weaker), 850 hPa
easterlies will be stronger (weaker) in the Niño-4 region.
We also analyze time series of 200 hPa zonal wind averaged over the Niño-4 region and the WCI (Fig.
6c). 200 hPa zonal wind is a normalized value. The reason for the use of 200 hPa zonal wind in the Niño- 4 region rather than the Niño-3.4 region is because the Niño-4 region shows more distinctive anomalous westerlies than the Niño-3.4 region in the previous analysis. The 200 hPa zonal wind index shows an increasing trend and this increasing trend is significant at the 95% confidence level. The two time series show a clear in-phase and have a high positive correlation (0.76) between two variables. This correlation is statistically significant at the 99% confidence level.
This result means that as the Walker circulation becomes stronger (weaker), 200 hPa westerlies will be stronger (weaker) in the Niño-4 region.
We also investigate whether other indices (Niño-3.4
index, 850 hPa zonal wind index, 200 hPa zonal wind
index) related to the WCI reveal interdecadal variation
Fig. 6. Time series of Walker circulation index and (a) Niño-3.4 index, (b) 850 hPa zonal wind averaged over Niño-4 region (5oS-5oN, 160oE-150oW), and (c) 200 hPa zonal wind averaged over Niño-4 region and their trends in July-September.(Fig. 7). For the Niño-3.4 index, a mean value during 1984-1998 is 0.12 whereas that of 1999-2013 is -0.12.
Here, a difference of the mean values between two periods is statistically significant at the 85% confidence level (Fig. 7a). The 850 hPa zonal wind index averaged over the Niño-4 region during 1984-1998 is 0.35 whereas that of 1999-2013 is −0.35. A difference of the mean values between two periods is statistically significant at the 90% confidence level (Fig. 7b). The 200 hPa zonal wind index averaged over the Niño-4 region during 1984-1998 is −0.38 whereas that of 1999-2013 is 0.38. A difference of the mean values between two periods is statistically significant at the 90% confidence level (Fig. 7c). Thus, all three indices related to the WCI show interdecadal variation from the late 1990s.
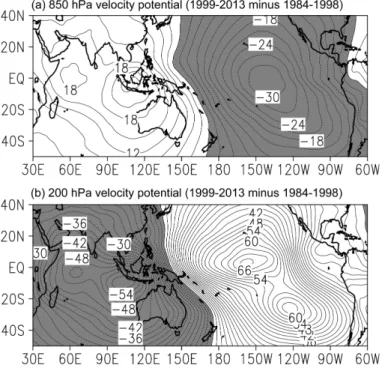
Differences in 850 hPa velocity potential and 200 hPa velocity potential between two periods are analyzed to find out the characteristics of the differences in global-scale atmospheric circulation between two periods (Fig. 8). Positive anomalies of 850 hPa
velocity potential are revealed in the western region of 150
oE while negative anomalies are revealed in the eastern region (Fig. 8a). The center of the positive anomalies is located in the Maritime Continent and the center of the negative anomalies is located in the equatorial central Pacific. 200 hPa velocity potential shows an opposite pattern of spatial distribution compared to that of 850 hPa velocity potential (Fig.
8b). The center of the negative anomalies is located in the western coast in the Maritime Continent and the center of the positive anomalies is located in the equatorial central Pacific. The spatial distribution anomalies of velocity potential at the upper and lower tropospheres means that the Walker circulation in which air rises over the Maritime Continent and moves to the east and then descends down in the equatorial central Pacific, has been more strengthened than before in recent years.
4.2. TC activity
As a typical weather phenomenon in the summer
Fig. 7. Interdecadal variation of (a) Niño-3.4 index, (b) 850 hPa zonal wind averaged over Niño-4 region (5oS-5oN, 160oE- 150oW), (c) 200 hPa zonal wind averaged over Niño-4 region.season, TC activity can be found. Thus, this study investigates the effect of the recent strengthening of the Walker circulation on TC activity and the causes are analyzed.
Figure 9 shows a time series of TC genesis frequency during July to September. The figure shows that the time series reveal a decreasing trend overall and this decreasing trend is statistically significant at the 90% confidence level. A mean value of TC genesis frequency during 1984-1998 is 16.3 whereas
that of 1999-2013 is 14.0. A difference between two periods is statistically significant at the 90% confidence level.
We also analyze a spatial distribution of TC genesis frequency between two periods (Fig. 10a). Overall, TCs during the 1999-2013 period are generated in the further west than those of TCs during the 1984-1998 period. This characteristic can be verified via the analysis on the mean TC genesis locations between two periods. A mean TC genesis location in the 1999-
Fig. 8. Same as in Fig. 2., but for (a) 850 hPa velocity potential and (b) 200 hPa velocity potential. Shaded areas denote nega- tive anomalies. Contour interval is 3 m2 s−1 10−6.Fig. 9. Tropical cyclone (TC) genesis frequency (solid line with a closed circle) and its trend (thick dashed line) in July-Sep- tember.
2013 period is 15.5
οN and 136.0
οE whereas that in the 1984-1998 period is 15.1
οN and 145.4
οE, which shows TCs in the 1999-2013 are generated in the further west location than those in the 1984-1998 period.
Here, the difference in latitudes of TC genesis locations between two periods is not statistical significant but the difference in longitude is significant at the 95%
confidence level.
The difference in spatial distribution of TC passage frequency between two periods also shows that TCs in the 1999-2013 period are moved from further west locations than TCs in the 1984-1998 period (Fig. 10b).
TCs in the 1999-2013 tend to move from the northeast seas of the Philippines via the East China Sea towards Korea and Japan whereas TCs in the 1984-1998 period tend to move from the far southeast seas of the Philippines towards the far east seas of Japan. In general, TCs are characterized by moving along the western periphery of the western North Pacific subtropical high (WNPSH) (Wang and Chan, 2002; Choi et al. 2009; Hwang et al, 2010; Choi and Kim, 2011). The WNPSH in the 1999-2013 period (solid line) is developed in the further west than the WNPSH in the 1984-1998 period (dashed line). That is, TCs in the 1999-2013 period are generated in further west locations and moved in the west further than TCs in the 1984-1998 period. This is because anomalous anticyclones are strengthened in the subtropical western Pacific due to the strengthening of the Walker circulation in recent years as analyzed in the above.
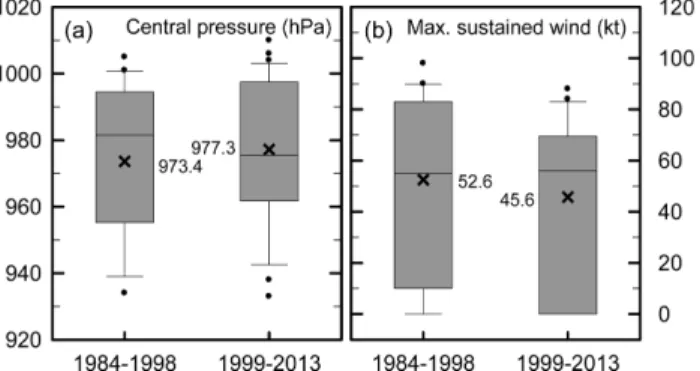
TC genesis location and TC track can influence TC intensity. Thus, TC intensity between two periods is analyzed (Fig. 11). Here, TC intensity is defined as the TC lowest central pressure (Fig. 11a) and the maximum sustained wind speed (Fig. 11b) displayed during the TC lifetime in the 6-hour interval RSMC- Tokyo best-track data. Overall, TC intensity during the 1999-2013 period is weaker than that of the 1984- 1998 period. This can be verified from the analysis result of TC genesis location and TC track between two periods. TCs in the 1999-2013 period can be affected by the topography thereby reducing the TC intensity while TCs are generated at the east sea of the Philippine and moved to Korea and Japan via the East China Sea whereas TCs in the 1984-1998 period are not affected by the topography and acquire sufficient energy from the sea thereby increasing the TC intensity while TCs are generated at the far east sea of the Philippine and moved toward the far east sea of Japan. This result is similar to the study result by Wang and Chan (2002) that proved that TC intensity became stronger as TCs were generated in the far east seas of the Philippine.
To determine why TC genesis frequency is higher
Fig. 10. Differences in the (a) mean TC genesis frequen-cies and (b) mean TC passage frequencies between 1999- 2013 and 1984-1998 in July-September within each 5o×5o latitude-longitude grid box. Solid and dashed lines denote 5,880 gpm contours for 1999-2013 and 1984-1998, respec- tively. Small solid rectangless indicate that the differences are significant at the 95% confidence level.
in recent years, 850 hPa stream flows between two periods are analyzed (Fig. 12). Generally, TCs tend to generate in the monsoon trough (Wang and Chan, 2002). The monsoon trough during the 1999-2013 period is advanced up to 140°E whereas that during the 1984-1998 is advanced up to 160°E, which is advanced to the east further. Thus, TCs were more generated in the 1984-1998 period in which the monsoon trough is developed in further east locations.
This is because anomalous anticyclones are strengthened in the subtropical western Pacific due to the streng- thening of the Walker circulation in recent years as analyzed in the above.
To investigate the reason why TCs developed in the 1999-2013 period are moved to the west further, differences in weight-averaged deep-layer mean flows from 850 to 300 hPa between two periods is analyzed (Fig. 13). Anomalous anticyclonic circulation is strengthened in most of the analyzed regions. This is because the Walker circulation is strengthened in recent years as analyzed in the above. In particular, anomalous southerlies are apparent in coastal areas in East Asia. Therefore, TCs in the 1999-2013, which are generated in the eastern coasts in the Philippine, move toward Korea and Japan via the East China Sea.
5. Summary and Conclusion
The Walker circulation index calculated in this
Fig. 11. TC (a) lowest central pressure and (b) maximum sustained wind speed. The boxes show the 25th and 75th percentiles, the lines in the boxes mark the median and the circles are values below (above) the 25th (75th) percentiles of distribution. The numbers to the right and left sides of the figure represent average values (cross marks) for 1984-1998 and 1999-2013, respec- tively.Fig. 12. 850 streamline in composites of (a) 1999-2013 and (b) 1984-1998. This analysis area is for the pattern analysis of TC genesis and TC track.
study shows the strengthening of the circulation in recent years. We therefore suggested the comparison analysis in time-averaged meteorological variables in the two periods of 1999-2013 and 1984-1998 to determine the cause of the strengthening of the Walker circulation in recent years.
The spatial distribution of precipitation differences in the two periods showed negative anomalies in the equatorial central and eastern Pacific and positive anomalies in the Maritime Continent and subtropical western North Pacific. This is a typical La Niña pattern. In differences between 850 hPa stream flows, due to the strengthening of the anomalous anticyclonic circulations in the subtropical Pacific in the both hemispheres, anomalous easterlies (anomalous trade winds) were shown in the equatorial Pacific. At the same time, differences between 200 hPa stream flows showed that anomalous cyclonic circulations were strengthened in the subtropical Pacific in both hemispheres. Differences in 850 and 200 hPa velocity potentials between the two periods also showed that the Walker circulation was strengthened further in recent years.
In order to determine whether upward flows are strengthened in the tropical western Pacific and
downward flows are strengthened in the tropical central and eastern Pacific in recent years, a difference between zonal atmospheric circulation averaged over 5
oS-5
oN in the two periods was analyzed. The Walker circulation, in which air ascends in the equatorial western Pacific descends in the equatorial central and eastern Pacific, was strengthened in recent years.
High correlations of the WCI with Niño-3.4 index, 850 hPa zonal wind averaged over the Niño-4 region, and 200 hPa zonal wind averaged over the Niño-4 region showed that the strengthening of the Walker circulation in recent years is related to the La Niña pattern. The WCI is negatively correlated with Niño- 3.4 index and 850 hPa zonal wind averaged over the Niño-4 region while it is positively correlated with 200 hPa zonal wind averaged over the Niño-4 region.
We also found that other WCI-related indices such as Niño-3.4 index, 850 hPa zonal wind index, 200 hPa zonal wind index showed distinctive interdecadal variation from the late 1990s.
The time-series of tropical cyclone (TC) genesis frequency during July to September showed that a mean TC genesis frequency in the recent period was lower than that in the past period. This is because the monsoon trough in the past period was strengthened in the further east direction than that in the recent period. TCs in the recent period were generated at further west than those in the past period and moved from the west. Thus, the intensity of TCs in the recent period that moved along the coasts in East Asia became weaker than that in the past period. This is because anomalous anticyclones were strengthened in the subtropical western Pacific due to the streng- thening of the Walker circulation in recent years as analyzed in the above.
The strengthening of the recent anomalous anticyclone was verified through the analysis of deep-layer mean flow differences, which were weight-averaged from 850 to 300 hPa, between two periods (George and Gray, 1976; Chan and Gray, 1982; Velden and Leslie, 1991). Anomalous anticyclonic circulations were strengthened in most of the analysis area. In particular, anomalous southerlies were apparent in the coastal
Fig. 13. Same as in Fig. 2, but for deep layer mean flowweightily averaged from 850 to 300 hPa. Shaded areas are significant at the 95% confidence level. This analysis area is for the pattern analysis of TC genesis and TC track.
areas in East Asia. Therefore, the weaker TCs in the recent period, which were generated in the eastern coasts in the Philippine, could be moved toward Korea and Japan via the East China Sea.
Acknowledgments
This work was supported by the R&D Project of the Korea Meteorological Administration “Development and application of technology for weather forecast”.
References
Allan, R.J., Lindesay, J., and Parker D.E., 1996, El Niño:
Southern Oscillation and Climatic Variability. CSIRO Publishing, 405 pp.
Bouma, M.J. and Dye, C., 1997, Cycles of malaria associated with El Niño in Venezuela. Journal of American Medicine Association, 278, 1772-1774.
Burgman, R.J., Clement, A.C., Mitas, C.M., Chen, J., and Esslinger, K., 2008, Evidence for atmospheric variability over the Pacific on decadal timescales. Geophysical Research Letters, 35, L01704, doi:10.1029/
2007GL031830.
Callaghan, J. and Power, S.B., 2011, Variability and decline in the number of severe tropical cyclones making land- fall over eastern Australia since the late nineteenth century. Climate Dynamic, 37, 647-662, doi:10.1007/
s00382-010-0883-2.
Chan, J.C.L., Gray, W.M., 1982, Tropical cyclone movement and surrounding flow relationships. Monthly Weather Review, 110, 1354-1374.
Chen, J., Del Genio, A.D., Carlson, B.E., and Bosilovich, M.G., 2008, The spatiotemporal structure of twentieth- century climate variations in observations and reanalyses. Part II: Pacific Pan-decadal variability.
Journal of Climate, 21, 2634-2650.
Choi, K.S., Kang, K., Kim, D.W., Hwang, H.S., and Lee, S.R., 2009, A study on the characteristics of tropical cyclone passage frequency over the western North Pacific using empirical orthogonal function. Journal of Korean Earth Science Society, 30, 721-733.
Choi, K.S. and Kim, T.R., 2011. Development of a diagnostic index on the approach of typhoon affecting Korean Peninsula. Journal of Korean Earth Science Society, 32, 347-359.
Cummins, P.F., Lagerloef, G.S.E., and Mitchum, G., 2005, A regional index of northeast Pacific variability based on satellite altimeter data. Geophysical Research Letters, 32, L17607, doi: 10.1029/2005GL023642.
DiNezio, P., Clement, A., and Vecchi, G.A., 2010, Reconciling differing views of tropical Pacific climate change. EOS, 91, 141-142.
Gill, A.E., 1982, Atmosphere-Ocean Dynamics. Academic Press, 662 pp.
George, J.E., Gray, W.M., 1976, Tropical cyclone motion and surrounding parameter relationships. Journal of Applied Meteorology, 15, 1252-1264.
Graham, N.E., 1994, Decadal-scale climate variability in the 1970s and 1980s: Observations and model results.
Climate Dynamics, 10, 135-162.
Hammer, G.L., Nicholls, N., Mitchell, C., Eds, 2000, Applications of Seasonal Climate Forecasting in Agricultural and Natural Ecosystems: The Australian Experience. Atmospheric and Oceanographic Sciences Library, Vol. 21, Kluwer Academic, 469 pp.
Hwang, H.S, Byun, H.R., Lee, S.M., Choi, K.S., and Lee, J.S., 2010, Distribution of precipitation on the Korean Peninsula associated with the weakening of tropical cyclones. Journal of Korean Earth Science Society, 31, 322-334.
Held, I.M. and Soden, B.J., 2006, Robust responses of the hydrological cycle to global warming. Jouranl of Climate, 19, 5686-5699.
Holmgren, M., Scheffer, M., Ezcurra, E., Gutierrez, J.R., and Mohrena, G.M.J., 2001, El Niño effects on the dynamics of terrestrial ecosystems. Trends Ecology, 16, 89-94.
Kalnay, E., Kanamitsu, M., Kistler, R., Collins, W., Deaven, D., Gandin, L., Iredell, M., Saha, S., White, G., Woollen, J., Zhu, Y., Leetmaa, A., Reynolds, R., Chelliah, M., Ebisuzaki, W., Higgins, W., Janowiak, J., Mo, K.C., Ropelewski, C., Wang, J., Jenne, R., and Joseph, D., 1996, The NCEP/NCAR 40-Year reanalysis project. Bulletin of American Meteorological Society, 77, 437-471.
Karnauskas, K.B., Seager, R., Kaplan, A., Kushnir, Y., and Cane, M.A., 2009, Observed strengthening of the zonal sea surface temperature gradient across the equatorial Pacific ocean. Journal of Climate, 22, 4316-4321.
Kistler, R., Kalnay, E., Collins, W., Saha, S., White, G., Woollen, J., Chelliah, M., Ebisuzaki, W., Kanamitsu, M., Kousky, V., Dool, H., Jenne, R., and Fiorino, M., 2001, The NCEP/NCAR 50-year reanalysis. Bulletin of the American Meteorological Society, 82, 247-267.
Krishnamurthy, V. and Goswami, B.N., 2000, Indian monsoon-ENSO relationship on interdecadal timescale.
Journal of Climate, 13, 579-595.
Kumar, K.K., Rajagopalan, B., and Cane, M.A., 1999, On the weakening relationship between the Indian monsoon and ENSO. Science, 284, 2156-2159.
Lander, M.A. 1994, An exploratory analysis of the relationship between tropical storm formation in the
western North Pacific and ENSO. Monthly Weather Review, 122, 636-651.
Lu, R.Y., Dong, B.W., Cess, R.D., and Potter, G.L., 2004, The 1997/1998 El Niño: A test for climate models.
Geophysical Research Letters, 31, L12216, doi:10.1029/
2004GL019956
Matsuura, T., Yumoto, M., and Iizuka, S., 2003, A mechanism of interdecadal variability of tropical cyclone activity over the western North Pacific. Climate Dynamics, 21, 105-117.
Meng, Q., Latif, M., Park, W., Keenlyside, N., Semenov, V., and Martin, T., 2012, Twentieth century Walker Circulation change: Data analysis and model experiments. Climate Dynamics, 38, 1757-1773, doi:10.1007/s00382-011-1047-8.
Nicholls, N., 1993, El Niño-Southern Oscillation and vector-borne disease. Lancet, 342, 1284-1285.
Nitta, T. and Yamada, S., 1989, Recent warming of tropical sea surface temperature and its relationship to the Northern Hemisphere circulation. Journal of the Meteorological Society of Japan, 67, 187-193.
Philander, S.G., 1990, El Niño, La Niña, and the Southern Oscillation. Academic Press. New York, 293 pp.
Phillips, J.G., Cane, M.A., and Rosenzweig, C., 1998, ENSO, seasonal rainfall patterns and simulated maize yield variability in Zimbabwe. Agriculture and Forest Meteorology, 90, 39-50.
Power, S.B., Tseitkin, F., Torok, S., Lavery, B., and McAvaney, B., 1998, Australian temperature, Australian rainfall, and the Southern Oscillation, 1910-1996:
Coherent variability and recent changes. Australian Meteorological Magazine, 47, 85-101.
Power, S., Casey, T., Folland, C., Colman, A., and Mehta, V., 1999, Inter-decadal modulation of the impact of ENSO on Australia. Climate Dynamics, 15, 319-324.
Reynolds, R.W., Rayner, N.A., Smith, T.M., Stokes, D.C., and Wang, W., 2002, An improved in situ and satellite SST analysis for climate. Journal of Climate, 15, 1609- 1625.
Ropelewski, C.F. and Halpert, M.S., 1989, Precipitation patterns associated with the high index phase of the Southern Oscillation. Journal of Climate, 2, 268-284.
Sohn, B.J. and Park, S.C., 2010, Strengthened tropical circulations in past three decades inferred from water
vapor transport. Journal of Geophysical Research, 115, D15112, doi: 10.1029/2009JD013713.
Tanaka, H.L., Ishizaki, N., and Kitoh, A., 2004, Trend and interannual variability of Walker, monsoon and Hadley circulations defined by velocity potential in the upper troposphere. Tellus A, 56, 250-269.
Vecchi, G. and Soden, B., 2007, Global warming and the weakening of the tropical circulation. Journal of Climate, 20, 4316-4340.
Vecchi, G., Soden, B., Wittenberg, A., Held, I., Leetmaa, A., and Harrison, M., 2006, Weakening of tropical Pacific atmospheric circulation due to anthropogenic forcing. Nature, 441, 73-76, doi: 10.1038/nature04744.
Velden, C.S., Leslie, L.M., 1991, The basic relationship between tropical cyclone intensity and the depth of the environmental steering layer in the Australian region.
Weather and Forecasting, 6, 244-253.
Wang, B. and Chan, J.C.L., 2002, How strong ENSO events affect tropical storm activity over the western North Pacific. Journal of Climate, 15, 1643-1658.
Wang, H. and Mehta, V.M., 2008, Decadal variability of the Indo-Pacific warm pool and its association with atmospheric and oceanic variability in the NCEPNCAR and SODA reanalyses. Journal of Climate, 21, 5545- 5565.
Wilks, D. S., 1995: Statistical methods in the atmospheric sciences. Academic Press, 467 pp.
Xie, P. and Arkin, P.A., 1997, Global precipitation: A 17- year monthly analysis based on gauge observations, satellite estimates, and numerical model outputs.
Bulletin of the American Meteorological Society, 78, 2539-2558.
Yumoto, M. and Matsuura, T., 2001, Interdecadal variability of tropical cyclone activity in the western North Pacific. Journal of Meteorological Society of Japan, 79, 23-35.
Zhang, L., Wu, L., and Yu, L., 2011, Oceanic origin of a recent La Niña-like trend in the tropical Pacific.
Advances in Atmospheric Sciences, 28, 1109-1117, doi:
10.1007/s00376-010-0129-6.
Zhang, M. and Song, H., 2006, Evidence of deceleration of atmospheric vertical overturning circulation over the tropical Pacific. Geophysical Research Letters, 33, L12701, doi: 10.1029/2006GL025942.
Manuscript received: February 4, 2016 Revised manuscript received: May 13, 2016 Manuscript accepted: October 28, 2016