378 Clinical Psychopharmacology and Neuroscience 2016;14(4):378-382
Received: June 10, 2016 / Revised: June 23, 2016
Accepted: June 24, 2016
Address for correspondence: Bon-Hoon Koo, MD, PhD Department of Psychiatry, Yeungnam University College of Medicine, 170 Hyeonchung-ro, Nam-gu, Daegu 42415, Korea Tel: +82-53-620-3343, Fax: +82-53-629-0256
E-mail: [email protected]
This is an Open-Access article distributed under the terms of the Creative Commons Attribution Non-Commercial License (http://creativecommons.org/licenses/by-nc/4.0) which permits unrestricted non-commercial use, distribution, and reproduction in any medium, provided the original work is properly cited.
Association between Cerebral Amyloid Deposition and Clinical Factors Including Cognitive Function in Geriatric Depression: Pilot Study Using Amyloid Positron Emission Tomography
Hye-Geum Kim
1, Eun-Jung Kong
2, Eun-Jin Cheon
1, Hae-Won Kim
3, Bon-Hoon Koo
1Departments of
1Psychiatry and
2Nuclear Medicine, Yeungnam University Medical Center, Yeungnam University College of Medicine,
3
Department of Nuclear Medicine, Dongsan Medical Center, Keimyung University School of Medicine, Daegu, Korea
The purpose of this study was to explore the relationship between cerebral amyloid deposition and overall clinical factors includ- ing cognitive functions in geriatric depression by using
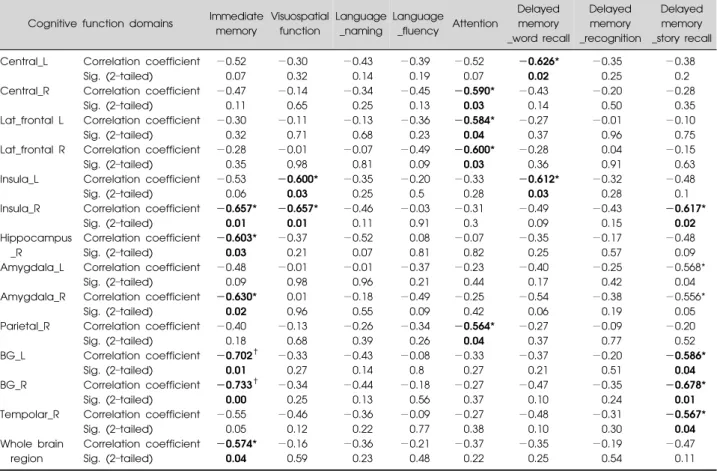
18F-florbetaben positron emission tomography. Thirteen subjects aged over 60 years who had a history of major depressive disorder and also had subjective memory complaint were included. Of all subjects, 3 subjects judged as amyloid positive, and the others judged as amyloid negative. Their memory, visuospatial func- tions and attention abilities were negatively correlated with amyloid deposition in specific brain regions, but their language and recognition abilities were not correlated with any region. The amyloid deposition of the whole brain region was significantly negatively correlated with immediate memory.
KEY WORDS: Amyloid positron emission tomography; Geriatric depression; Alzheimer disease; Subjective memory complaint.
INTRODUCTION
Patients with geriatric depression (GD) often have sub- jective memory complaint (SMC), and patients in early stage of Alzheimer diseases (AD) also not seldom have depressive symptoms.
1-4)There are many hypotheses about the correlation between GD and AD, but none of them can explain the causal relationship correctly.
However, several recent studies have indicated that de- pression is associated with developing AD.
5-8)Two meta-analyses reported that a history of depression in- creased the risk of developing AD, with the risk being ap- proximately two times greater than that of the control group.
6,8)The mechanisms linking depression and the risk of AD are unknown, but may involve abnormalities in multiple biological cascades, including the metabolism of
-amyloid (A) peptide in the brain.
9,10)The recent devel- opment of high-affinity positron emission tomography (PET) imaging ligands for A now permits the evaluation
of the neuropathologic link among depression, cognitive impairment, and AD in vivo.
11)However, there are few studies that have examined cerebral A levels in GD until now.
Given this background, in this study, we aimed to ex- plore the relationship between cerebral amyloid deposi- tion in each brain region and the overall clinical factors in- cluding cognitive functions in GD by using amyloid PET.
METHODS
Participants
We studied a total of 13 subjects aged over 60 who had a history of major depressive disorder based on the Diagnostic and Statistical Manual of Mental Disorders, Fifth Edition (DSM-5).
12)They also had SMC, but had not been diagnosed with dementia yet. The exclusion criteria were a history of psychotic disorder including schizo- phrenia, other current clinically relevant neurologic ill- nesses, a history of apparent brain injury, or ever having undergone interventional treatments, including trans- cranial magnetic stimulation and electroconvulsive therapy.
All participants received clinical, psychological assess-
ments, and were checked with
18F-florbetaben (AV-1)
PET at the same time. We assessed the cognitive functions
Table 1. Demographic and clinical characteristics of all subjects Subject Age (yr) Sex Education
(yr) FHx_Dep FHx_Dem Psychotic features
Anxious
distress HAM-D MMSE CDR RBANS
A* 65 Male 18 − + + + 37 24 0.5 112
B* 72 Male 12 − + + + 12 22 1 81
C* 76 Female 0 + − − + 15 27 0 116
D 70 Female 0.5 − − + + 8 21 0.5 102
E 70 Male 16 − − − − 10 27 0.5 158
F 68 Female 9 − − − − 13 29 0.5 157
G 74 Female 7 − − − − 24 18 1 79
H 69 Female 14 − − − − 19 25 0 169
I 76 Female 11 + − − − 28 23 1 141
J 72 Male 12 − − − − 24 27 0.5 145
K 70 Female 6 − − − − 10 23 0.5 93
L 80 Male 6 − − − − 7 24 0.5 133
M 74 Male 12 − − + − 15 22 1 133
Mean±SD 72.00±3.98 9.50±5.46 17.08±8.90 24.17±3.00 0.58±0.34 124.54±29.84
FHx, first degree family history; Dep, depression; Dem, dementia; HAM-D, total score of Hamilton Rating Scale for Depression; MMSE, total score of mini mental state examination; CDR, Clinical Dementia Rating score; RBANS, total score of Repeatable Battery for the Assessment of Neuropsychological Status; SD, standard deviation.
*Subjects A, B, C were A positive, the other subjects were A negative.
by the mini mental state examination (MMSE), Clinical Dementia Rating (CDR), and Repeatable Battery for the Assessment of Neuropsychological Status (RBANS).
13)The depressive symptom severity was evaluated based on the Hamilton Rating Scale for Depression (HAM-D). All participants were allowed to continue taking psychotropic drugs, but changes in medication were prohibited during the study period.
The protocol of this study was approved by the institu- tional review board at Yeungnam University Hospital in Daegu, Korea (YUMC 2015-07-028-002).
Scanning and Imaging Procedure
All of the subjects received a single intravenous bolus of approximately 296 MBq (8 mCi) of
18F-florbetaben.
The PET scanner used was a Discovery 710 PET/CT system (GE Healthcare, Waukesha, WI, USA) in three- dimensional acquisition mode. A continuous 20 minutes (min) brain PET data scan was acquired 90-min post in- jection and was reconstructed using 4 frames of 5-min each. Each subject also had an magnetic resonance imag- ing scan session, including a T1-weighted scan, which was employed for spatial normalization during voxel- based analysis.
Image Analysis
For the quantitative analysis of the
18F-florbetaben PET images, we used the method of a previous study.
14)A re- gion-of-interest (ROI) analysis was performed on the in- dividual PET images, which were spatially normalized to the Montreal Neurological Institute (MNI) atlas space us-
ing Statistical Parametric Mapping 2.0 (SPM2; Wellcome Department of Imaging Neuroscience, Institute of Neurology, University College London). The mean cort- ical ROI templates contained 10 regions (frontal, tempo- ral, occipital, parietal regions, basal ganglia [BG], cing- ulum, hippocampus, insula, amygdale and central region), as defined by the Automated Anatomic Labeling.
15)Mean cortical and whole cerebellar ROI templates were applied to all PET scans to calculate the mean regional cere- bral-to-cerebellar standard uptake values (SUVRs).
14)The average of these regions was evaluated as a measure of the global mean cortical
18F-florbetaben binding. A-positive (A+) and A-negative (A−)
18F-florbetaben PET sta- tuses were defined according to the threshold of ≥1.10, a criterion derived from the Alzheimer’s Disease Neuro- imaging Initiative (ADNI) database.
16)Statistical Analyses
The demographic and clinical characteristics between the A+ and A− groups were compared by the Mann- Whitney U-test. The categorical data were analyzed using Fisher’s exact test. The associations between the cerebral SUVRs and cognitive functions were evaluated using Pearson correlation coefficients. Significant correlations were validated using Spearman’s rank correlations co- efficients (Spearman’s rho).
Statistical analyses were performed with the IBM SPSS
Statistics ver. 22.0 statistical package (IBM Co., Armonk,
NY, USA), and p values <0.05 were considered significant.
Table 2. Correlation between amyloid deposition and cognitive functions in each brain region
Cognitive function domains Immediate memory
Visuospatial function
Language _naming
Language
_fluency Attention
Delayed memory _word recall
Delayed memory _recognition
Delayed memory _story recall
Central_L Correlation coefficient −0.52 −0.30 −0.43 −0.39 −0.52 −0.626* −0.35 −0.38
Sig. (2–tailed) 0.07 0.32 0.14 0.19 0.07 0.02 0.25 0.2
Central_R Correlation coefficient −0.47 −0.14 −0.34 −0.45 −0.590* −0.43 −0.20 −0.28
Sig. (2–tailed) 0.11 0.65 0.25 0.13 0.03 0.14 0.50 0.35
Lat_frontal L Correlation coefficient −0.30 −0.11 −0.13 −0.36 −0.584* −0.27 −0.01 −0.10
Sig. (2–tailed) 0.32 0.71 0.68 0.23 0.04 0.37 0.96 0.75
Lat_frontal R Correlation coefficient −0.28 −0.01 −0.07 −0.49 −0.600* −0.28 0.04 −0.15
Sig. (2–tailed) 0.35 0.98 0.81 0.09 0.03 0.36 0.91 0.63
Insula_L Correlation coefficient −0.53 −0.600* −0.35 −0.20 −0.33 −0.612* −0.32 −0.48
Sig. (2–tailed) 0.06 0.03 0.25 0.5 0.28 0.03 0.28 0.1
Insula_R Correlation coefficient −0.657* −0.657* −0.46 −0.03 −0.31 −0.49 −0.43 −0.617*
Sig. (2–tailed) 0.01 0.01 0.11 0.91 0.3 0.09 0.15 0.02
Hippocampus Correlation coefficient −0.603* −0.37 −0.52 0.08 −0.07 −0.35 −0.17 −0.48
_R Sig. (2–tailed) 0.03 0.21 0.07 0.81 0.82 0.25 0.57 0.09
Amygdala_L Correlation coefficient −0.48 −0.01 −0.01 −0.37 −0.23 −0.40 −0.25 −0.568*
Sig. (2–tailed) 0.09 0.98 0.96 0.21 0.44 0.17 0.42 0.04
Amygdala_R Correlation coefficient −0.630* 0.01 −0.18 −0.49 −0.25 −0.54 −0.38 −0.556*
Sig. (2–tailed) 0.02 0.96 0.55 0.09 0.42 0.06 0.19 0.05
Parietal_R Correlation coefficient −0.40 −0.13 −0.26 −0.34 −0.564* −0.27 −0.09 −0.20
Sig. (2–tailed) 0.18 0.68 0.39 0.26 0.04 0.37 0.77 0.52
BG_L Correlation coefficient −0.702
†−0.33 −0.43 −0.08 −0.33 −0.37 −0.20 −0.586*
Sig. (2–tailed) 0.01 0.27 0.14 0.8 0.27 0.21 0.51 0.04
BG_R Correlation coefficient −0.733
†−0.34 −0.44 −0.18 −0.27 −0.47 −0.35 −0.678*
Sig. (2–tailed) 0.00 0.25 0.13 0.56 0.37 0.10 0.24 0.01
Tempolar_R Correlation coefficient −0.55 −0.46 −0.36 −0.09 −0.27 −0.48 −0.31 −0.567*
Sig. (2–tailed) 0.05 0.12 0.22 0.77 0.38 0.10 0.30 0.04
Whole brain Correlation coefficient −0.574* −0.16 −0.36 −0.21 −0.37 −0.35 −0.19 −0.47
region Sig. (2–tailed) 0.04 0.59 0.23 0.48 0.22 0.25 0.54 0.11
BG, basal ganglia; L, left; R, right; Sig., significance.
Significant correlations are given in bold.
*Correlation is significant at the 0.05 level (2-tailed).
†