The Influence of Asian Dust, Haze, Mist, and Fog on Hospital Visits for Airway Diseases
Jinkyeong Park, M.D.
1, Myoung Nam Lim, Ph.D.
2, Yoonki Hong, M.D.
2and Woo Jin Kim, M.D.
21
Department of Critical Care Medicine, Samsung Medical Center, Sungkyunkwan University School of Medicine, Seoul,
2
Department of Internal Medicine and Environmental Health Center, Kangwon National University Hospital, Kangwon National University School of Medicine, Chuncheon, Korea
Background: Asian dust is known to have harmful effects on the respiratory system. Respiratory conditions are also influenced by environmental conditions regardless of the presence of pollutants. The same pollutant can have different effects on the airway when the air is dry compared with when it is humid. We investigated hospital visits for chronic obstructive pulmonary disease (COPD) and asthma in relation to the environmental conditions.
Methods: We conducted a retrospective study using the Korean National Health Insurance Service claims database of patients who visited hospitals in Chuncheon between January 2006 and April 2012. Asian dust, haze, mist, and fog days were determined using reports from the Korea Meteorological Administration. Hospital visits for asthma or COPD on the index days were compared with the comparison days. We used two-way case-crossover techniques with one to two matching.
Results: The mean hospital visits for asthma and COPD were 59.37 ± 34.01 and 10.04 ± 6.18 per day, respectively.
Hospital visits for asthma significantly increased at lag0 and lag1 for Asian dust (relative risk [RR], 1.10; 95% confidence interval [CI], 1.01–1.19; p<0.05) and haze (RR, 1.13; 95% CI, 1.06–1.22; p<0.05), but were significantly lower on misty (RR, 0.89; 95% CI, 0.80–0.99; p<0.05) and foggy (RR, 0.89; 95% CI, 0.84–0.93; p<0.05) days than on control days. The hospital visits for COPD also significantly increased on days with Asian dust (RR, 1.29; 95% CI, 1.05–1.59; p<0.05), and were significantly lower at lag4 for foggy days, compared with days without fog (RR, 0.85; 95% CI, 0.75–0.97; p<0.05).
Conclusion: Asian dust showed an association with airway diseases and had effects for several days after the exposure.
In contrast to Asian dust, mist and fog, which occur in humid air conditions, showed the opposite effects on airway diseases, after adjusting to the pollutants. It would require more research to investigate the effects of various air conditions on airway diseases.
Keywords: Dust; Asthma; Pulmonary Disease, Chronic Obstructive; Fog
Introduction
Airborne particles emitted from geologic media are com- monly referred to as dust, and these can range in size from 1 to 10,000 M, with a large percentage falling within the particulate matter (PM)
10particle-size category
1. Dust can be carried by wind into sensitive environments and is known to have harmful effects on the respiratory system. In recent years, Asian dust has become a critical issue of concern in Asia
2. South Korea has four distinct seasons, and Asian dust occurs mainly in the spring (March to May), although it has also been observed in the winter (November to January) by the Korea Meteorological Administration. Asian dust has different effects on airway diseases under different environmental conditions.
Copyright © 2015
The Korean Academy of Tuberculosis and Respiratory Diseases.
All rights reserved.
Address for correspondence: Woo Jin Kim, M.D.
Department of Internal Medicine, Kangwon National University School of Medicine, 1 Gangwondaehak-gil, Chuncheon 24341, Korea Phone: 82-32-258-9364, Fax: 82-32-258-2404
E-mail: [email protected] Received: Dec. 9, 2014 Revised: Jul. 1, 2015 Accepted: Jul. 15, 2015
cc It is identical to the Creative Commons Attribution Non-Commercial License (http://creativecommons.org/licenses/by-nc/4.0/).
Most studies on dust have reported an association between Asian dust and asthma or chronic obstructive pulmonary dis- ease (COPD)
3-6, but there has been little research on its effects on pulmonary diseases under various atmospheric conditions.
Numerous studies indicate that environmental exposure to PM, dust, gases, fumes, or organic antigens may also be risk factors for airway diseases such as asthma or COPD
7-9. Patients with airway diseases can have increased symptoms and hospital admissions with increasing environmental pol- lution
10; specifically, nitrogen oxides and particulates can interact with other factors such as viral infection in asthma to exacerbate symptoms rather than acting alone, and a similar mechanism might occur with COPD
11,12.
The respiratory system is also influenced by environmental conditions independent of pollutant presence. Generally, at- mospheric phenomena occurs under two different air condi- tions: dry air and humid air. Asian dust, fog, mist, and haze are environmental conditions that decrease the clarity of the sky.
Haze occurs in dry air, while mist and fog occurs in relatively humid air; fog is distinguished from mist by visibility <1 km
13, and mist occurs at lower humidity than fog. Physiologically, inhalation of particulate matter, an aerosol of water, or simply cold or dry air may cause bronchial constriction
14, but the as- sociations among mist, fog, haze, and airway diseases have received little attention.
We hypothesized that hazy, foggy, or misty air would influ- ence the airway differently. We investigated hospital visits for COPD and asthma under these air conditions in Chuncheon, Korea from January 1, 2006, to April 30, 2012.
Materials and Methods
We conducted a retrospective study based on the Korean National Health Insurance Service (KNHIS) claims database of patients who visited hospitals in Chuncheon, Gangwon-do, between January 1, 2006, and April 30, 2012. The KNHIS Pro- gram, which provides compulsory universal health insurance, was implemented in 1989 and has managed a computerized database for all medical facilities in South Korea since 1998.
The KNHIS provides medical insurance for all Koreans, and all South Koreans are legally obliged to become members of this national insurance system. Computerized records of daily clinic visits or hospital admissions are available for each contracted medical institution. All medical institutions must submit standard claim documents for medical expenses on a computerized form, which includes the date of admission and discharge, identification number, gender, birthday, and the diagnostic codes for each admission based on the Korean version of the International Classification of Diseases, 10th revision. Asthma or COPD-related diagnoses include pre- dominantly allergic asthma (J45.0), unspecific asthma (J45.9), status asthmaticus (J46.0), other specified COPD (J44.8),
and unspecified COPD (J44.9). Information on asthma- and COPD-related healthcare use from the KNHIS claims data- base contained the frequency of healthcare visits, admissions, the number of pulmonary function tests performed, and any prescribed medications. This study protocol was approved by the Institutional Review Board of Kangwon National Univer- sity Hospital.
1. Meteorological data
Chuncheon (37
o89N, 127
o73E) is a relatively small city (population, 0.25 million; area, 1,116 km
2) with a mostly rural character outside the central district; it does not contain in- dustrial complexes.
The National Meteorological Administration of the Repub- lic of Korea supplied data on air quality in Chuncheon. The air monitoring station provided hourly ambient air concen- trations of PM
10, sulfur dioxide (SO
2), nitrogen dioxide (NO
2), ozone (O
3), and carbon monoxide (CO). Information on the 24-hour average temperature (
oC), dew point, wind speed, cloud cover, sunlight duration, and relative humidity (%) was provided by the National Meteorological Office. Asian dust, haze, mist, and fog episodes reported by the National Meteo- rological Office were classified as index days.
2. Statistical analysis
In our primary analysis, hospital visits for asthma or COPD on the index days were compared with those on comparison days. We used the two-way case-crossover technique with one-to-two matching. Index days were days containing Asian dust, haze, mist, or fog occurrences, and comparison days were the same days of the week as the corresponding index days. We selected two comparison days for each index day, 7 days before and 7 days after the index day. If dust occurred on the comparison day initially selected, days 14 preceding/
following the index day were selected. Candidate comparison days were excluded if the same phenomenon occurred within 7 days before or after the selected day or within 14 days since hospital visits, given that they are influenced by season and the day of the week.
Environmental effects, if any, may be delayed over a pe-
riod of several days. To test this hypothesis, we examined the
lagged effects on the days of occurrences and up to 5 days
(from lag0 to lag5) after the events. We used the t test to com-
pare hospital admissions; counts of hospital admissions were
modeled using Poisson regression. The rate ratio for atmo-
spheric phenomenon versus non-atmospheric phenomenon
was estimated in a Poisson regression model, adjusting for
temperature, humidity, PM
10, and O
3. All analyses were per-
formed using the SAS version 9.2 (SAS Institute Inc., Cary, NC,
USA); p-values of <0.05 (two-sided) were considered statisti-
cally significant.
Results
Mean hospital visits for asthma were 59.37±34.01 per day;
hospital admissions occurred 0.72±0.96 times per day, and outpatient clinic visits occurred 58.68±33.74 times per day.
Mean hospital visits for COPD were 10.04±6.18 times per day;
hospital admissions occurred 0.30±0.64 times per day, and outpatient clinic visits occurred 9.75±6.14 times per day.
In total, 61 dust storms, 248 hazes, 257 mists, and 89 fog epi- sodes (index days) were identified between January 1, 2006, and April 30, 2012 in Chuncheon city; 52 dust storms, 167 haze, 176 mist, and 51 fog episodes were identified as compar- ison days. However, some events were counted that occurred together with other environmental conditions. In terms of each episode alone, 34 Asian dust storms, 17 hazes, 10 mists, and 46 foggy days were identified after excluding overlaps with other atmospheric conditions. The levels of air pollutants were higher under dry air conditions (Table 1), and PM
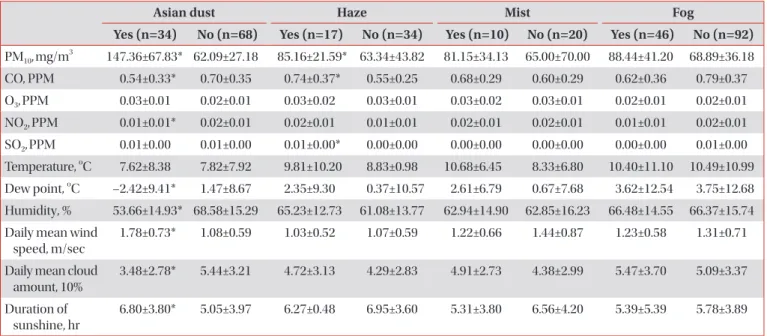
10was significantly higher on dusty and hazy days compared with control days. CO was significant lower on dusty and higher on hazy days. There was no difference in air pollutant episodes between the misty or foggy days and the control days.
1. Meteorological conditions and asthma-related hospital visits
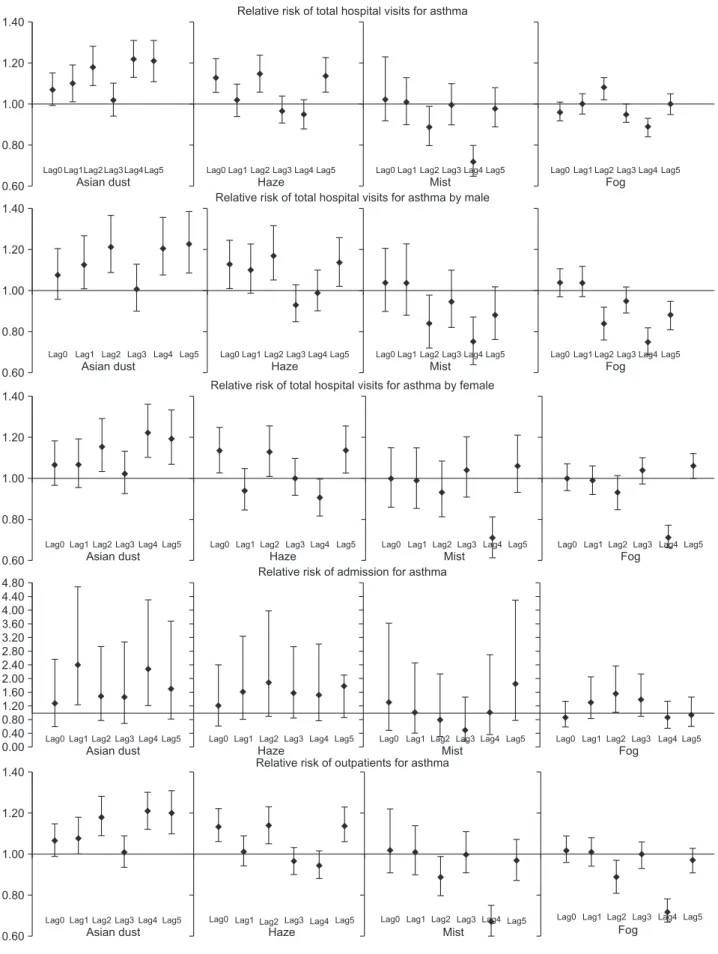
Hospital visits for asthma were significantly associated with the occurrence of Asian dust (relative risk [RR], 1.10; 95% con- fidence interval [CI], 1.01–1.19; p<0.05) and haze (RR, 1.13;
95% CI, 1.06–1.22; p<0.05) compared with control days (Table 2). In the case of humid conditions, hospital visits were sig- nificantly lower on misty (RR, 0.89; 95% CI, 0.80–0.99; p<0.05) and foggy (RR, 0.89; 95% CI, 0.84–0.93; p<0.05) days than on days without these conditions.
Hospital visits on days containing Asian dust showed an in- creasing trend from lag1 to lag5. Similarly, asthma-related hos- pital visits reflected increasing numbers of patients in all sexes.
The overall number of hospital visits was higher for male than female patients, with peak hospital admissions at lag1 (RR, 2.40; 95% CI, 1.23–4.68; p<0.05) and peak visits to outpatient clinics at lag4 (RR, 1.21; 95% CI, 1.12–1.30; p<0.05). Hospital visits on hazy days showed a similar trend between lag0 to lag5. The number of hospital admissions was not affected by haze at any lag.
Conversely, hospital visits showed a decreasing trend from lag0 (RR, 1.02; 95% CI, 0.92–1.23) to lag5 (RR, 0.72; 95% CI, 0.65–0.80; p<0.05) for misty days, and there was a significantly lower number of hospital visits at lag5 for foggy days (RR, 0.85;
95% CI, 0.75–0.97; p<0.05). The occurrence of fog or mist had no influence on the number of admissions.
2. Meteorological conditions and COPD-related hospital visits
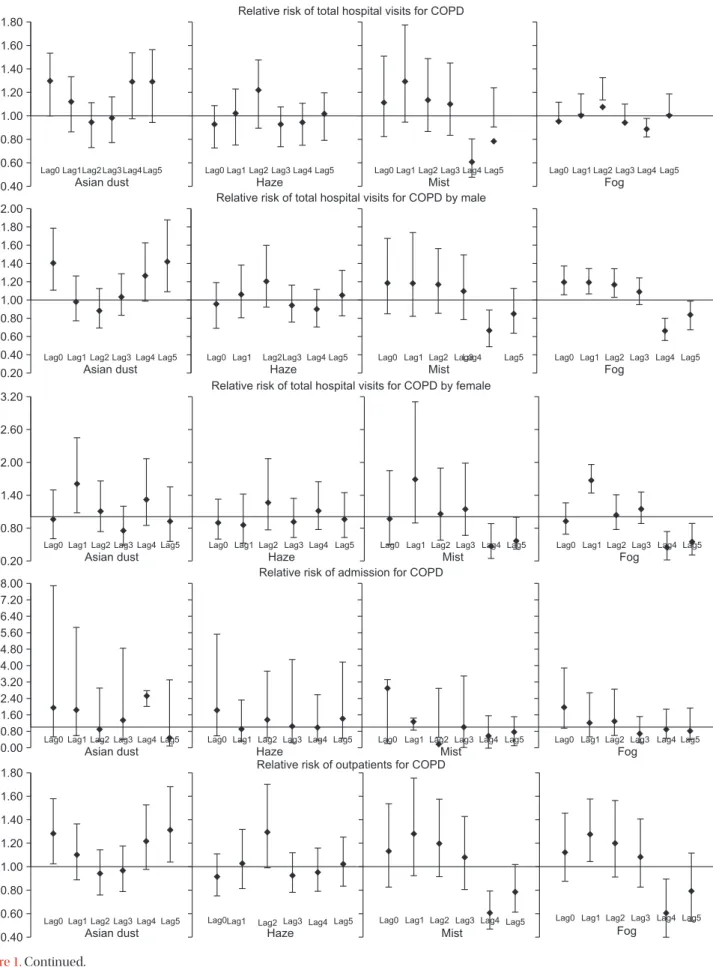
Hospital visits for COPD were significantly associated with the occurrence of Asian dust storms (RR, 1.29; 95% CI, 1.05–
1.59; p<0.05) (Table 3). The occurrence of haze, mist, and fog did not affect COPD-related hospital visits.
Table 1. Mean levels of environmental variables on event days (Asian dust, haze, mist, and fog) and comparison days
Asian dust Haze Mist Fog
Yes (n=34) No (n=68) Yes (n=17) No (n=34) Yes (n=10) No (n=20) Yes (n=46) No (n=92) PM
10, mg/m
3147.36±67.83* 62.09±27.18 85.16±21.59* 63.34±43.82 81.15±34.13 65.00±70.00 88.44±41.20 68.89±36.18 CO, PPM 0.54±0.33* 0.70±0.35 0.74±0.37* 0.55±0.25 0.68±0.29 0.60±0.29 0.62±0.36 0.79±0.37 O
3, PPM 0.03±0.01 0.02±0.01 0.03±0.02 0.03±0.01 0.03±0.02 0.03±0.01 0.02±0.01 0.02±0.01 NO
2, PPM 0.01±0.01* 0.02±0.01 0.02±0.01 0.01±0.01 0.02±0.01 0.02±0.01 0.01±0.01 0.02±0.01 SO
2, PPM 0.01±0.00 0.01±0.00 0.01±0.00* 0.00±0.00 0.00±0.00 0.00±0.00 0.00±0.00 0.01±0.00 Temperature,
oC 7.62±8.38 7.82±7.92 9.81±10.20 8.83±0.98 10.68±6.45 8.33±6.80 10.40±11.10 10.49±10.99 Dew point,
oC –2.42±9.41* 1.47±8.67 2.35±9.30 0.37±10.57 2.61±6.79 0.67±7.68 3.62±12.54 3.75±12.68 Humidity, % 53.66±14.93* 68.58±15.29 65.23±12.73 61.08±13.77 62.94±14.90 62.85±16.23 66.48±14.55 66.37±15.74 Daily mean wind
speed, m/sec
1.78±0.73* 1.08±0.59 1.03±0.52 1.07±0.59 1.22±0.66 1.44±0.87 1.23±0.58 1.31±0.71
Daily mean cloud amount, 10%
3.48±2.78* 5.44±3.21 4.72±3.13 4.29±2.83 4.91±2.73 4.38±2.99 5.47±3.70 5.09±3.37
Duration of sunshine, hr
6.80±3.80* 5.05±3.97 6.27±0.48 6.95±3.60 5.31±3.80 6.56±4.20 5.39±5.39 5.78±3.89
*p<0.05.
PM: particulate matter; CO: carbon monoxide; O
3: ozone; NO
2: nitrogen dioxide; SO
2: sulfur dioxide.
T a ble 2. Relative risk of ho spital visits for asthma To ta l
†M ale Fe male A dmission Outpatients Lag N o Yes RR N o Ye s R R N o Yes RR N o Ye s R R N o Yes RR Asian dus t 0 65.4 68.5 1.07 (0.99–1.15) 30.4 31.8 1.08 (0.96–1.21) 35 36.7 1.06 (0.96–1.18) 0.8 0.9 1.24 (0.60–2.56) 64.6 67.6 1.07 (0.99–1.15) 1 59.1 64.8 1.10 (1.01–1.19)* 27.8 31.1 1.13 (1.01–1.27)* 31.3 33.7 1.06 (0.95–1.19) 0.6 0.9 2.40 (1.23–4.68)* 58.5 63.9 1.08 (1.00–1.18)* 2 56.8 68.4 1.18 (1.09–1.28)* 26.4 32.5 1.22 (1.09–1.37)* 30.4 35.9 1.15 (1.03–1.29)* 0.6 1 1.48 (0.75–2.94) 56.2 67.4 1.18 (1.09–1.28)* 3 66.3 68.2 1.02 (0.94–1.10) 30.3 31.1 1.01 (0.90–1.13) 36 37.1 1.02 (0.92–1.13) 0.8 0.9 1.45 (0.69–3.07) 65.5 67.3 1.01 (0.94–1.09) 4 59.6 72.2 1.22 (1.13–1.31)* 28.3 33.9 1.21 (1.08–1.36)* 31.3 38.3 1.22 (1.10–1.36)* 0.6 1.3 2.28 (1.21–4.28)* 59 70.9 1.21 (1.12–1.30)* 5 49.7 62.4 1.21 (1.11–1.31)* 23.4 29.3 1.23 (1.09–1.39)* 26.3 33.1 1.19 (1.06–1.33)* 0.6 0.8 1.71 (0.80–3.68) 49.1 61.6 1.20 (1.10–1.31)* H aze 0 72.6 81.6 1.13 (1.06–1.22)* 34.2 38.3 1.13 (1.01–1.25)* 38.4 43.3 1.14 (1.03–1.25)* 0.8 1.1 1.18 (0.60–2.32) 71.8 80.5 1.13 (1.06–1.22)* 1 65.3 67.4 1.02 (0.94–1.10) 30.4 34.2 1.10 (0.99–1.23) 34.9 33.2 0.94 (0.85–1.05) 0.8 1.2 1.56 (0.78–3.12) 64.5 66.2 1.01 (0.94–1.09) 2 65.3 71.4 1.15 (1.06–1.24)* 29.6 32.9 1.17 (1.05–1.32)* 35.7 38.5 1.13 (1.01–1.26)* 1.2 1.3 1.82 (0.87–3.80) 64.1 70.1 1.14 (1.05–1.23)* 3 87.2 84.4 0.97 (0.91–1.04) 40.7 38.5 0.93 (0.85–1.03) 46.5 45.9 1.00 (0.92–1.10) 1 1.2 1.52 (0.82–2.82) 86.2 83.2 0.96 (0.90–1.03) 4 80.3 76.4 0.95 (0.88–1.02) 36.1 35.7 0.99 (0.90–1.10) 44.2 40.7 0.91 (0.82–1.00) 0.8 1.1 1.47 (0.75–2.87) 79.5 75.3 0.94 (0.88–1.01) 5 67.6 76.6 1.14 (1.06–1.23)* 32.2 36.4 1.14 (1.02–1.26) 35.4 40.2 1.14 (1.03–1.26)* 1 1.1 1.02 (0.82–2.02) 66.6 75.5 1.14 (1.06–1.23)* Mis t 0 63.9 63.9 1.02 (0.92–1.23) 30.5 31.2 1.04 (0.90–1.21) 33.4 32.7 1.00 (0.86–1.15) 1 1.1 1.31 (0.49–3.55) 62.9 62.8 1.02 (0.91–1.13) 1 55 49.5 1.01 (0.90–1.13) 25.1 23 1.04 (0.88–1.23) 29.9 26.5 0.99 (0.85–1.15) 1 0.9 1.02 (0.43–2.42) 54 48.6 1.01 (0.90–1.14) 2 68 60.6 0.89 (0.80–0.99)* 32.4 28.8 0.84 (0.72–0.98)* 35.6 31.8 0.93 (0.81–1.08) 0.8 0.7 0.81 (0.31–2.11) 67.2 59.9 0.89 (0.80–0.99)* 3 68.4 67.9 1.00 (0.90–1.10) 33.3 31.3 0.95 (0.82–1.10) 35.1 36.6 1.0490.91–1.20) 1.2 0.6 0.52 (0.19–1.44) 67.2 67.3 1.00 (0.91–1.11) 4 80.1 57.1 0.72 (0.65–0.80)* 36.7 27.7 0.75 (0.64–0.87)* 43.4 29.4 0.71 (0.61–0.81)* 0.9 0.8 1.03 (0.40–2.65) 79.2 56.3 0.72 (0.65–0.80)* 5 70.6 69.3 0.98 (0.89–1.08) 32.9 29.6 0.88 (0.76–1.02) 37.7 39.7 1.06 (0.93–1.21) 0.9 1.3 1.82 (0.79–4.19) 69.7 68 0.97 (0.87–1.07) Fo g 0 56.7 54.6 0.96 (0.92–1.01) 26.9 26 0.97 (0.90–1.04) 29.8 28.6 0.96 (0.90–1.03) 0.9 0.8 0.87 (0.57–1.33) 55.8 53.8 0.96 (0.92–1.01) 1 54.8 54.3 1.00 (0.95–1.05) 26.1 25.4 0.98 (0.91–1.06) 28.7 28.9 1.02 (0.95–1.09) 0.6 0.7 1.31 (0.83–2.06) 54.2 53.6 1.00 (0.95–1.05) 2 51.4 54.8 1.08 (1.02–1.13) 23.9 25.7 1.09 (1.01–1.17)* 27.5 29.1 1.07 (0.99–1.15) 0.8 1 1.55 (1.01–2.39)* 50.6 53.8 1.07 (1.02–1.13)* 3 57.3 54.8 0.95 (0.91–1.00) 27.1 25.6 0.94 (0.88–1.01) 30.2 29.2 0.97 (0.90–1.03) 0.5 0.8 1.38 (0.89–2.15) 56.8 54 0.95 (0.90–0.99)* 4 62.1 54.6 0.89 (0.84–0.93)* 29 25.8 0.90 (0.84–0.97)* 33.1 28.8 0.87 (0.82–0.93)* 0.7 0.6 0.85 (0.54–1.34) 61.4 54 0.89 (0.84–0.93)* 5 60.8 59.2 1.00 (0.95–1.05) 27.7 27.2 0.99 (0.92–1.06) 33.1 32 1.01 (0.95–1.07) 0.8 0.8 0.92 (0.59–1.46) 60 58.4 1.00 (0.95–1.05) *p<0.05.
†T otal=male+female. RR : relative risk.
T a ble 3. Relative risk of ho spital visits for COPD Lag N o Yes RR N o Ye s R R N o Yes RR N o Ye s R R N o Yes RR Asian dus t 0 9.1 11.8 1.29 (1.05–1.59)* 6.7 9.5 1.41 (1.11–1.79)* 2.4 2.3 0.95 (0.60–1.49) 0.2 0.3 2.00 (0.51–7.89) 8.9 11.5 1.28 (1.03–1.58)* 1 9.5 10.7 1.12 (0.91–1.38) 7.6 7.4 0.99 (0.78–1.27) 1.9 3.3 1.62 (1.07–2.45)* 0.3 0.6 1.81 (0.56–5.85) 9.2 10.1 1.10 (0.89–1.37) 2 10.9 10.1 0.94 (0.77–1.15) 8.4 7.4 0.89 (0.70–1.13) 2.5 2.7 1.09 (0.73–1.65) 0.4 0.2 0.93 (0.30–2.88) 10.5 9.9 0.94 (0.76–1.15) 3 11.6 11.5 0.98 (0.80–1.19) 9 9.5 1.04 (0.84–1.29) 2.6 2 0.76 (0.48–1.19) 0.4 0.5 1.40 (0.40–4.83) 11.2 11 0.97 (0.79–1.18) 4 8.8 10.9 1.28 (1.03–1.59)* 6.9 8.4 1.27 (0.99–1.63) 1.9 2.5 1.32 (0.84–2.06) 0.3 0.7 2.54 (2.02–2.82)* 8.5 10.2 1.22 (0.98–1.53) 5 8.1 10.2 1.29 (1.02–1.64)* 5.9 8.1 1.43 (1.09–1.88)* 2.2 2.1 0.93 (0.55–1.55) 0.8 0.5 0.50 (0.08–3.31) 7.3 9.7 1.32 (1.04–1.68)* H aze 0 11.6 10.6 0.93 (0.77–1.13) 8.9 8.3 0.95 (0.76–1.19) 2.7 2.3 0.90 (0.60–1.33) 0.6 0.8 1.84 (0.61–5.56) 11 9.8 0.91 (0.75–1.11) 1 8.4 8.8 1.02 (0.81–1.29) 6.4 7 1.06 (0.81–1.39) 2 1.8 0.86 (0.52–1.42) 0.5 0.5 0.91 (0.35–2.32) 7.9 8.3 1.03 (0.81–1.32) 2 10.8 11.4 1.22 (0.96–1.55) 8.3 8.7 1.21 (0.92–1.60) 2.5 2.7 1.25 (0.76–2.06) 0.5 0.6 1.36 (0.49–3.78) 10.3 10.8 1.29 (0.99–1.7) 3 13.2 11.9 0.93 (0.78–1.12) 10.3 9.2 0.94 (0.77–1.16) 2.9 2.7 0.91 (0.62–1.35) 0.5 0.4 1.06 (0.26–4.32) 12.7 11.5 0.93 (0.78–1.12) 4 11 11.1 0.95 (0.79–1.15) 8.5 8.2 0.90 (0.73–1.12) 2.5 2.9 1.12 (0.76–1.64) 0.7 0.6 0.98 (0.37–2.60) 10.3 10.5 0.96 (0.79–1.16) 5 10.3 10 1.02 (0.84–1.25) 7.7 7.9 1.05 (0.83–1.33) 2.6 2.1 0.96 (0.63–1.44) 0.7 0.8 1.40 (0.47–4.21) 9.6 9.2 1.02 (0.83–1.25) Mis t 0 9.5 10.6 1.12 (0.83–1.52) 7.4 8.4 1.20 (0.85–1.68) 2.1 2.2 0.95 (0.49–1.86) 0.6 0.5 2.92 (0.16–3.38) 8.9 10.1 1.13 (0.83–1.54) 1 8.8 11.9 1.30 (0.95–1.78) 7.0 8.6 1.20 (0.83–1.74) 1.8 3.3 1.68 (0.90–3.11) 0.5 0.6 1.25 (0.88–1.45) 8.3 11.3 1.28 (0.93–1.76) 2 11.3 12.3 1.14 (0.88–1.49) 8.3 9.8 1.17 (0.86–1.57) 3.0 2.5 1.06 (0.59–1.91) 0.5 0.2 0.12 (0.01–2.88) 10.8 12.1 1.20 (0.92–1.58) 3 9.7 10.1 1.11 (0.84–1.46) 7.3 7.2 1.09 (0.79–1.50) 2.4 2.9 1.15 (0.67–2.00) 0.4 0.3 0.97 (0.07–3.51) 9.3 9.8 1.08 (0.81–1.43) 4 15.7 10.3 0.62 (0.48–0.81)* 12.2 9.0 0.67 (0.49–0.90)* 3.5 1.3 0.46 (0.24–0.88)* 0.4 0.3 0.54 (0.02–1.58) 15.3 10 0.61 (0.47–0.80) 5 12.6 11 0.79 (0.61–1.01) 9.4 9.1 0.85 (0.64–1.13) 3.2 1.9 0.57 (0.33–1.00) 0.5 0.3 0.75 (0.10–1.57) 12.1 10.7 0.79 (0.62–1.02) Fo g 0 8.7 9.4 1.08 (0.95–1.23) 6.7 7.6 1.09 (0.95–1.27) 2 1.8 1.04 (0.79–1.37) 0.4 0.6 1.92 (0.95–3.86) 8.3 8.8 1.06 (0.93–1.21) 1 10 9.5 0.93 (0.82–1.06) 7.8 7.2 0.92 (0.79–1.07) 2.2 2.3 0.95 (0.72–1.25) 0.2 0.3 1.18 (0.52–2.67) 9.8 9.2 0.93 (0.81–1.06) 2 10 10.9 1.10 (0.96–1.26) 7.7 8.2 1.07 (0.93–1.25) 2.3 2.7 1.19 (0.91–1.56) 0.4 0.5 1.30 (0.60–2.85) 9.6 10.4 1.10 (0.96–1.25) 3 10.2 10.4 1.03 (0.90–1.17) 7.9 7.8 1.01 (0.87–1.17) 2.3 2.6 1.09 (0.84–1.42) 0.3 0.2 0.63 (0.26–1.52) 9.9 10.2 1.04 (0.91–1.19) 4 10.5 9.1 0.85 (0.75–0.97)* 8.1 6.6 0.80 (0.69–0.94)* 2.4 2.5 1.02 (0.79–1.31) 0.5 0.4 0.88 (0.42–1.87) 10 8.7 0.85 (0.75–0.97)* 5 11.2 11 1.02 (0.91–1.15) 8.7 8.2 0.97 (0.85–1.12) 2.5 2.8 1.20 (0.95–1.53) 0.4 0.4 0.88 (0.40–1.92) 10.8 10.6 1.03 (0.91–1.16) *p<0.05.
†T otal=male+female. COPD: chronic obs tructive pulmonar y disease; RR : relative risk.
Figure 1. Relative risk for airway disease. COPD: chronic obstructive pulmonary disease.
Relative risk of total hospital visits for asthma 1.40
1.20
1.00
0.80
0.60 Asian dust
Lag0 Lag1Lag2 Lag3 Lag4 Lag5
Haze
Lag1 Lag2 Lag3 Lag4
Lag0 Lag5 Lag0Lag1 Lag2 Lag3 Lag4Lag5
Mist Fog
Lag1 Lag2 Lag3 Lag4
Lag0 Lag5
Relative risk of total hospital visits for asthma by male 1.40
1.20
1.00
0.80
0.60 Asian dust
Lag0 Lag1 Lag2 Lag3 Lag4 Lag5
Haze
Lag1 Lag2 Lag3 Lag4
Lag0 Lag5 Lag0Lag1Lag2Lag3 Lag4Lag5
Mist
Lag2
Fog
Lag1 Lag3 Lag4
Lag0 Lag5
Relative risk of total hospital visits for asthma by female 1.40
1.20
1.00
0.80
0.60 Asian dust
Lag1 Lag2 Lag3 Lag4
Lag0 Lag5
Haze
Lag1 Lag2 Lag3 Lag4
Lag0 Lag5 Lag0 Lag1 Lag2 Lag3 Lag4 Lag5
Mist Fog
Lag1 Lag2 Lag3 Lag4
Lag0 Lag5
Relative risk of admission for asthma 4.80
4.40 4.00 3.60 3.20 2.80 2.40 2.00 1.60 1.20 0.80 0.40
0.00 Asian dust
Lag0 Lag1 Lag2 Lag3 Lag4 Lag5
Haze
Lag1 Lag2 Lag3 Lag4
Lag0 Lag5 Lag0 Lag1 Lag2 Lag3 Lag4 Lag5
Mist Fog
Lag1 Lag2 Lag3 Lag4
Lag0 Lag5
Relative risk of outpatients for asthma 1.40
1.20
1.00
0.80
0.60 Asian dust
Lag0 Lag1 Lag2 Lag3 Lag4 Lag5
Haze
Lag1 Lag2 Lag3 Lag4
Lag0 Lag5 Lag0 Lag1 Lag2 Lag3 Lag4 Lag5
Mist Fog
Lag1 Lag2 Lag3 Lag4
Lag0 Lag5
Relative risk of total hospital visits for COPD 1.80
1.60 1.40 1.20 1.00 0.80 0.60
0.40 Asian dust
Lag0 Lag1Lag2 Lag3 Lag4 Lag5
Haze
Lag1 Lag2 Lag3 Lag4
Lag0 Lag5 Lag0Lag1 Lag2 Lag3 Lag4Lag5
Mist Fog
Lag1 Lag2 Lag3 Lag4
Lag0 Lag5
Relative risk of total hospital visits for COPD by male 2.00
1.80 1.60 1.40 1.20 1.00
Asian dust Haze
Lag1 Lag2Lag3 Lag4
Lag0 Lag5 Lag0 Lag1 Lag2 Lag3Lag4 Lag5
Mist Fog
Lag1 Lag2 Lag3 Lag4
Lag0 Lag5
Relative risk of total hospital visits for COPD by female 3.20
2.60
2.00
1.40
0.80
0.20 Asian dust
Lag1 Lag2 Lag3 Lag4
Lag0 Lag5
Haze
Lag1 Lag2 Lag3 Lag4
Lag0 Lag5 Lag0 Lag1 Lag2 Lag3 Lag4 Lag5
Mist Fog
Lag1 Lag2 Lag3 Lag4
Lag0 Lag5
Relative risk of admission for COPD 8.00
7.20 6.40 5.60 4.80 4.00 3.20 2.40 1.60 0.80
0.00 Asian dust
Lag0 Lag1 Lag2 Lag3 Lag4 Lag5
Haze
Lag1 Lag2 Lag3 Lag4
Lag0 Lag5 Lag0 Lag1 Lag2 Lag3 Lag4 Lag5
Mist Fog
Lag1 Lag2 Lag3 Lag4
Lag0 Lag5
Relative risk of outpatients for COPD 1.80
1.60 1.40 1.20 1.00 0.80 0.60
0.40 Asian dust
Lag0 Lag1 Lag2 Lag3 Lag4 Lag5
Haze
Lag1 Lag2 Lag3 Lag4
Lag0 Lag5 Lag0 Lag1 Lag2 Lag3 Lag4 Lag5
Mist Fog
Lag1 Lag2 Lag3 Lag4
Lag0 Lag5
0.80 0.60 0.40 0.20
Lag0 Lag1 Lag2 Lag3 Lag4 Lag5