Vol.14, No.6, pp.91-99 (2020)
Finite Element Model based on Strain Tests for Predicting Bending Strength of Small Gears for Aircraft
Taehyung Kim1, †, Taehyeon Seok1, Jin-woon Seol2, Byung-ho Lee2, Byung-gi Kwon2, and Jong-yoon Choi3
1Major of Aeronautical & Mechanical Engineering, Division of Aeronautics, Cheongju University
2PGM R&D Laboratory, LIG Nex1 Co. Ltd.
3Aerospace Technology Research Institute, Agency for Defence Development
Abstract
This study proposes a finite element (FE) model for predicting the bending strength of small gears used in electro- mechanical actuators for aircraft. First, a strain gauge was attached to the tooth root of test gear, and the strain was measured. Subsequently, the FE model was applied to calculate the strain of the test gear, and the modeled strain was compared with the experimental strain. The results confirmed that the FE strain was very close to the experimental strain and the FE model was valid. This FE model was extended to the bending strength analysis of several small gear tooth models. The bending strengths of all the tooth models were almost identical to the ISO theoretical bending strength. Finally, the FE model was validated and the reliability of the modeled bending strength was evaluated through the strain measurement experiment.
Key Words : Electro-mechanical Actuator, Bending Strength, Small Gear Tooth, Strain Measurement, Finite Element Analysis
1. Introduction
Factors related to the stability of advanced technologies, such as efficiency, maintenance cost, and noise and weight reduction, as well as economic feasibility, are being raised as the main issues of future concern in the aviation industry. Accordingly, existing hydraulic actuators in unmanned aircraft are being replaced by electro-mechanical actuators in future aircraft [1, 2]. Electro-mechanical actuators are effective for optimizing installation space and reducing weight because they can be designed with compact and lightweight structures. The US has been developing such electro-mechanical actuators since the 1980s, and they have already been applied to military aircraft, such as
F16 and B52 [3]. In Korea, electro-mechanical actuators
have been developed for manned and unmanned aircraft suitable for miniaturization and weight reduction [4, 5].
These aircraft include a planetary reducer composed of small gears; the size and number of these gears vary according to the type of aircraft. As these gears are frequently exposed to sudden external loads, strict standards of strength and stiffness design are required to prevent damage. For this reason, many studies have been conducted to predict the bending strength of gear teeth using finite element (FE) analysis [6, 7]. However, bending strength has been predicted through simple analyses without experimental verifications because most of the gear modules are small. Therefore, this study proposes an FE model for reliable prediction of the bending strength of small gears. For this purpose, a spur gear with a tooth root that allows attaching of a strain gauge was selected as a test gear to determine the experimental strain through a bending test.
Subsequently, the FE model was used to predict the bending strain of the test gear. The modeled and experimental strains were compared to validate the Received: Aug. 26, 2020 Revised: Oct. 07, 2020 Accepted: Oct. 19, 2020
† Corresponding Author
Tel: +82-43-229-8449, E-mail: [email protected]
Ⓒ The Society for Aerospace System Engineering
analysis model and apply it to the bending strength analysis of various small gear teeth. Finally, the validity of the proposed model and the reliability of the modeled bending strength were evaluated through the strain measurement experiment.
2. Gear Material Properties
2.1 Tensile Test
In this study, a well-known aircraft material, AISI9310, was adopted as the gear. After manufacturing a tensile specimen, carburizing heat treatment was performed on the surface according to the AMS2759/7 standard [8]. The diameter of the central part of the specimen was 12.5 mm, the diameter of both ends of the fixed specimen was 22 mm, the gage distance was 50 mm, and the total length of the specimen was 300 mm.
A tensile test was conducted on the processed specimen three times according to the KS B0802 [9] standard, and the arithmetic mean and standard deviation were calculated. The results showed an average yield strength (σo) of 1089 MPa (standard deviation 5.7 MPa) and an average tensile strength (σt) of 1334 MPa (standard deviation 12.7 MPa). The modulus of elasticity (E) was 210 GPa, and the Poisson’s ratio (ν) was 0.3. These properties were used as input properties for the bending strength analysis.
2.2 Hardness Test
The hardness of the surface-carburized AISI9310 material was measured according to the AMS2759/7 standard [8]. Surface hardness was measured with the Rockwell C-scale, and the hardness of the material from the carburized surface toward the inner structure was measured with Vickers hardness. The hardness tests revealed that the surface had a hardness of HRC 61.8, which is within the standard range of HRC 58 to 64, and the hardened layer had a hardness of HV 550 at a depth of 0.55 mm from the surface, satisfying the heat treatment standard of HV 550 at a depth of 0.45–0.75 mm.
3. Bending Strain of the Test Gear Tooth
3.1 Shape and Specifications of the Test Gear Tooth (Module 4.5)
In this study, a test spur gear and a bending test jig were designed and manufactured by referring to the
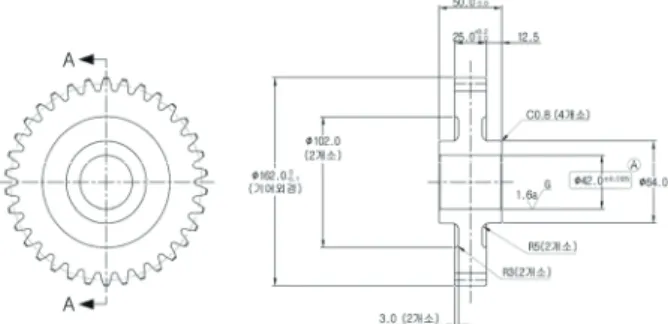
SAE J1619 standard [10] for the bending strength test of the gear teeth. The shape and specification of the spur gear are as shown in Fig. 1. The pitch circle diameter of the gear was 153 mm, tooth width (b) was 25 mm, number of teeth (Z) was 34, pressure angle was 20°, and the coefficient of potential was not considered. In addition, the radius of curvature of the tooth root of the test gear (Rf) was 1.35 mm. The manufactured test gear parts are shown in Fig. 2. In this study, each of the gear teeth adjacent to one support gear tooth and one test gear tooth was removed through discharge wire cutting according to SAE J1619 to prevent interferences between the jig and gear during the gear tooth bending strength test [10]. Eleven teeth were removed and the remaining eleven teeth were tested. The test number was recorded to distinguish test conditions and order.
3.2 Strain Gauge Attachment and Gear Installation The attachment of the strain gauge to the tooth root of the test gear according to the SAE J1619 standard [10] for the gear tooth bending test is shown in Fig. 3.
Two types of one-way strain gauges (120 Ohm) manufactured by CAS were used. Their dimensions (grid width × height) were 1.2 mm × 1.0 mm (S10) and 1.7 mm × 3.0 mm (S30). In the attachment, the center of
FFiigg.. 11 Shape and Dimension of the Test gear
Fig. 2 Test Gear with Eleven Teeth Removed
the strain gauge coincided with the position for calculating the theoretical bending strength according to ISO 6336-3. Three strain gauges of the same type were attached to one tooth. One was attached at the center (B) based on the tooth width, and the remaining two were attached at positions located 10 mm from the left (A) and right (C). Fig. 4 shows photographs of the gear and gear fixing jig installed in the universal testing machine for the gear tooth bending test. After the gear was mounted on the jig, each cable connected to the three strain gauges attached to the gear teeth was connected to the strain indicator. During the bending test, loads of 10, 20, 30, 40, and 50 kN were applied to the gear teeth, with 5 repetitions for each load. The bending test conditions are shown in Table 1. In the table, test Nos.
1–3 (Loading anvil adjustment) refer to the state in which only part of the tooth width was in contact with the loading anvil after mounting the gear on the test jig.
Experiments conducted in this state provided results of low reliability. Therefore, only test results from Nos. 4–
11 were considered.
3.3 Gear Tooth Bending Strain
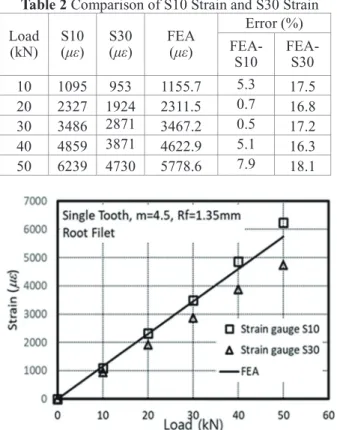
The measured bending strain with increasing bending loads from Nos. 4–11 in Table 1 are as shown in Table 2 and Fig. 5. For both S10 and S30, the bending strain was found to increase linearly. These experimental strains were compared with the modeled strain (Chapter 5); the modeled results were found to be closer to the results of S10 than to those of S30. This is believed to
Fig. 3 Test Gear Tooth with Three Strain Gauges
Fig. 4 Installation of Test Equipment for Gear Tooth Bending Test
be due to the difference in the grid area of the S10 and S30 strain gauges attached to the curved surface of the tooth root. The average experimental strain of S10 (attached to a narrower area of the gear tooth root surface) was slightly closer to the modeled strain (obtained from a single point) because the grid area of S10 was smaller than that of S30. Therefore, the results of S10 were used to calculate the test bending strength.
Table 1 Conditions for Gear Tooth Bending Test No. Tooth
No. Test Name Loading Anvil Adjustment
1 10 ADD S10-1 No
2 1 CJU S10-1-1 No
3 18 CJU S10-1-1-2 No
4 21 CJU S10-2 Yes
5 8 CJU S10-3 Yes
6 16 CJU S10-4 Yes
7 21 CJU S30-1 Yes
8 12 CJU S30-2 Yes
9 23 CJU S30-3 Yes
10 1 CJU S30-4 Yes
11 16 CJU S30-5 Yes
Table 2 Comparison of S10 Strain and S30 Strain Load(kN) S10
(με) S30
(με) FEA
(με)
Error (%) FEA-S10 FEA-
S30
10 1095 953 1155.7 5.3 17.5
20 2327 1924 2311.5 0.7 16.8
30 3486 2871 3467.2 0.5 17.2
40 4859 3871 4622.9 5.1 16.3
50 6239 4730 5778.6 7.9 18.1
Fig. 5 Comparison of S10 strain and S30 strain
4. Theoretical Bending Strength
4.1 ISO Bending Strength
The bending strength of the gear was defined to evaluate the load capacity at which no breakage occurs in the tooth root fillet during the design life. In this study, the ISO 6336-3 theoretical equation [11], expressed in Equation (1), was used to verify the validity of the bending strength of test gear teeth (module 4.5) and the small gear teeth (module 0.9) used in electromechanical actuators.
∙ ∙ ∙ ∙ ∙ (1)
where Ft denotes the applied load, b denotes the tooth width, m denotes the module of the gear, YF denotes the tooth form factor, YS denotes the modification factor, YB
denotes the contact ratio, and YDT denotes the tooth edge factor. The factors in Equation (1) according to the gear specifications are shown in Table 3.
5. Finite Element Model and Analysis
5.1 Finite Element Analysis Model
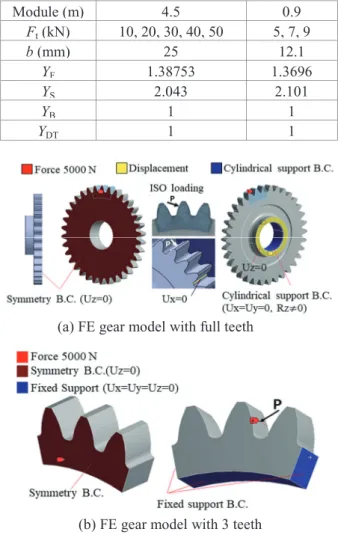
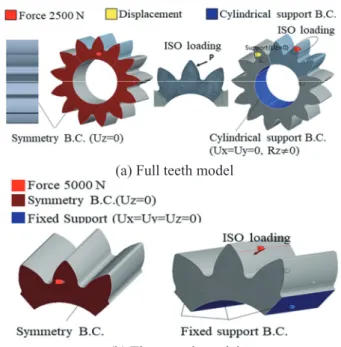
The FE model of the test gear is shown in Fig. 6. The left side is a gear model that includes all 34 gear teeth, and the right side is a partial gear tooth analysis model, which was used to reduce analysis time. AnsysWB 2019 version was used for the FE analysis. The FE network was constructed using a Sweep Method (Quad option) for 3-gear teeth, and a HEXA dominant option for the remaining areas. The load and displacement boundary conditions used in the analysis are shown in Fig. 7. In the case of the full gear tooth analysis model shown in (a), to which the symmetry condition was applied after cutting the center of the tooth width in half, the Cylindrical Support option (Ux = Uy = 0, Rz ≠ 0) was applied to the circumferential surface where the shaft was inserted considering the experimental environment.
Axial displacement was constrained (Uz = 0) on the side of the boss where the shaft was inserted. In addition, in the case of the partial gear tooth analysis model shown in (b), the symmetry condition was applied to the center of the tooth width, and all directional displacements were constrained (Ux = Uy = Uz = 0) to the cut surface except for the 3-gear teeth. Moreover, the bending load (P) applied to both of these two analysis models was
applied according to the ISO standard and the test location, and various loads were applied, as shown in Table 3 Ft.
5.2 Selection of the Number of Gear Teeth
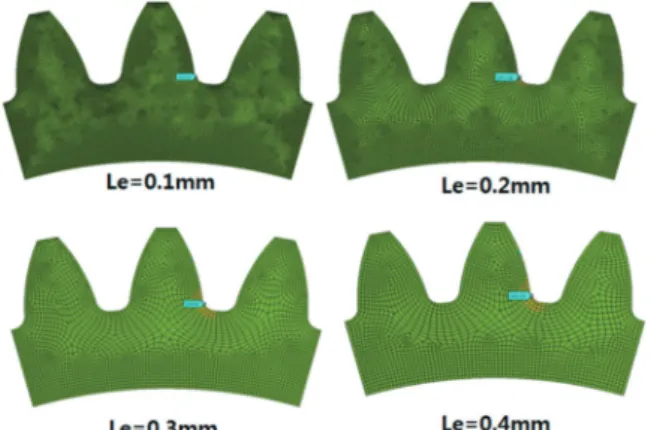
Fig. 8 shows FE model with various numbers of gear teeth reflecting the minimum element size Le = 0.1 mm.
Fig. 6 FE Gear Models with Full Teeth and 3 Teeth Table 3 Coefficients for Calculating Gear Bending
Strength
Module (m) 4.5 0.9
Ft(kN) 10, 20, 30, 40, 50 5, 7, 9
b (mm) 25 12.1
YF 1.38753 1.3696
YS 2.043 2.101
YB 1 1
YDT 1 1
(a) FE gear model with full teeth
(b) FE gear model with 3 teeth
Fig. 7 Load and Boundary Conditions for FE Test Gear Model
A small gear tooth model was designed that can replace the full gear tooth model to sufficiently reduce the analysis time. Analyses were performed with 1, 3, and 5 gear teeth. The maximum principal stress of models with full 1, 3, and 5 gear teeth is shown in Table 4. The bending load reflected in the analysis was 10 kN.
Among the analysis models with 1, 3, and 5 gear teeth, the 1-tooth gear model showed the largest error compared to the overall gear model, and the 3- and 5- gear teeth models showed small errors. Excluding the 1- tooth model with a large error, the 3-teeth model was selected as the final analysis model because it consumed less analysis time than the 5-teeth model.
5.3 Selection of the Minimum Element Size
The FE mesh consisting of the minimum element size (Le) from 0.1 mm to 0.4 mm for the 3-teeth model is shown in Fig. 9. This is to determine the element size to be used in the test gear tooth model through the convergence of the maximum principal stress after analysis. The distribution of effective stress depending on the element size is shown in Fig. 10. The load reflected in the analysis was 10 kN, and a constant value of 243.0–244.8 MPa was provided for all element sizes.
Fig. 8 FE Gear Models with Various Element Sizes Table 4 Maximum principal Stresses from FE Analysis
of Test Gear Models with Various Numbers of Teeth
Number of tooth
(EA)
Max. principal
stress (MPa) Error
(%) CPU time
34 239.2 Ref. 1 h 44 m
1 245.8 2.7 04 m 39 s
3 243.5 1.8 16 m 26 s
5 242.7 1.2 19 m 05 s
According to the distribution, the minimum element size (Le) of the test gear model was selected as 0.4 mm.
5.4 Bending Strain Analysis
In the analysis, the strain was measured for the 3- tooth model at the same point as in the experiment. The results of the modeled and measured strain are shown in Table 5. In the analysis, loads of 10, 20, 30, 40, and 50 kN were applied, and the error for each load was calculated. The modeled and experimental strain showed errors at the 0.5–5.2% level at 10–40 kN but showed a slightly higher error of 7.9% at 50 kN. Some previous studies [12-20] reported errors within 4%, but most of them reported errors of approximately 6–16%.
In comparison to these errors, the results of this study showed the same or better level of errors than previous studies.
Fig. 9 Convergence of Maximum Principal Stresses with Various FE Element Sizes
Fig. 10 FE Test Gear Model with Various Numbers of Teeth
Table 5 Comparison of Measured (S10) and FEA Strain for Test Gear
Load (kN) FEA (με) Test (με) Error (%) 10 1155.7 1095.0 5.2
20 2311.5 2327.2 0.7
30 3467.2 3486.2 0.5
40 4622.9 4859.4 5.1
50 5778.6 6239.2 7.9
5.5 Bending Strength Analysis
After the strain analysis, the 3-tooth model was used to perform the bending strength analysis. The values of modeled, experimental, and ISO theoretical bending strength are shown in Table 6. The experimental bending strength was measured by multiplying the strain measured in the extension direction of the strain gauge according to Hooke’s law by the elastic modulus of the material (210 GPa), and the ISO theoretical bending strength was measured through Equation (1) [11]. Errors between the modeled and experimental bending strength ranged from 0.5% to 11% under all loading conditions.
By contrast, the errors between the modeled and theoretical (ISO 6336) bending strengths were uniform in the range of 3.3 to 3.4%. Several previous studies [21-25] on the error of the analytical and theoretical bending strength were reviewed. Several papers reported errors of 2–5%, and some reported errors of 6–
21%. This study also showed results comparable or even superior to those of previous studies. Similarly, the bending strength analysis method, including the establishment and analysis process of the test gear tooth analysis model (module 4.5), was applied to predict the bending strength of small-gear teeth (module 0.9), as described in the next section.
6. Analysis of Bending Strength of Small Gear Teeth
6.1 Small Gear Tooth (module 0.9) Analysis Model The bending strength of small gears cannot be measured using a strain gauge. Therefore, the bending strength of small gears was predicted through FE analysis. The modeling and analysis method of module 4.5 based on the strain measurement experiment summarized in Chapter 5 was applied for the bending analysis of small-gear teeth (module 0.9). The specifications of the small gears used in the analysis are
Table 6 Comparison of FEA, Measured, and ISO Bending Strengths
Load
(kN) FEA
(MPa) Test
(MPa) ISO (MPa)
Error (%) FEA- FEA-
10 260.8 231.9 252.0 11.0 3.3
20 521.5 491.7 504.1 5.7 3.3
30 782.3 736.8 756.1 5.8 3.3
40 1043.0 1020.5 1008.1 2.2 3.3 50 1303.8 1310.3 1260.1 0.5 3.4
as follows: module 0.9, pitch circle diameter of 11.7 mm, 13 teeth, tooth width of 25 mm, and pressure angle of 20°. The electric potential coefficient was not considered, and the material and mechanical properties were the same as those of the test gear. The analysis model of small gear parts is illustrated in Fig. 11. The total gear tooth model including the full (13-teeth) and 3-teeth models were used, and the minimum element size (Le) of 0.02 mm was applied. The load and boundary conditions reflected in the small gear analysis model are shown in Fig. 12, in which (a) is the full gear model and (b) is the 3-gear teeth model. Both models were applied in the same manner as the test gear.
6.2 Bending Strength Analysis of Various Small Gear Teeth
The main specifications of various small-gear tooth analysis models, with the number of teeth that are difficult to experimentally test, are shown in Table 7.
Fig. 11 FE Small Gear (Module 0.9) Models with Full Teeth and 3 Teeth
(a) Full teeth model
(b) Three-teeth model
Fig. 12 Load and Boundary Conditions for FE Small Gear (module 0.9) Models
Cases 1–3 are small gear tooth models (module 0.9), and Cases 4 and 5 are gear tooth models of modules (2
Table 7 Specifications of Various Small Gears Model Module Number of teeth Face width
(mm) Pressure angle (o)
Case 1 0.9 13 25 20
Case 2 0.9 34 25 20
Case 3 0.9 170 25 20
Case 4 2.0 19 25 20
Case 5 3.0 25 25 20
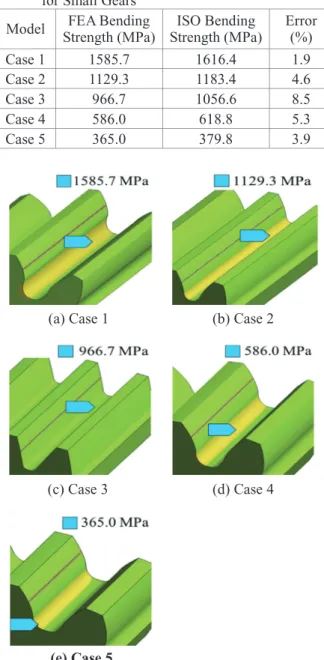
Table 8 Comparison of FE and ISO Bending Strengths for Small Gears
Model FEA Bending
Strength (MPa) ISO Bending
Strength (MPa) Error (%)
Case 1 1585.7 1616.4 1.9
Case 2 1129.3 1183.4 4.6
Case 3 966.7 1056.6 8.5
Case 4 586.0 618.8 5.3
Case 5 365.0 379.8 3.9
(a) Case 1 (b) Case 2
(c) Case 3 (d) Case 4
(e) Case 5
Fig. 13 Maximum Principal Stresses with Various Small Gear FE Model
and 3) that are difficult to test with strain gauge attachment. For all gears, the same carburized AISI9310 was considered the experimental gear, and a load of 10 kN was equally applied. Comparing the analysis results with the ISO theoretical results, as the bending strengths are shown in Table 8, and the stress distribution at the tooth root is shown in Fig. 13. Cases 1 and 2 (module 0.9) showed an error of approximately 2–5%, and Case 3 showed a large error of about 8.5%. In addition, Cases 4 and 5 exhibited errors within 5.3% even when the module was raised to 2 and 3. Compared to the error of approximately 6–21% between analytical and theoretical solutions reported in previous studies, these models show similar or superior results [21-25]. In this study, the bending strength of small gears with small modules could be predicted using the FE model based on the gear tooth bending strain measurement experiment. In the future, the findings can be used as reference data for the analysis of the bending strength of gears with various specifications.
7. Conclusion
In this study, an analysis model was proposed for predicting the bending strength of small gear teeth based on strain measurement experiments using test gear. The overall study can be summarized as follows.
(1) A bending test was performed after attaching strain gauges (S10 and S30). The bending strain corresponding to both strain gauges increased linearly with increasing bending load. These experimental strains were compared with the analytical strain, and the S10 strain was found to be closer to the analytical strain.
Therefore, S10 was used in the calculation of bending strength.
(2) Finite element analysis was performed using 3-teeth models with module 4.5. The analysis and experimental strain showed an error of 0.5–7.9%, and the analysis, experimental, and ISO theoretical bending strengths showed errors within 0.5–11%. In particular, the error between the analysis and ISO theoretical solutions was uniform at 3.3–3.4%, suggesting that the proposed model can be applied as a small gear tooth analysis model.
(3) The analyzed bending strength was measured by defining gears that are difficult to test using strain gauges as a small gear to establish various small gear tooth analysis models. The obtained results were
compared with the ISO theoretical bending strength, and they showed errors within 1.9–8.5%.
The proposed small gear tooth model based on the strain measurement experiment will be a useful reference tool that can be extended to gears of various modules.
References
[1] G. Qiao, G. Liu, Z. Shi, Y. Wang, S. Ma, and T. C.
Lim, “A review of electromechanical actuators for more/all electric aircraft systems,” Proceedings of the Institution of Mechanical Engineers, Part C:
Journal of Mechanical Engineering Science, pp. 1- 24, December 2017.
[2] W. Pat, “Technology for the more and all electric aircraft of the future,” IEEE International Conference on Automatica, pp. 1-5, October 2016.
[3] N. E. Wood, E. F. Echols, and J. H. Ashmore,
“Electromechanical actuation feasibility study,” AD- A031146; AFFDL-TR-76-42, May 1976.
[4] S. H. Huh, B. H. Lee, J. W. Seol, J. H. Baek, M. S.
Yang, M. Young, and J. Y. Kwon, “Accelerated life analysis and endurance verification of electro- mechanical actuator,” Journal of the Korean Society for Precision Engineering, vol. 33, no. 10, pp. 829- 835, October 2016.
[5] G. Yoon, H. Park, and K, Jang, “The state of the art and application of actuator in aerospace,” Journal of the Korean Society of Propulsion Engineers, vol. 14, no. 6, pp. 89-102, December 2010.
[6] S. Prabhakaran, D. S. Balaji, and R. Praveen Kumar,
“Bending stress analysis of a spur gear for material steel 15Ni2Cr1Mo28,” Journal of Engineering and Applied Science, vol. 12, no. 19, pp. 5636-5641, October 2017.
[7] P. B. Sonawane and P. G. Damle, “Static structural analysis of gear tooth,” International Journal of Engineering and Techniques, vol. 2, no. 3, pp. 39- 46, May-June. 2016.
[8] AMS2759/7D, “Gas and vacuum carburizing and heat treatment of carburizing grade steel parts,” SAE International, Revised, 2019.
[9] KS B 0802, “Method of tensile test for metallic materials,” Korean Standard, 1998.
[10]SAE J1619, “Single tooth gear bending fatigue test,” SAE International, Stabilized, 2017.
[11]ISO 6336-3, “Calculation of load capacity of spur and helical gears-Part 3: Calculation of tooth
bending strength,” 2nd Edition, ISO, 2019.
[12]G. Gasparini, U. Mariani, C. Gorla, M. Filippini, and F. Rosa, “Bending fatigue tests of helicopter case carburized gears: Influence of masterial, design and manufacturing parameters,” Gear Technology, pp. 68-76, November-December 2009.
[13]B. N. Bakashe and S. R. Patil, “Contact stress analysis of steel and composite spur gear pair,”
International Journal of Advanced Technology and Engineering Exploration,” vol. 5, No. 45, pp. 262- 268, August 2018.
[14]R. F. Handschuh and G. D. Bibel, “Experimental and analytical study of aerospace spiral bevel gear tooth fillet stresses,” Journal of Mechanical Design,” vol. 121, pp. 565-572, December 1999.
[15]O. Jamkhedkar and B. D. Patil, “Experimental validation with analysis and weight reduction of 2- wheeler spur gear using topology optimization method,” International Research Journal of Modernization in Engineering Technology and Science,” vol. 2, No. 8, pp. 433-441, August 2020.
[16]C. M. Patil and A. D. Pingale, “Measurement of gear stiffness of healthy and cracked spur gear by strain gauge technique,” SSRG International Journal of Mechanical Engineerning,” vol. 5, No. 7, pp. 9-15, July 2018.
[17]Y. Fu, Y. Zhuo, X. Zhou, B. Wan, H. Lv, and Z.
Wang, “Theoretical and experimental study on contact characteristics of spiral bevel gears under quasi-static and large loading conditions,” Applied Sciences,” vol. 10, pp. 1-23, July 2020.
[18]G. B. Ingole, S. B. Wadkar, and D. S. Watwisave,
“Analysis of stress relieving features of asymmetric spur gear,” International Journal of Innovation in Engineering, Research and Technology, ICITDCEME 15th Conference Proceedings, pp. 1-7.
[19]K. N. Naik and D. Dolas, “Static analysis of bending stresses on spur gear tooth profile by using finite element analysis & photo elastic technique,”
International Journal of Current Engineering and Techonolgy, vol. 6, no. 1, pp. 284-288, February 2016.
[20]C. Gorla, F. Rosa, and E. Conrado, “Bending fatigue strength of case carburized and nitrided gear steels for aeronautical applications,” International Journal of Applied Engineering Research, vol. 12, No. 21, pp. 11306-11322, November 2017.
[21]P. Amit, “Bending stress analysis of spur gear,”
International Journal for Research in Applied Science and Technology, vol. 5, no. 6, pp. 422-426, June 2017.
[22]B. Noaman, “Involute gear tooth stresses analysis using finite element modeling,” American Scientific Research Journal for Engineering, Technology, and Sciences, vol. 34, no. 1, pp. 269-284, August 2017.
[23]K. N. Naik and D. Dolas, “Static analysis bending stress on gear tooth profile by variation of gear parameters with the help of FEA,” International Journal of Engineering Research and Technology,
vol. 3, no. 6, pp. 132-136, June 2014.
[24]S. Prabhakaran, D. S. Balaji, and R. R. Kumar,
“Bending stress analysis of a spur gear for material steel 15Ni2Cr1Mo28,” ARPN Journal of Engineering and Applied Sciences, vol. 12, no. 19, pp. 5636-5641, October 2017.
[25]Y. C. Hamand and V. Kalamkar, “Analysis of stresses and deflection of sun gear by theoretical and ANSYS method,” Modern Mechanical Engineering, vol. 1, pp. 56-68, January 2011.