112
한반도 연안 비조석 성분자료의 통계적 특성
Statistical Characteristics of the Non-tidal Components Data in Korean Coasts
조홍연*·정신택**·윤종태***·김창일*
Hong Yeon Cho*, Shin Taek Jeong**, Jong Tae Yoon*** and Chang Il Kim*
요 지 :우리나라연안비조석성분자료의확률밀도함수형태로쌍봉형정규분포함수형태를제안하였다. 비 조석성분자료는국립해양조사원에서제공하는인천, 군산, 목포, 제주, 여수, 마산, 가덕도, 부산, 포항, 속초검 조소의 1시간간격조위자료에서 64개분조성분을이용하여합성된성분을제외한잔차성분이다. 제안된분포함 수와비조석성분자료분포함수의 RMS 오차및결정계수(R2) 값을비교
·
분석한결과, 비조석성분자료의확률밀도함수로본연구에서제안한쌍봉형함수가기존에사용하던정규분포형함수보다더적합한함수로파악되었 다. 본연구에서제안된확률밀도함수의매개변수는 Newton 방법을수정한 Levenberg-Marquardt 방법으로추정
하였으며, 비조석성분자료의표준편차및왜곡도계수는목포, 제주, 속초지점을제외하고는분석지점검조소
자료의 비조화 상수와 밀접한 관계가있는 것으로파악되었다.
핵심용어 :조위자료, 천문조, 비조석성분, 쌍봉형정규분포, 왜곡도
Abstract:
Double-peak normal distribution function was suggested as the probability density function of the non-tidal components (NTC) data in Korean coastal zone. Frequency distribution analysis of the NTC data was carried out using hourly tidal elevation data of the ten tidal gauging stations, i.e., Incheon, Gunsan, Mokpo, Jeju, Yeosu, Masan, Gadeokdo, Busan, Pohang, and Sokcho which were served through the Internet Homepage by the National Ocean Research Institute. NTC data is defined as the difference between the measured tidal elevation data and the astronomical tidal elevation data using 64 tidal constituents information. Based on the RMS error and R
2value comparison analysis, it was found that this suggested function as the probability density function of the NTC data was found to be more appropriate than the normal distribution function. The parameters of the double-peak function were estimated optimally using Levenberg-Marquardt method which was modified from the Newton method. The standard deviation and skewness coefficient were highly correlated with the non-tidal constants of the tidal gauging stations except Mokpo, Jeju and Sokcho stations.
Keywords :
tidal elevation data, astronomical components, non-tidal (meteorological) components, double- peak normal distribution, skewness
1. 서 론
검조소에서측정한조위자료는조화분석과정을통하여 파악이가능한천문조성분
(astronomical componemts)
과 수온,
기압,
지진및미지의영향에의한장주기성분을포함한비조석성분으로구성되어있으며
,
비조석성분은관 측된조위자료에서천문조성분을제거한잔차성분을의 미한다(Pugh, 1987; 2004).
비조석성분은주로기상변화에 의한영향이대부분이기때문에기상조성분(meteorological
components)
으로기술되고있으나,
본연구에서는기타요***
한국해양연구원연안개발연구본부(Coastal Development Research Division, KORDI, Ansan P.O. Box 29, Seoul, 425-600, Korea) **원광대학교토목환경도시공학부(Corresponding author: Shin Taek Jeong, School of Civil, Environmental and Urban Engineering,Wonkwang Univ., Shinyong-Dong 344-2, Iksan-Si, Challabuk-Do 570-749, Korea. [email protected])
***경성대학교건설환경공학부(School of Civil and Environmental Engineering, Kyungsung Univ., Daeyeondong 110 , Namgu, Busan, Korea)
다
.
특히폭풍이연안해역에작용하여수위가상승하는동 안,
대조고조시와일치할경우에는수위상승이증폭될수 있으며,
주위의지형이낮고,
인구밀도가높은경우에는범 람으로인명피해를야기할수있다.
일반적으로해일고(strom surge height)
는식(1)
과같은관측치와예보치(
천 문조성분)
의수위차이S(
t)
로정의할수있다.
(1)
여기서
,
X(
t)
는 관측수위,
Zo(
t)
는 평균해수위,
T(
t)
는 천문조성분,
S(
t)
는비조석성분(
대부분의경우,
폭풍해 일에의한영향성분)
을의미한다.
관측된조위자료의 조 석성분과비조석 성분은 물리적으로 서로 다른 원인에 의하여 발생하므로,
서로 독립 사상(event)
이라고 가정 할 수 있다.
폭풍해일
(storm surge)
은폭풍에의한극심한수위상승을의미하며
,
비조석성분(non-tidal component)
또는잔차(residual),
기상조성분(meteorological residual components)
으로간주된다
.
한편,
비조석성분자료의표준편차및왜 곡도계수는기상의영향을측정할수있는요소이다.
표한분포함수추정에관한연구가중요한사안으로부각되 고있는시점에서조위자료의빈도분포함수에대한추정 과더불어비조석성분의빈도분포함수에대한추정도설 계조위결정에매우중요한요소로작용하기때문에동등 한중요성을가지고있다
(
星谷勝,
石井淸, 1986).
해역 물리인자에대한분포함수연구는주로극치분포에대한 연구가설계관점에서우세하였으나,
최근에는신뢰성설계 및평상시의대표적인조건분석관점에서일반분포(
평 상시자료분포)
에대한관심도부각되고있는실정이다(Table 2
참조).
일반적으로,
관측된조위자료의빈도분포함수형태는조석의우세한분조
(
반일주조또는일주조)
에따 라뚜렷한쌍봉(double peak)
형또는단봉(single peak)
형 의형태를보이게되며(Pugh, 1987),
조등(2004)
은쌍봉 형정규분포에의하여조위자료의빈도분포함수가적절 하게표현될수있음을제시한바있다.
반면,
비조석성 분의빈도분포함수는비조석성분이왜곡된형태를가지 고있는것으로제시되고있으나,
일반적으로정규분포함 수가널리사용되고있다.
그러나,
비조석성분자료는왜 곡된형태가분명하므로왜곡도계수=0
조건인정규분포 보다왜곡도계수표현이가능한분포를적용하는것이바 X t( ) Z=
o t() T t+
( ) S t+
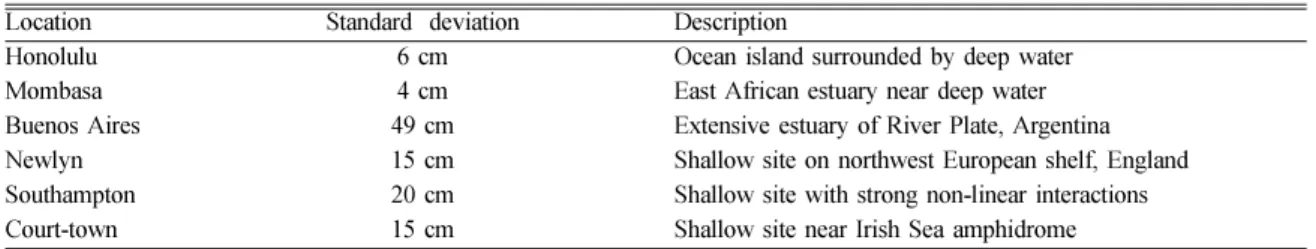
( )Table 1.
Standard deviations of non-tidal components in the World (Pugh, 2004)
Location Standard deviation Description
Honolulu 6 cm Ocean island surrounded by deep water
Mombasa 4 cm East African estuary near deep water
Buenos Aires 49 cm Extensive estuary of River Plate, Argentina
Newlyn 15 cm Shallow site on northwest European shelf, England
Southampton 20 cm Shallow site with strong non-linear interactions
Court-town 15 cm Shallow site near Irish Sea amphidrome
Table 2.
Frequency distribution of the wave height, tidal elevation and wind velocity Distribution Fn.
Items Initial variate distribution Extreme distribution Joint PDF Items
Wave height Rayleigh, ß-Rayleigh Gumbel, Weibull etc. Wave direction, Wave period
Tidal elevation (Water level) Double-peak Normal Gumbel, Weibull etc. Tidal currents
Wind velocity Gaussian (Normal) Gumbel, Log-Pearson III etc. Wind direction
본연구에서는국립해양조사원에서제공하는
1
시간간 격의우리나라연안조위자료를이용하여, 64
개분조를조 화분석과정을통하여추출하고, 64
개분조정보를이용하 여관측자료에서천문조성분을제거한비조석성분을추 출하였다. 64
개분조를모두적용한이유는검조소조위 자료에서천문조에의한성분,
천해에서의배조성분등을 모두제거하여순수한비조석성분을추출하고자하는목 적이며,
일반적으로비조석성분추출에범용적으로이용 되는방법이다.
추출된비조석성분의빈도분포함수로쌍 봉형정규분포함수를제안하였으며,
매개변수추정및적 합성검증과정에근거하여제안된확률밀도함수의적용 에대한신뢰성분석을수행하였다.
또한,
제안된확률밀 도함수와비조석성분자료분포함수의불일치를최소화하 는매개변수를추정하여검조소조석자료의비조화상수(
평 균조차등)
와최적추정된매개변수및통계적변수와의 관계를검토·
분석하였다.
2. 분석대상 조위자료의 선정 및 비조석 성분 추출과정
비조석성분자료의빈도분포함수추정은우선우리나라 연안에설치된검조소자료중
,
서해안3
개지점(
인천,
군산,
목포
),
남해안3
개지점(
여수,
마산,
제주),
동해안2
개지점(
포항,
속초),
그리고,
최근부산신항개발사업이진행되고있 는가덕도지점및부산지점을포함,
총10
개지점에대하 여중점적으로수행하였다.
빈도분포함수추정에사용된자 료는국립해양조사원에서제공되는1
시간조위자료를이용하였다
(Table 3
참조).
자료분석에포함된기간은검조소의조화상수및비조화상수추정에사용된기간과동일한기간
으로하였으며
,
조화상수추정에사용된기간의자료가가 용하지않은인천및가덕도는분석기간을동일하게유지 한상태에서다른기간의자료를이용하여분석하였다(
국립 해양조사원Homepage -
조석자료제공시스템).
본연구에서대상으로한검조소자료에서비조석성분 을추출
·
분석하는과정은다음과같으며,
추출된비조석성 분의표준편차및왜곡도계수,
평균해수면정보는Table 3
에제시하였으며,
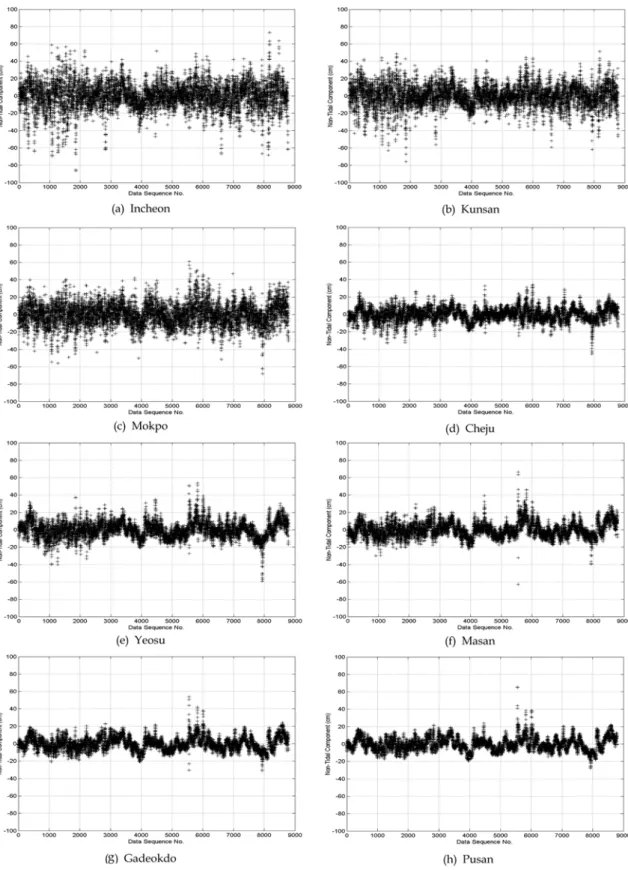
기본적인1
년간의비조석성분의시계 열도시(time-series plot)
및도수분포도(histogram, frequency diagram)
는Fig. 1, Fig. 2
에제시하였다.
제
1
단계:
검조소조위관측자료Plotting :
결측자료및 이상자료[outlier]
검토제
2
단계: 64
개분조를이용한조화분석시행(
분조의진 폭및지각정보도출)
제
3
단계:
조화분석정보를이용하여천문조성분발생(Generation)
제
4
단계:
검조소조위관측자료에서천문조성분을제 거하여비조석성분생성제
5
단계:
비조석성분의발생빈도분석및확률밀도함 수추정(
적합성검증)
제
6
단계:
비조석성분의통계적인분석(
왜곡도계수및 자기상관함수등)
3. 비조석 성분 자료의 확률밀도함수 적합성 검증
비조석성분자료의빈도분포함수를표현하기위한계 급의수
(
k)
는분석자료갯수(
n)
의함수로표현되는관계 식(2)
를이용하여인접한정수로결정하였다(Haldar and
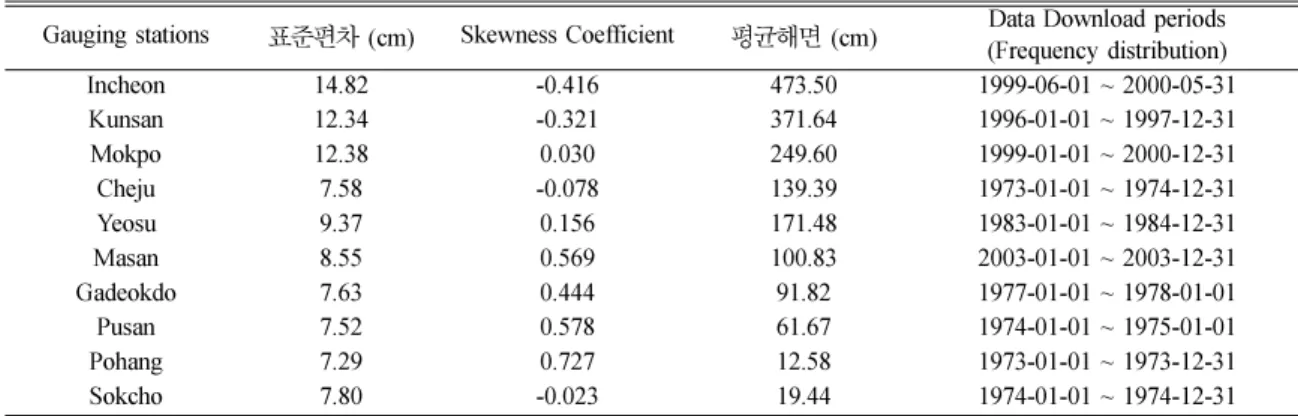
Table 3.
Tidal elevation data and periods of the tidal stations
Gauging stations
표준편차(cm) Skewness Coefficient
평균해면(cm) Data Download periods (Frequency distribution)
Incheon 14.82 -0.416 473.50 1999-06-01 ~ 2000-05-31
Kunsan 12.34 -0.321 371.64 1996-01-01 ~ 1997-12-31
Mokpo 12.38 0.030 249.60 1999-01-01 ~ 2000-12-31
Cheju 7.58 -0.078 139.39 1973-01-01 ~ 1974-12-31
Yeosu 9.37 0.156 171.48 1983-01-01 ~ 1984-12-31
Masan 8.55 0.569 100.83 2003-01-01 ~ 2003-12-31
Gadeokdo 7.63 0.444 91.82 1977-01-01 ~ 1978-01-01
Pusan 7.52 0.578 61.67 1974-01-01 ~ 1975-01-01
Pohang 7.29 0.727 12.58 1973-01-01 ~ 1973-12-31
Sokcho 7.80 -0.023 19.44 1974-01-01 ~ 1974-12-31
(
참고) Skewness
계수의미:
왜곡도계수는분포함수의비대칭성을판단하는계수이다. (-)
값은왼쪽으로더많이분산되어있음을의미하며
, (+)
값은오른쪽으로더많이분산되어있음을의미한다.
또한,
왜곡도의절대치는비대칭성의크기를의미한다.
Fig. 1.
Time-series plot of the non-tidal components.
Fig. 1.
(Continued).
Fig. 2.
Histogram of the non-tidal components.
Fig. 2.
(Continued).
Mahadevan, 2000).
(2)
비조석성분자료의도수분포도
(histogram, frequency diagram)
는뚜렷하게보이지는않으나
,
왜곡도계수에의하면서해 안지점에서는왼쪽으로치우친,
동해안지점에서는오른 쪽으로치우친분포형태를가지고있는것으로판단할수 있다.
반면,
목포,
제주및속초지점은예외적인형태를 보이고있음을알수있다.
조위자료의비조석성분자료의빈도분포함수
(
확률밀도 함수,
pT(x))
는정규분포함수형태(
식(3)
참조)
로도근접한 형태재현이가능하나,
왜곡된형태이기때문에보다복잡 한빈도분포함수를사용하여야함수의형태가적절하게 표현될수있다.
(3)
여기서
,
x=
비조석 성분의값(cm),
AS=
축척변수(scale
parameter)
로식(3)
을모든 구간에서적분할경우의값이
1.0
이라는제약조건을 이용하면 해석적으로 계산되 며,
물리적으로는분석자료의계급간격(class interval)
에 해당한다.
µ=
자료의 평균,
σ=
자료의 표준편차에해 당하는 값이다.
본연구에서는조위분포함수형태로제시한바있는평 균과분산이서로다른
2
개의정규분포함수의합의형태,
즉4
개의매개변수를가진쌍봉형정규분포함수형태를제안 하였다(
식(4)
참조).
보다복잡하고다양한함수에대하여 적용·
검토할수도있으나,
본연구에서는일반적으로널리 사용되는정규분포함수에중점을두어제안하고,
빈도분 포함수에가장적합한매개변수를추정하였다.
(4)
여기서
,
AD=
축척변수로식(2)
에제시된 AS계산과정과 동일하다.
µ1,
µ2=
각각 평균에 해당하는 매개변수,
σ1,
k
= 1.00 + 1.43
⋅ln
( )n= 1.0 + 3.3log
10( )npT( )x AS
σ
2
π--- 1 2---
x µ–
---
σ⎝ ⎠
⎛ ⎞2
– exp
=
pT( ) Ax
2---
D1
σ1
2
π--- 1 2---
x µ–
1σ1
---
⎝ ⎠
⎛ ⎞2
–
⎩
exp
⎨⎧
= 1
σ2
2
π--- 1 2---
x µ–
2σ2
---
⎝ ⎠
⎛ ⎞2
– exp
+
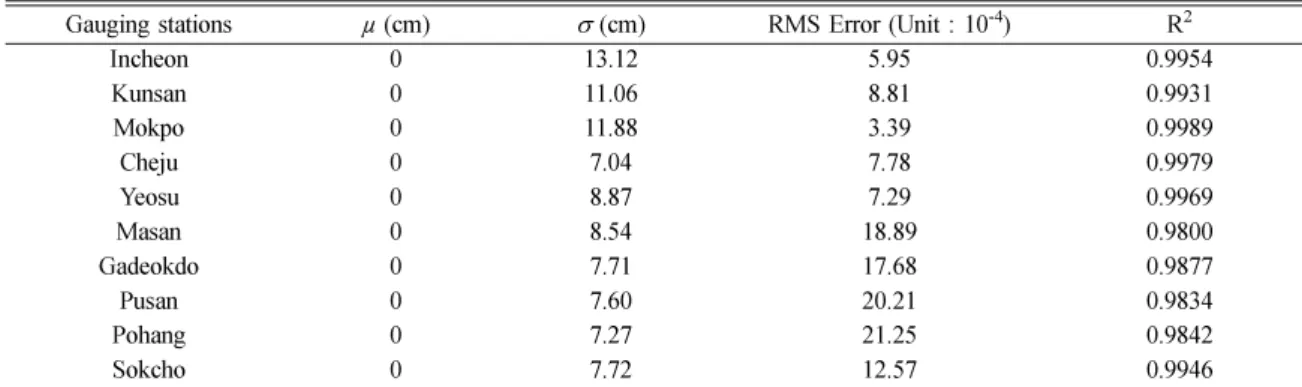
⎭⎬⎫Table 4.
Values of the parameters, RMS errors and R
2(a) Gaussian distribution function
Gauging stations
µ(cm)
σ(cm) RMS Error (Unit : 10
-4) R
2Incheon 0 13.12 5.95 0.9954
Kunsan 0 11.06 8.81 0.9931
Mokpo 0 11.88 3.39 0.9989
Cheju 0 7.04 7.78 0.9979
Yeosu 0 8.87 7.29 0.9969
Masan 0 8.54 18.89 0.9800
Gadeokdo 0 7.71 17.68 0.9877
Pusan 0 7.60 20.21 0.9834
Pohang 0 7.27 21.25 0.9842
Sokcho 0 7.72 12.57 0.9946
(b) Double-peak normal distribution function (Suggested pdf)
Gauging stations
µ1(cm)
µ2(cm) σ
1(cm) σ
2(cm) RMS error (Unit : 10
-4) R
2Incheon 0.3417 0.6869 17.3089 10.2949 1.83 0.9996
Kunsan -0.6928 1.9730 8.3642 15.0536 4.04 0.9985
Mokpo -0.7676 0.6842 10.2798 13.8486 2.23 0.9995
Cheju -0.4081 0.6665 5.79096 8.72879 4.65 0.9992
Yeosu -1.1153 0.9219 7.3570 10.7460 2.46 0.9997
Masan -3.7161 3.6437 6.1199 9.2106 0.52 0.9999
Gadeokdo -3.4614 3.3635 5.9139 7.8563 1.94 0.9999
Pusan -3.6929 3.6988 5.5146 7.6039 0.88 0.9999
Pohang -4.1539 3.9104 5.0944 6.4505 0.25 0.9998
Sokcho -0.0858 0.2507 6.5850 9.1524 11.75 0.9953
범용적으로이용되는
Newton
방법을수정한Levenberg- Marquardt
방법(Bazaraa
등, 1993; Sec. 8.7)
을이용하였 다.
전체적인과정은최소자승법을이용한비선형Curve
Fitting
방법에해당한다.
비조석성분분석에중점적으로사용된
10
개의검조소자료에대하여식(3)
및식(4)
를 이용하여매개변수및확률밀도함수를추정하였다(Table 4
참조
).
본연구에서제안한
2
개의정규분포함수의합의형태 로주어지는빈도분포함수(
쌍봉형정규분포함수; double- peak Gaussian distribution function)
와비조석성분자료의구에서제안된쌍봉형정규분포함수가정규분포함수보 다비조석성분자료의확률밀도함수형태표현이모든지 점에서우수한것으로파악되었다
.
4. 비조석 성분자료 통계정보와 비조화상수의 관계
비조석성분자료를이용하여추정된매개변수는각검 조소의비조화상수와밀접한관련성을보일것으로판단 된다
.
따라서,
국립해양조사원에서제시한검조소의비조 Table 5.Non-tidal constants of the tidal gauging stations
Gauging
stations HWOST
(cm) LWOST
(cm) HWONT
(cm) LWONT
(cm) Spring Range
(cm) Neap Range
(cm) Mean Range
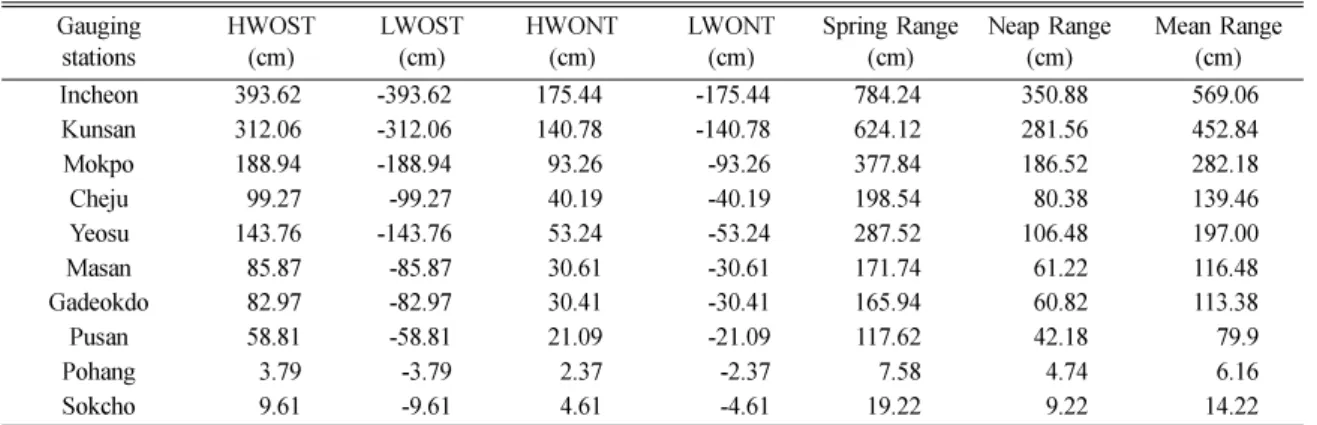
Incheon 393.62 -393.62 175.44 -175.44 784.24 350.88 569.06 (cm)
Kunsan 312.06 -312.06 140.78 -140.78 624.12 281.56 452.84
Mokpo 188.94 -188.94 93.26 -93.26 377.84 186.52 282.18
Cheju 99.27 -99.27 40.19 -40.19 198.54 80.38 139.46
Yeosu 143.76 -143.76 53.24 -53.24 287.52 106.48 197.00
Masan 85.87 -85.87 30.61 -30.61 171.74 61.22 116.48
Gadeokdo 82.97 -82.97 30.41 -30.41 165.94 60.82 113.38
Pusan 58.81 -58.81 21.09 -21.09 117.62 42.18 79.9
Pohang 3.79 -3.79 2.37 -2.37 7.58 4.74 6.16
Sokcho 9.61 -9.61 4.61 -4.61 19.22 9.22 14.22
*HWONT, LWONT, HWOST, LWOST (Datum : Mean Sea Level)
Table 6.
Statistical information and autocorrelation coefficient of the Non-tidal components Gauging
Stations Data Numbers
(1 Hour Interval; 1 Year) Standard
Deviation Skewness Autocorrelation (Lag No, Hour)
1 12 48
Incheon 8,764 14.82 -0.416 0.889 0.360 0.030
Gunsan 8,764 12.34 -0.321 0.831 0.347 0.097
Mokpo 8,764 12.38 0.030 0.750 0.447 0.129
Cheju 8,764 7.58 -0.078 0.928 0.668 0.412
Yeosu 8,764 9.37 0.156 0.950 0.619 0.260
Masan 8,764 8.55 0.569 0.912 0.706 0.430
Gadeokdo 8,764 7.63 0.444 0.951 0.760 0.435
Busan 8,764 7.52 0.578 0.970 0.799 0.413
Pohang 8,764 7.29 0.727 0.993 0.838 0.314
Sokcho 8,764 7.80 -0.023 0.996 0.889 0.445
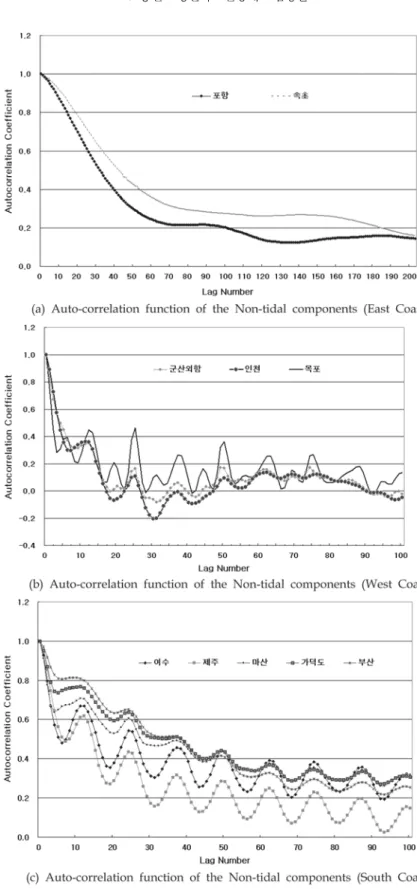
Fig. 3.
Change pattern analysis of the auto-correlation function.
자료의비조화상수와밀접한관계가있는것으로파악되 계를보이고있는것으로파악되었다
.
목포,
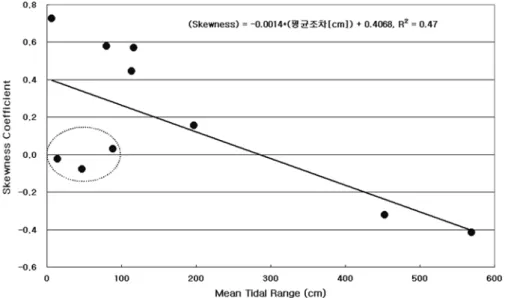
제주및속초Fig. 4.
Relationship between the mean tidal range and skewness coefficient of the non-tidal components.
Fig. 5.
Relationship between the mean tidal range and standard deviation of the non-tidal components.
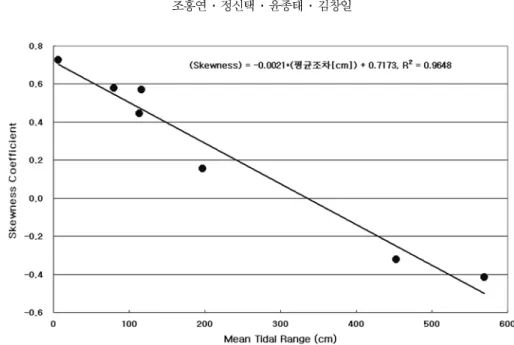
지점은통계적인특성이약간특이한자료로판단되며
,
상 관관계분석에포함할경우에는상관계수가크게감소하 게 된다(Fig. 4-Fig. 7).
영국Newlyn
지점및 항만비 조석성분자료 분석결과에의하면잔차성분(
비조석성 분)
의분포함수가큰음의왜곡도계수를가지는경우보 다양의왜곡도계수를가지는경우가빈번하며,
양의해 일(positive surge)
인경우에는표준편차의5
배를상회하는크기가
1
년에1
회정도발생하고,
음의해일(negative
surge)
인경우에는표준편차의4
배를상회하는크기가2
년에
1
회 정도 발생하는 것으로보고되고 있다(Pugh,
2004).
따라서,
왜곡도계수가평균조차와상관관계를가지는것은다양한해역특성및일시적인자료의특성에 의한영향에기인할수있기때문에
,
보다장기적인자 료,
보다많은검조소자료를이용하여분석할필요가있 Fig. 6.Relationship between the mean tidal range and skewness coefficient of the non-tidal components (except Sokcho, Cheju and
Mokpo gauging stations).
Fig. 7.
Relationship between the mean tidal range and standard deviation of the non-tidal components (except Sokcho, Cheju and
Mokpo gauging stations).
수하게분포형태를재현하는것으로파악되었다
.
한편,
평 균조차와비조석성분의표준편차및왜곡도계수는목포,
속초
,
제주지점을제외하고는강한상관관계를보였으며,
자 기상관함수를분석한결과,
동해안의속초및포항지점에서는비조석성분이큰상관관계
(0.4
이상)
를가진상태에서
50
시간정도지속되는경향을보였으며,
서해안의인 천,
군산지점에서는비조석성분이작은상관관계(0.4
이 하)
를가진상태에서그영향이10
시간이내로제한되는 경향을보였다.
자기상관함수가12~13
시간정도의주기를 보이는경향은검조자료에서반일주조성분등을포함한 천문조의완벽한제거가수행되지못하였기때문인것으 로도추정할수있는바,
조화분석에의한천문조성분의 제거기능을검토하는연구가필요할것으로사료된다.
한 편,
조석주기를포함하는장기간의기상영향으로인하여비 조석성분이조석주기와관련될수있다는심층적인추정 연구도필요할것으로사료된다.
또한,
잔차의상관관계분 석(residual analysis)
을통하여천문조가기상조에미치는 영향(
상호작용등)
을분석하는연구도필요할것으로사료 된다.
비조석성분의표준편차와왜곡도계수의상관성은본 연구에서분석한자료와는통계적인상관성이분명하게나 타났으나
,
보다많은지점의조위자료및보다장기간의자 료를이용·
분석하여비조성성분의장기적인변화특성(
시 기적인특성)
및연안해역의천해효과에의한분석등에 대한연구가필요할것으로사료된다.
따라서,
본연구에 서는비조석성분의통계적인분포형태에중점을두어연 구를수행하였으나,
비조석성분과해역의기상자료와관 련지어통계적인분포를분석하는연구가필요할것으로 판단된다.
감사의 글
본연구는한국과학재단특정기초연구
(R01-2005-000-
11177-0)
지원으로수행되었음.
ear Programming: Theory and Algorithms. Second Edition, John-Wiley & Sons.
Boon, J.D. (2004). Secrets of the Tide, Tide and Tidal Current Analysis and Applications, Storm Surges and Sea Level Trends. Horwood Publishing.
Goda, Y. and Takagi, H. (2000). A reliability design method of caisson breakwaters with optimal wave heights. Coastal Engineering Journal, 42(4), 357-387.
Goda, Y. (2000). Random Seas and Design of Maritime Struc- tures. Advanced Series on Ocean Engineering, 15, World Scientific.
Haldar, A. and Mahadevan, S. (2000). Probability, Reliability and Statistical Methods in Engineering Design. John-Wiley
& Sons.
Kawai, H., Fujisaku, H. and Suzuki, Y. (1996). Occurrence probability of tidal level and its effect on stability of break- water. Proc. of Civil Engineering in the Ocean, JSCE, 12, 261-266 (in Japanese).
Kawai, H., Takayama, T., Suzuki, Y. and Hiraishi, T. (1997).
Failure probability of breakwater caisson for tidal level variation. Report of the Port and Harbor Research Institute, 36(4), 3-41 (in Japanese).
Pugh, D.T. (1987). Tides, Surges and Mean Sea-Level, A Handbook of Engineers and Scientists. John-Wiley & Sons.
Pugh, D.T. (2004). Changing Sea Levels, Effects of Tides, Weather and Climate. Cambridge University Press.
星谷勝
,
石井淸(1986).
構造物の信賴性設計法.
鹿島出版會