Korean Circulation Journal
Introduction
Hypertension (HT) is one of the most common cardiovascular risk factors. Left ventricular hypertrophy (LVH) is frequently encoun- tered in hypertensive patients due to chronic pressure overload.
LVH is an important predictor of mortality and morbidity indepen- dent of other major cardiac risk factors, both in the general popu-
Print ISSN 1738-5520 • On-line ISSN 1738-5555
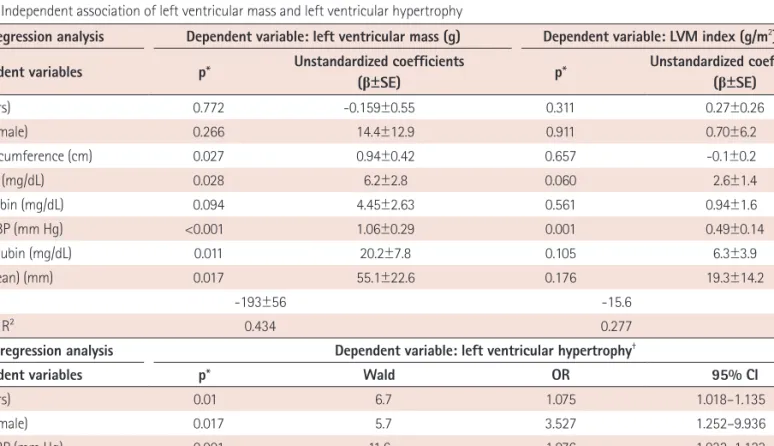
Bilirubin Level is Associated with Left Ventricular Hypertrophy Independent of Blood Pressure
in Previously Untreated Hypertensive Patients
Teslime Ayaz, MD 1 , Murtaza Emre Durakog ˘ lugil, MD 2 , Sinan Altan Kocaman, MD 2 , Tug ˘ ba Durakog ˘ lugil, MD 3 , Turan Erdog ˘ an, MD 2 , Osman Zikrullah S¸ahin, MD 1 , Serap Baydur S¸ahin, MD 1 , Yüksel C¸ic¸ek, MD 2 , and Ömer S¸atirog ˘ lu, MD 2
1