• 검색 결과가 없습니다.

Deoxyribonucleic Acid Copy Number Aberrations in Vasospastic Angina Patients Using an Array Comparative Genomic Hybridization

N/A
N/A
Protected

Academic year: 2022

Share "Deoxyribonucleic Acid Copy Number Aberrations in Vasospastic Angina Patients Using an Array Comparative Genomic Hybridization"

Copied!
9
0
0

로드 중.... (전체 텍스트 보기)

전체 글

(1)

385

Open Access

Deoxyribonucleic Acid Copy Number Aberrations in Vasospastic Angina Patients Using an Array Comparative Genomic Hybridization

Suk Min Seo, MD

1

, Yoon Seok Koh, MD

1

, Hae Ok Jung, MD

1

, Jin Soo Choi, MD

2

, Pum Joon Kim, MD

1

, Sang Hong Baek, MD

1

, Ho-Joong Youn, MD

1

, Kweon-Haeng Lee, MD

3

, and Ki-Bae Seung, MD

1

1

Cardiovascular Center and Cardiology Division,

2

Catholic Neuroscience Center,

3

Department of Pharmacology, College of Medicine, The Catholic University of Korea, Seoul, Korea

ABSTRACT

Background and Objectives: Vasospastic angina (VA) is a specific type of coronary artery disease and develops as a result of coronary artery spasm. Recently, a few studies have revealed that VA caused by coronary artery spasm is related to genetic traits. The objective of this study was to use the recently developed technique of array comparative genomic hybridization (CGH) to screen the genetic aberrations of VA. Subjects and Methods: To identify candidate genes that might be causally involved in the pathogenesis of VA, genomic deoxyribonucleic acids were extracted from whole blood of 28 patients with VA who presented at Department of Cardiology at Seoul St. Mary’s Hospital, Seoul, Korea. The copy number profiles of these patients was then analyzed using array CGH and reverse transcriptase (RT) quantitative polymerase chain reaction (PCR).

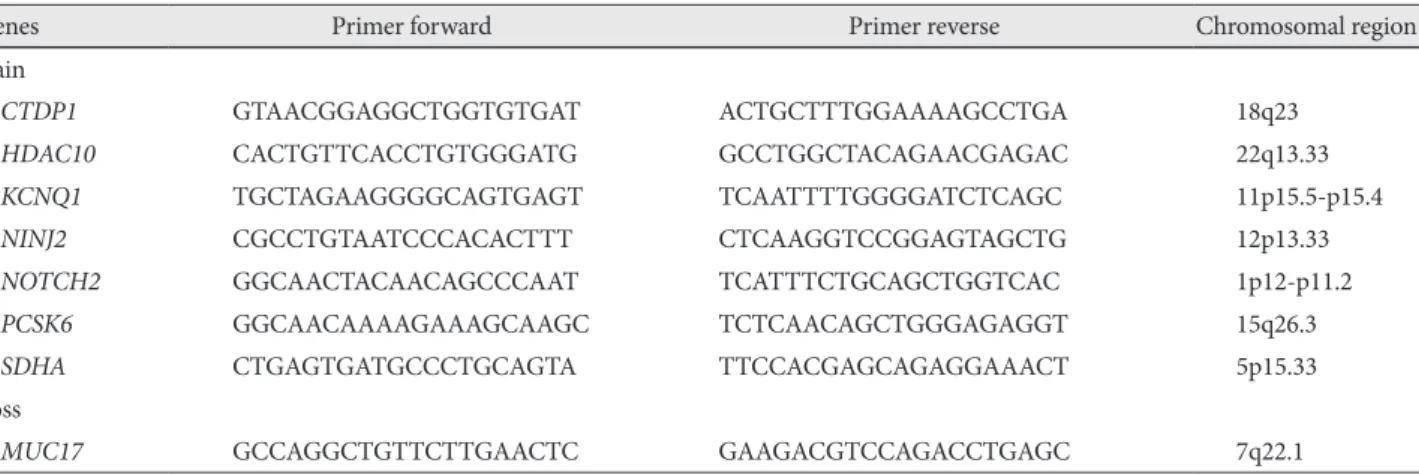
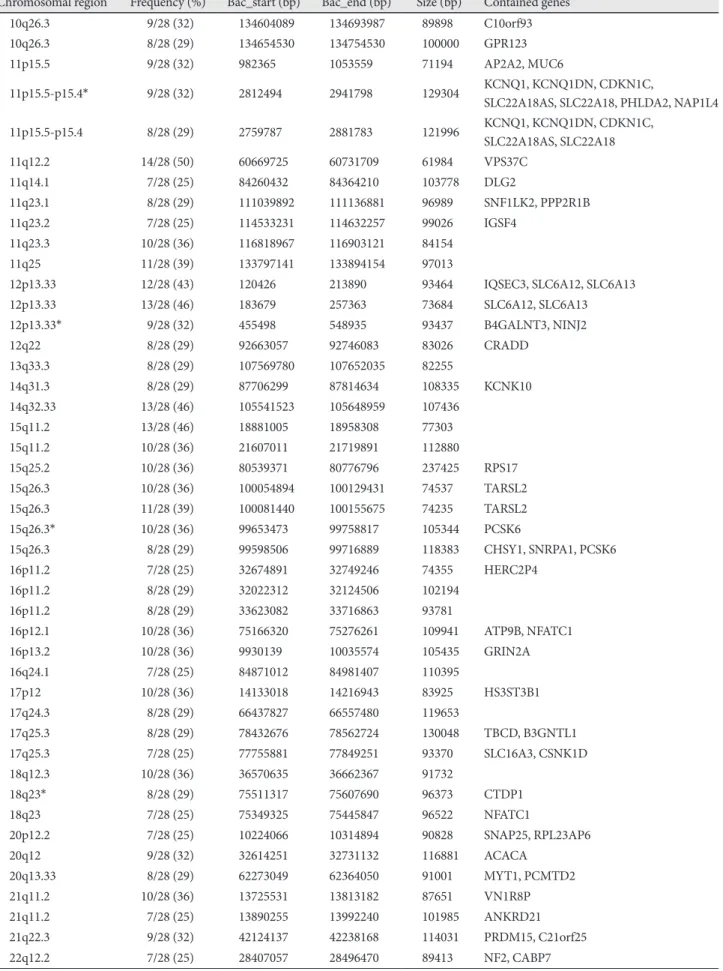
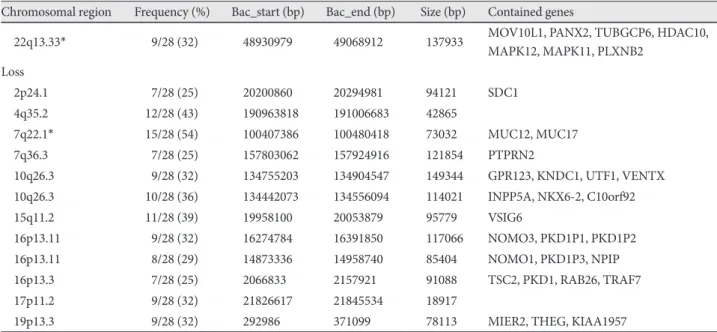
Results: Array CGH revealed gains in 31 different regions, with losses in the 4q35.2, 7q22.1, 10q26.3, 15q11.2, 16p13.11, 17p11.2 and 19q13.3 regions (more than 32% aberration in these regions). Several loci were found to be frequently including gains of 5p and 11q (50% of samples). The most common losses were found in 7q (54% of samples). Copy number aberrations in chromosomal regions were detected and corresponding genes were confirmed by RT quantitative PCR. The fold change levels were highest in the CTDP1 (18q23), HDAC10 (22q13.33), KCNQ1 (11p15.5-p15.4), NINJ2 (12p13.33), NOTCH2 (1p12-p11.2), PCSK6 (15q26.3), SDHA (5p15.33), and MUC17 (7q22.1) genes. Conclusion: Many candidate chromosomal regions that might be related to the pathogenesis of VA were detected by array CGH and should be systematically investi- gated to establish the causative and specific genes for VA. (Korean Circ J 2011;41:385-393)

KEY WORDS: Array comparative genomic hybridization; Vasospastic angina.

Received: September 10, 2010 Revision Received: November 5, 2010 Accepted: December 16, 2010

Correspondence: Hae Ok Jung, MD, Cardiovascular Center and Car- diology Division, College of Medicine, The Catholic University of Korea, 505 Banpo-dong, Seocho-gu, Seoul 137-040, Korea

Tel: 82-2-2258-1302, Fax: 82-2-591-1506 E-mail: [email protected]

• The authors have no financial conflicts of interest.

cc

This is an Open Access article distributed under the terms of the Cre- ative Commons Attribution Non-Commercial License (http://creativecom- mons.org/licenses/by-nc/3.0) which permits unrestricted non-commer- cial use, distribution, and reproduction in any medium, provided the origi- nal work is properly cited.

Introduction

Vasospastic angina (VA), also called Prinzmetal’s angina or variant angina, is a specific type of coronary artery disease and is developed due to not atherosclerosis but coronary artery spasm. This disease can cause acute coronary syndrome, in- cluding acute myocardial infarction, ventricular tachycardia,

fibrillation or electro mechanical dissociation, and even sud- den cardiac death.

1)

The incidence of VA is higher in Asians than Caucasians or Blacks,

2)3)

which strongly suggests that ge- netic traits might be involved in the pathogenesis of VA.

4-11)

Studies have shown that the loss of Kir6.1 {pore-forming

inwardly rectifying K

+

(Kir) channel subunit} or SUR2 (sulfo-

nylurea receptor regulatory subunit of K

ATP

channel) by re-

lated gene deletions in mice induced VA.

4)5)

So far, only these

two genes have been shown to be associated with gene copy

number alterations. Other investigations showed gene poly-

morphisms

6-8)

and functional expression

9-11)

in VA. Related

gene polymorphisms in VA included an endothelial nitric

oxide synthase gene,

6)

adrenergic receptor gene,

7)

and the pa-

raoxonase 1 gene.

8)

The Rho-associated kinase gene

9)

and se-

rotonin receptor (5-HT

1Dβ

) gene

10)11)

were also shown to be re-

lated to VA by their functional expression. To date, there have

been no studies on deoxyribonucleic acid (DNA) copy num-

ber alterations in the whole human genome among patients

(2)

with VA. The recent development of array-comparative ge- nomic hybridization (CGH) provides a means to quantita- tively measure DNA copy number aberrations and to map them directly to genomic sequences.

12-14)

Also, tiling resolu- tion DNA microarrays comprised of large-insert genomic clones such as bacterial artificial chromosomes (BACs) are a very useful and accurate method for detecting genomic ab- errations in many genetic diseases.

15)16)

Furthermore, array- CGH with BAC clones, has been proven to be a very useful and accurate tool for detecting genomic aberrations in whole blood samples for schizophrenia, epilepsy and mental retar- dation,

17-19)

as well as in tissue from some cancers.

20-24)

Both fluorescence in situ hybridization (FISH) and real-time poly- merase chain reaction (RT-PCR) have also been applied em- pirically to confirm array-CGH results.

17)18)21-24)

In the study presented here, we analyzed genomic DNA copy number aberrations in whole blood from 28 patients with VA using array CGH. Genetic aberrations, for a subset of gain- ed or lost gene, were confirmed by RT-PCR.

Subjects and Methods

Clinical description

Peripheral blood samples were collected from 28 patients with VA at the Department of Cardiology at Seoul St. Mary’s Hospital, Seoul, Korea. In this study, the diagnosis of VA was made when patients met all of the following criteria: 1) re- petitive burning or squeezing retrosternal chest pain, 2) def- inite positive response by coronary angiography with intra coronary acetylcholine provocation test, 3) no significant athe- rosclerotic stenosis in coronary artery (<50% narrowing of the coronary luminal diameter) according to quantitative co- ronary angiography. Blood samples were collected from 8 women and 20 men, aged 34-71 years (mean age±standard deviation, 56.44±11.4 in years). The clinical characteristics of the patients are shown in Table 1. Genomic DNA was extr- acted using a Puregene DNA isolation kit (Qiagen, Hilden, Germany). Reference DNA was pooled from 10 gender-mat- ched (male), normal, healthy control subjects. All patients gave written informed consent to participate in this study. The pro- tocol of this study was approved by the institutional review board of Seoul St. Mary’s Hospital, The Catholic University of Korea.

Array comparative genomic hybridization

Array CGH analyses were conducted on 28 individual sam- ples using commercial MACArray

TM

Karyo 4K BAC-chips (Macrogen, Seoul, Korea) with 4,030 BAC clones, in dupli- cate, on the whole human genome with a resolution of about 1 Mbp. Array CGH was performed as described previous- ly.

25)

Briefly, 500-700 ng target and reference DNAs were de- natured in the presence of random primer and reaction buf-

fer (BioPrime

®

DNA Labeling System, Invitrogen, Carlsbad, CA, USA) at 98-100°C for 5 minutes, and then cooled on ice for 5 minutes. The denatured DNA was differentially labeled with 3 μL of 1 mM Cy3- and Cy5-conjugated dCTP by ran- dom primed labeling (Perkin Elmer, Waltham, MA, USA).

The mixture was incubated with a Klenow fragment at 37°C overnight. After labeling, unincorporated nucleotides were removed using MicroSpin

TM

G-50 columns (Amersham Bio- sciences, Buckinghamshire, UK). Cy3- and Cy5-labeled test DNA and reference DNA were mixed with 50 μL of human Cot-1 DNA for blocking of repeat sequences. After purifica- tion, this mixture was resolved in hybridization buffer (Mac- rogen) containing yeast tRNA for blocking of non-specific nu- cleotides binding.

After the MACArray

TM

-Karyo 4K BAC-chip was prehy- bridized in hybridization buffer with salmon sperm DNA for 1 hour, chips were hybridized with the purification mix- ture. It was then incubated for 72 hours in the 37°C hybridiz- ation chamber (BioMicro systems, Salt Lake City, UT, USA).

After hybridization was complete, array chips were washed in 50% formamide-2x SSC at 46°C for 15 minutes, and 0.1%

SDS-2x SSC at 46°C for 30 minutes. Next, the chips were wa- shed in 50% sodium phosphate-0.1% NP40 for 15 minutes followed by washing with 2x SSC for 15 minutes at room temperature. After spin drying, hybridized arrays were scann- ed with a Genepix

TM

(Axon Instruments, Sunnyvale, CA, USA).

Data analysis

Raw signal intensities from the arrays were measured us- ing the MAC Viewer v1.6.3 software (Macrogen). Log

2

(Cy3 intensity/Cy5 intensity ratios) were normalized by using the median of fluorescence ratios computed from the houseke- eping DNA control fragments linearly distributed across the genome. Measurements flagged as unreliable by MAC Vie- wer v1.6.3 were removed from subsequent analysis. The th- reshold corresponds to 2 standard deviation (SD) values from the mean. The information on each individual clone was ob- tained from the UCSC Genome Bioinformatics database (May 2004 freeze, http://genome.ucsc.edu).

Reverse transcriptase quantitative polymerase chain reaction

To confirm the level of genomic imbalances identified by Table 1. The clinical characteristics of patients with vasospastic angina

Characteristic Value

Number of samples 28

Age, mean±standard deviation (years) 56.4±11.4

Male (%) 20 (71.4)

Current smoker (%) 11 (39.3)

Current alcohol drinking (%) 14 (50)

(3)

array CGH in this study, DNA samples with obvious ge- nomic changes were analyzed using RT quantitative PCR.

26)

The reaction was performed in a total volume of 50 μL, incl- uding 25 μL of 2x IQ

TM

SYBR

®

green supermix (Bio-Rad, Hercules, CA, USA), 10 ng of DNA, and 10 pmol of each pri- mer.

27)

Forty cycles of amplification, data acquisition, and data analysis were performed in an iCycler (Bio-Rad). Prim- ers for eight genes (CTDP1, HDAC10, KCNQ1, NINJ2, NOTCH2, PCSK6, SDHA, and MUC17) were selected and the position of each clone was obtained from the UCSC ge- nome database (Table 2). The relative genomic copy number was calculated using the comparative CT Method.

28)

GAPDH was used as an endogenous reference.

28-30)

Results

Genomic deoxyribonucleic acid copy number changes and pattern of aberrations

Chromosomal copy number changes were detected by ar- ray-CGH in VA. Copy number changes were presented as in- dividual chromosome plots of log

2

ratio of normalized Cy3 : Cy5 intensities versus chromosome regions for each of the in- dividual 28 cases of VA. Table 3 shows the frequency of ab- erration, ranging from 7 (25% of chromosomal gain and loss) to 15 (54% of chromosomal loss at 7q) in 28 samples. Over- all, the individual chromosomal aberration pattern was not random and tended to be consistent, showing DNA gains in 1p, 1q, 2p, 2q, 3p, 3q, 4p, 4q, 5p, 5q, 6p, 6q, 7q, 8p, 8q, 9q, 10p, 10q, 11p, 11q, 12q, 13q, 14q, 15q, 16p, 16q, 17p, 17q, 18q, 20p, 20q, 21q, and 22q; and showing DNA losses in 2p, 4q, 7q, 10q, 15q, 16p, 17p, and 19p. DNA gains, rather than DNA losses, were more frequently observed. The most fre- quent gain detected was at 5p15.33, and 11q12.2 (50%). Fre- quent DNA gains also were observed in 12p13.33, 14q32.33, and 15q11.2 in 13 samples (46%), and in 12p13.33 (43%), 1p12-p11.2, 4p15.1, 8q22.2, 11q25, and 15q26.3 in 11 samples (39%). Frequent gains (36%) were located at: 1q44, 3q24, 11q23.3, 15q11.2, 15q25.2, 15q26.3, 16p12.1, 16p13.2, 17p12,

18q12.3, and 21q11.2. Other regions with 25-32% frequency of DNA gains included 1p12-p11.2, 1p12, 1p21.1, 2p11.2, 2q21.2-q21.3, 2q22.1, 2q23.3, 2q31.1, 2q37.3, 3p14.1, 3q12.3, 4p15.1, 4p15.2, 4q24, 4q32.3, 4q34.3, 4q35.2, 5p12, 5p15.2, 5p15.33, 5q15, 6p12.2, 6q24.1, 7q11.23, 7q22.2, 8p23.3, 8q24.3, 9q22.1, 9q22.32, 9q33.3, 10p15.3, 10q11.23, 10q23.1, 10q26.3, 11p15.5, 11p15.5-p15.4, 11q14.1, 11q23.1, 11q23.2, 12p13.33, 12q22, 13q33.3, 14q31.3, 15q26.3, 16p11.2, 16q24.1, 17q24.3, 17q25.3, 18q23, 20p12.2, 20q12, 20q13.33, 21q11.2, 21q22.3, 22q12.2, and 22q13.33. The most com- mon genomic losses were observed in 7q22.1 (54%), 4q35.2 (43%), and 15q11.2 (39%), 10q26.3 (36%). Other regions with 25-32% frequency of DNA losses included 2p24.1, 7q36.3, 10q26.3, 16p13.11, 16p13.3, 17p11.2, and 19p13.3 (Table 3).

Fig. 1 shows chromosomal aberration regions. 1p12-p11.2, 5p15.33, 11p15.5-p15.4, 12p13.33, 15q26.3, 18q23, and 22q13.33 contained CTDP1, HDAC10, KCNQ1, NINJ2, NOTCH2, PCSK6, and SDHA genes (gained regions), while loss region 7q22.1 contained MUC17 gene.

Result according to reverse transcriptase quantitative polymerase chain reaction

To confirm the array CGH results, differential fold change was evaluated by RT quantitative PCR in VA samples. The re- sults showed chromosomal fold changes in CTDP1 (18q23), HDAC10 (22q13.33), KCNQ1 (11p15.5-p15.4), NINJ2 (12p 13.33), NOTCH2 (1p12-p11.2), PCSK6 (15q26.3), SDHA (5p15.33), and MUC17 (7q22.1). Fig. 2 shows the RT PCR results. In gained regions of 7 genes, {CTDP1, HDAC10, KCNQ1, NINJ2, NOTCH2, PCSK6, and SDHA (A-G)}, the relative fold increases in RT quantitative PCR corresponded with array-CGH results. In MUC17 (H), the decrease in fold differences noted by RT quantitative PCR was similar to that seen with array-CGH. The N-value was delineated in RT PCR.

The results compared linear-ratios in array-CGH, were de- monstrated generally larger by RT quantitative PCR analysis than those by array-CGH analysis.

Table 2. Primer pairs used for reverse transcriptase quantitative polymerase chain reaction analysis

Genes Primer forward Primer reverse Chromosomal region

Gain

CTDP1 GTAACGGAGGCTGGTGTGAT ACTGCTTTGGAAAAGCCTGA 18q23

HDAC10 CACTGTTCACCTGTGGGATG GCCTGGCTACAGAACGAGAC 22q13.33

KCNQ1 TGCTAGAAGGGGCAGTGAGT TCAATTTTGGGGATCTCAGC 11p15.5-p15.4

NINJ2 CGCCTGTAATCCCACACTTT CTCAAGGTCCGGAGTAGCTG 12p13.33

NOTCH2 GGCAACTACAACAGCCCAAT TCATTTCTGCAGCTGGTCAC 1p12-p11.2

PCSK6 GGCAACAAAAGAAAGCAAGC TCTCAACAGCTGGGAGAGGT 15q26.3

SDHA CTGAGTGATGCCCTGCAGTA TTCCACGAGCAGAGGAAACT 5p15.33

Loss

MUC17 GCCAGGCTGTTCTTGAACTC GAAGACGTCCAGACCTGAGC 7q22.1

(4)

Table 3. Recurrent gains/losses in spasms {>7 (25%) frequencies}

Chromosomal region Frequency (%) Bac_start (bp) Bac_end (bp) Size (bp) Contained genes Gain

1p12-p11.2* 11/28 (39) 120390109 120485103 94994 NOTCH2

1p12-p11.2 8/28 (29) 120214296 120390114 175818 ADAM30, NOTCH2

1p12 8/28 (29) 118491301 118584699 93398 SPAG17

1p21.1 8/28 (29) 103961840 103992000 30160 AMY2A

1q44 10/28 (36) 246886515 246967485 80970 OR5BU1

2p11.2 7/28 (25) 86071614 86160853 89239 POLR1A

2q21.2-q21.3 8/28 (29) 134702634 134804417 101783 MGAT5

2q22.1 7/28 (25) 139564813 139702127 137314

2q23.3 8/28 (29) 150646532 150741461 94929

2q31.1 8/28 (29) 177310814 177395162 84348 FUCA1P

2q37.3 7/28 (25) 240550837 240713841 163004 NDUFA10, OR6B2, OR6B3, OR5S1P

3p14.1 8/28 (29) 67409363 67499993 90630

3q12.3 8/28 (29) 103624911 103710584 85673 ZPLD1

3q24 10/28 (36) 149871152 149960984 89832 RPL38P1, AGTR1

4p15.1 11/28 (39) 29961339 30093505 132166

4p15.1 7/28 (25) 28058051 28175610 117559

4p15.2 8/28 (29) 26883925 26969030 85105

4p15.2 8/28 (29) 24962384 25050952 88568 ZCCHC4, ANAPC4

4q24 8/28 (29) 105045356 105165560 120204

4q32.3 7/28 (25) 167945985 168033177 87192 SPOCK3

4q34.3 8/28 (29) 182485709 182565328 79619

4q34.3 7/28 (25) 181814958 181921046 106088

4q35.2 7/28 (25) 190457567 190574280 116713

4q35.2 8/28 (29) 190712135 190794324 82189

5p12 8/28 (29) 44338589 44428186 89597 FGF10

5p15.2 8/28 (29) 12789319 12879576 90257

5p15.33 9/28 (32) 388661 566921 178260 AHRR, EXOC3, SLC9A3

5p15.33* 7/28 (25) 203859 298137 94278 SDHA

5p15.33 14/28 (50) 557250 688780 131530 SLC9A3, CEP72

5q15 7/28 (25) 57292374 57392374 100000 DNHD2

6p12.2 9/28 (32) 51985699 52087584 101885 PKHD1

6q24.1 8/28 (29) 142584814 142703619 118805 GPR126

7q11.23 9/28 (32) 74705985 74764828 58843

7q22.2 8/28 (29) 105177490 105254527 77037 ATXN7L4

8p23.3 7/28 (25) 1289245 1436212 146967

8p23.3 8/28 (29) 649638 867290 217652 ERICH1, C8orf68

8q22.2 11/28 (39) 99509647 99629754 120107 KCNS2, STK3

8q24.3 9/28 (32) 145298570 145384455 85885

9q22.1 7/28 (25) 90613288 90692980 79692

9q22.32 7/28 (25) 97170096 97284468 114372 PTCH

9q33.3 9/28 (32) 128260025 128347240 87215 C9orf28

10p15.3 9/28 (32) 795549 881206 85657 LARP5

10q11.23 7/28 (25) 52453706 52563182 109476 PRKG1

10q23.1 9/28 (32) 86354131 86459920 105789

10q26.3 8/28 (29) 133716279 133869047 152768 C10orf39, DPYSL4

(5)

Table 3. Continued

Chromosomal region Frequency (%) Bac_start (bp) Bac_end (bp) Size (bp) Contained genes

10q26.3 9/28 (32) 134604089 134693987 89898 C10orf93

10q26.3 8/28 (29) 134654530 134754530 100000 GPR123

11p15.5 9/28 (32) 982365 1053559 71194 AP2A2, MUC6

11p15.5-p15.4* 9/28 (32) 2812494 2941798 129304 KCNQ1, KCNQ1DN, CDKN1C,

SLC22A18AS, SLC22A18, PHLDA2, NAP1L4 11p15.5-p15.4 8/28 (29) 2759787 2881783 121996 KCNQ1, KCNQ1DN, CDKN1C,

SLC22A18AS, SLC22A18

11q12.2 14/28 (50) 60669725 60731709 61984 VPS37C

11q14.1 7/28 (25) 84260432 84364210 103778 DLG2

11q23.1 8/28 (29) 111039892 111136881 96989 SNF1LK2, PPP2R1B

11q23.2 7/28 (25) 114533231 114632257 99026 IGSF4

11q23.3 10/28 (36) 116818967 116903121 84154

11q25 11/28 (39) 133797141 133894154 97013

12p13.33 12/28 (43) 120426 213890 93464 IQSEC3, SLC6A12, SLC6A13

12p13.33 13/28 (46) 183679 257363 73684 SLC6A12, SLC6A13

12p13.33* 9/28 (32) 455498 548935 93437 B4GALNT3, NINJ2

12q22 8/28 (29) 92663057 92746083 83026 CRADD

13q33.3 8/28 (29) 107569780 107652035 82255

14q31.3 8/28 (29) 87706299 87814634 108335 KCNK10

14q32.33 13/28 (46) 105541523 105648959 107436

15q11.2 13/28 (46) 18881005 18958308 77303

15q11.2 10/28 (36) 21607011 21719891 112880

15q25.2 10/28 (36) 80539371 80776796 237425 RPS17

15q26.3 10/28 (36) 100054894 100129431 74537 TARSL2

15q26.3 11/28 (39) 100081440 100155675 74235 TARSL2

15q26.3* 10/28 (36) 99653473 99758817 105344 PCSK6

15q26.3 8/28 (29) 99598506 99716889 118383 CHSY1, SNRPA1, PCSK6

16p11.2 7/28 (25) 32674891 32749246 74355 HERC2P4

16p11.2 8/28 (29) 32022312 32124506 102194

16p11.2 8/28 (29) 33623082 33716863 93781

16p12.1 10/28 (36) 75166320 75276261 109941 ATP9B, NFATC1

16p13.2 10/28 (36) 9930139 10035574 105435 GRIN2A

16q24.1 7/28 (25) 84871012 84981407 110395

17p12 10/28 (36) 14133018 14216943 83925 HS3ST3B1

17q24.3 8/28 (29) 66437827 66557480 119653

17q25.3 8/28 (29) 78432676 78562724 130048 TBCD, B3GNTL1

17q25.3 7/28 (25) 77755881 77849251 93370 SLC16A3, CSNK1D

18q12.3 10/28 (36) 36570635 36662367 91732

18q23* 8/28 (29) 75511317 75607690 96373 CTDP1

18q23 7/28 (25) 75349325 75445847 96522 NFATC1

20p12.2 7/28 (25) 10224066 10314894 90828 SNAP25, RPL23AP6

20q12 9/28 (32) 32614251 32731132 116881 ACACA

20q13.33 8/28 (29) 62273049 62364050 91001 MYT1, PCMTD2

21q11.2 10/28 (36) 13725531 13813182 87651 VN1R8P

21q11.2 7/28 (25) 13890255 13992240 101985 ANKRD21

21q22.3 9/28 (32) 42124137 42238168 114031 PRDM15, C21orf25

22q12.2 7/28 (25) 28407057 28496470 89413 NF2, CABP7

(6)

Table 3. Continued

Chromosomal region Frequency (%) Bac_start (bp) Bac_end (bp) Size (bp) Contained genes

22q13.33* 9/28 (32) 48930979 49068912 137933 MOV10L1, PANX2, TUBGCP6, HDAC10, MAPK12, MAPK11, PLXNB2

Loss

2p24.1 7/28 (25) 20200860 20294981 94121 SDC1

4q35.2 12/28 (43) 190963818 191006683 42865

7q22.1* 15/28 (54) 100407386 100480418 73032 MUC12, MUC17

7q36.3 7/28 (25) 157803062 157924916 121854 PTPRN2

10q26.3 9/28 (32) 134755203 134904547 149344 GPR123, KNDC1, UTF1, VENTX 10q26.3 10/28 (36) 134442073 134556094 114021 INPP5A, NKX6-2, C10orf92

15q11.2 11/28 (39) 19958100 20053879 95779 VSIG6

16p13.11 9/28 (32) 16274784 16391850 117066 NOMO3, PKD1P1, PKD1P2

16p13.11 8/28 (29) 14873336 14958740 85404 NOMO1, PKD1P3, NPIP

16p13.3 7/28 (25) 2066833 2157921 91088 TSC2, PKD1, RAB26, TRAF7

17p11.2 9/28 (32) 21826617 21845534 18917

19p13.3 9/28 (32) 292986 371099 78113 MIER2, THEG, KIAA1957

*Verified by reverse transcriptase polymerase chain reaction

Control (XX/XY) 1p35.3 1p12-p11.2

1p22.1 5p15.33

Chr1

Chr11

Chr18 Chr7

Chr15 Chr1-22, X, Y

7q11.1 0.6 0.4 0.2 0.0 -0.2 -0.4 -0.6 -0.8

0.6 0.4

0.2 0.0

-0.2 -0.4 0.6

0.4 0.2

0.0 -0.2

-0.4

0.6

0.4 0.2

0.0 -0.2

-0.4

0.6 0.4

0.2 0.0

-0.2 -0.4

0.6 0.4

0.2 0.0

-0.2 -0.4 0.8 0.6 0.4 0.2 0.0 -0.2 -0.4

0.8 0.6 0.4 0.2 0.0 -0.2 -0.4 15q11.1

15q11.2

15q21.3

7q36.3

15q26.3

Fig. 1. Array comparative genomic hybridization (CGH) results. Average log

2

ratios (Y axis) of each chromosomal region at 1p, 5p, 7q, 11p, 12p, 15q, 18q and 22q (X axis) show differences in copy number in spasm patients. Internal control (XX/XY) was used to detect genomic imbal- ances. Note the high-level aberrations (arrowed spots) on chromosomes.

15q26.3 7q22.1

1p36.33

11p15.5

18q11.1 18q12.1

18q12.3 18q21.2

18q21.32 18q23 11p15.5-p15.4

1p11.1

11p11.11

18q23

5p11

12p11.1

22q13.33 5p15.33

12p11.11

22p11.1

22q11.1 22q12.2 22q13.33 22q13.31 12p13.33

12p13.31 12p12.3 Chr5

Chr12

Chr22 X Chr

Y Chr

(7)

Discussion

Several methods including classical cytogenetics, FISH, Southern blot analysis, metaphase CGH, and array CGH have been used to detect DNA copy number changes.

23)

Lately,

array CGH has been shown to be a powerful tool for detect- ing genetic aberrations and genetic mapping, and offers high resolution, high-throughput, accuracy, and sensitivity for genetic analysis.

12-14)

It also allows the simultaneous quanti- tative analysis of all regions of a large genome,

25)

and can pro-

Fig. 2. Relative fold differences selected from 8 genes showed that the most frequent gains and losses detected were at 1p, 5p, 7q, 11p, 12p, 15q, 18q and 22q region. Each sample is depicted (X axis) and the fold difference of N-value was delineated in RT PCR (Y axis). A threshold level of 2 (N-value) indicates significant DNA gain (A-G), and 0.5 (N-value) indicates significant DNA loss (H). RT: reverse tran- scriptase, PCR: polymerase chain reaction, DNA: deoxyribonucleic acid.

6 5 4 3 2 1 0

5

4

3

2

1

0

4

3

2

1

0

6 5 4 3 2 1 0

6 5 4 3 2 1 0

6 5 4 3 2 1 0

7 6 5 4 3 2 1 0

1.2 1.0 4 3 2 1 0 C sm-2 sm-6 sm-9 sm-13 sm-15 sm-19 sm-23 sm-25

C sm-6 sm-9 sm-18 sm-19 sm-21 sm-22 sm-23 sm-25 sm-26

C sm-1 sm-6 sm-9 sm-10 sm-11 sm-13 sm-17 sm-23 sm-24 sm-25 sm-26

C sm-6 sm-9 sm-12 sm-18 sm-21 sm-22 sm-23

C sm-2 sm-6 sm-9 sm-18 sm-21 sm-22 sm-23 sm-25 sm-26

C sm-5 sm-8 sm-9 sm-12 sm-13 sm-15 sm-19 sm-21 sm-27

C sm-2 sm-9 sm-12 sm-13 sm-19 sm-21 sm-22 sm-23 sm-25 sm-26

C sm-1 sm-2 sm-3 sm-4 sm-5 sm-6 sm-11 sm-14 sm-15 sm-16 sm-18 sm-20 sm-21 sm-23 sm-24 CTDP1

KCNQ1

NOTCH2

SDHA

HDAC10

NINJ2

PCSK6

MUC17

A

C

E

G

B

D

F

H

(8)

vide quantitative information at the level of chromosomal gain or loss.

21)

Although the confirmation of array-CGH results is usually performed by FISH analysis, this technique has several limi- tations. For example, evaluation of the full extent of genetic gains or losses in the genome requires obtaining metaphase DNA and interpretion of karyotypes that are often complex and require prior knowledge or markers of sites of interest.

2)

Many recent studies have shown that RT quantitative PCR instead of FISH is also a very useful and accurate technique for the confirmation of array-CGH results,

17)18)21-24)

thus mak- ing it particularly attractive technique for the identification of acquired genetic aberrations in whole blood from patients with VA. Therefore, we used RT quantitative PCR for the con- firmation and quantification of the identified genomic aberra- tions.

In this study, using array CGH, we have showed than there are genetic aberrations and altered genes related to VA. The DNA aberrations had a tendency to be located at rather spe- cific chromosomal regions. Ulike amplification of oncogenes or deletions of tumor suppressor genes

21-24)

there were no spe- cific genes amplified or deleted in VA in our study. However, many DNA copy number aberrations (91 DNA gains and 12 DNA losses) were detected. These DNA copy number aber- rations were novel and different from those previously de- tected in the Korean population (DNA gains in 6p21.2 and DNA loses in 1p36.31, 4q13.1-4q22.13, 16p12.1, 21q22.3, and 22q11.22).

31)

This showed that many genetic alterations might be associated with the pathogenesis of VA.

Because array CGH shows genetic aberrations at the ge- nomic DNA level and not at the messenger RNA or protein levels, many chromosomal regions which might be related to the pathogenesis of VA were found in this study. For ex- ample, the KCNQ1 gene, one of the genes analyzed by RT quantitative PCR,

27)

is translated into the potassium voltage- gated channel subfamily KQT member1, which is probably related to cardiac repolarization (www.ihop-net.org/Uni- Pub/iHOP). Also, the NOTCH2 gene, another one of the genes analyzed by RT quantitative PCR, is translated into neurogenic locus notch homolog protein 2 precursors;

notch homolog protein 2 is a receptor for the membrane- bound ligands involved in regulation of cell-fate determina- tion (www.ihop-net.org/UniPub/iHOP). However, the func- tion of the proteins translated by these genes has not been completely clarified, so definite pathogenesis of VA cannot be established based on our results. Nevertheless, our data may become the cornerstone that will establish the function of each genetic aberration involved in the pathogenesis of VA.

Conclusion

In summary, using array CGH, we analyzed genome-wide chromosomal aberrations and screened chromosomal can-

didate regions related to the pathogenesis of VA. The array- CGH results were confirmed by RT quantitative PCR. This study is the first for searching whole genomic alterations by array CGH in patients with VA. Our study may contribute to further clarification of important chromosomal regions, identification of candidate genes, and understanding of the pathogenesis of VA.

Acknowledgments

This work was supported by a grant (00-PJ3-PG6-GN02-0002) from the Korean Health 21 R&D Project, the Ministry of Health and Welfare, Republic of Korea.

REFERENCES

1) Nakamura M, Takeshita A, Nose Y. Clinical characteristics associat- ed with myocardial infarction, arrhythmias, and sudden death in pa- tients with vasospastic angina. Circulation 1987;75:1110-6.

2) Pristipino YC, Beltrame JF, Finochiaro ML, et al. Major racial differ- ences in coronary constrictor response between Japanese and Cauca- sians with recent myocardial infarction. Circulation 2000;101:1102-8.

3) Bertrand ME, LaBlanche JM, Tilmant PY, et al. Frequency of provok- ed coronary arterial spasm in 1089 consecutive patients undergoing coronary arteriography. Circulation 1982;65:1299-306.

4) Hibino H, Kurachi Y. A new insight into the pathogenesis of coro- nary vasospasm. Circ Res 2006;98:579-81.

5) Chutkow WA, Pu J, Wheeler MT, et al. Episodic coronary artery va- sospasm and hypertension develop in the absence of Sur2K

ATP

chan- nels. J Clin Invest 2002;110:203-8.

6) Chang K, Baek SH, Seung KB, et al. The Glu298Asp polymorphism in the endothelial nitric oxide synthase gene is strongly associated with coronary spasm. Coron Artery Dis 2003;14:293-9.

7) Park JS, Zhang SY, Jo SH, et al. Common adrenergic receptor poly- morphisms as novel risk factors for vasospastic angina. Am Heart J 2006;151:864-9.

8) Cho YS, Choi JH, Zhang SY, et al. Relationship of polymorphisms in the oxidative stress related genes: paraoxonase and p22phox - to vari- ant angina and coronary artery stenosis in Korean. Korean Circ J 2003;33:104-12.

9) Shimokawa H, Seto M, Katsumata N, et al. Rho-kinase-mediated pathway induces enhanced myosin light chain phosphorylations in a swine model of coronary artery spasm. Caridiovasc Res 1999;43:

1029-39.

10) Ishida T, Hirata K, Sakoda T, et al. 5-HT

1Dβ

receptor mediates the su- persensitivity of isolated coronary artery to serotonin in variant angi- na. Chest 1998;113:243-4.

11) Shimizu M, Hata K, Takaoka H, et al. Sumatriptan provokes coro- nary artery spasm in patients with variant angina: possible involve- ment of serotonin 1B receptor. Int J Cardiol 2007;114:188-94.

12) Pinkel D, Segraves R, Sudar D, et al. High resolution analysis of DNA copy number variation using comparative genomic hybridization to microarrays. Nat Genet 1998;20:207-11.

13) Mantripragada KK, Buckley PG, Diaz de Ståhl T, Dumanski JP. Ge- nomic microarrays in the spotlight. Trens Genet 2004;20:87-94.

14) Pinkel D, Albertson DG. Comparative genomic hybridization. Annu Rev Genomics Hum Genet 2005;6:331-54.

15) Snijders AM, Nowak N, Segraves R, et al. Assembly of microarrays for genome-wide measurement of DNA copy number. Nat Genet 2001;

29:263-4.

16) Ishkanian AS, Malloff CA, Watson SK, et al. A tiling resolution DNA microarray with complete coverage of the human genome. Nat Genet 2004;36:299-303.

17) Moon HJ, Yim SV, Lee KW, et al. Identification of DNA copy-number

aberrations by array-comparative genomic hybridization in patients

with schizophrenia. Biochem Biophys Res Commun 2006;344:531-9.

(9)

18) Kim HS, Yim SV, Jung KH, et al. Altered DNA copy number in pa- tients with different seizure disorder type: by array-CGH. Brain Dev 2007;29:639-43.

19) Bonaglia MC, Giorda R, Tenconi R, et al. A 2.3Mb duplication of ch- romosome 8q24.3 associated with severe mental retardation and epi- lepsy detected by standard karyotype. Eur J Hum Genet 2005;13:

586-91.

20) Pinkel D, Albertson DG. Array comparative genomic hybridization and its applications in cancer. Nat Genet 2005;37:S11-7.

21) Choi YW, Choi JS, Zheng LT, et al. Comparative genomic hybridiza- tion array analysis and real time PCR reveals genomic alterations in squamous cell carcinomas of the Lung. Lung Cancer 2007;55:43-51.

22) Choi JS, Zheng LT, Ha E, et al. Comparative genomic hybridization array analysis and real-time PCR reveals genomic copy number al- teration for lung adenocarcinomas. Lung 2006;184:355-62.

23) Hurst CD, Fiegler H, Carr P, Williams S, Carter NP, Knowles MA.

High-resolution analysis of genomic copy number alterations in blad- der cancer by microarray-based comparative genomic hybridization.

Oncogene 2004;23:2250-63.

24) Mao X, Orchard G, Lillington DM, Russell-Jones R, Young BD, Whittaker S. Genetic alterations in primary cutaneous CD30+ anaplas- tic large cell lymphoma. Genes Chromosomes Cancer 2003;37:176-85.

25) Guillaud-Bataille M, Valent A, Soularue P, et al. Detecting single DNA

copy number variations in complex genomes using one nanogram of starting DNA and BAC-array CGH. Nucleic Acids Res 2004;32:

e112.

26) Li Y, Zhang R, Qiao H, et al. Generation of insulin-producing cells from PDX1 gene-modified human esenchymal stem cells. J Cell Phy- siol 2007;211:36-44.

27) Kang SM, Chang W, Lim S, et al. Losartan inhibits proliferation and nflammation of vascular smooth muscle cells by modulation of uric acid transporter. Tissue Eng Regen Med 2008;5:521-7.

28) Wang G, Brennan C, Rook M, et al. Balanced-PCR amplification al- lows unbiased identification of genomic copy changes in minute cell and tissue samples. Nucleic Acids Res 2004;32:e76.

29) Calvo R, West J, Franklin W, et al. Altered HOX and WNT7A expres- sion in human lung cancer. Proc Natl Acad Sci U S A 2000;97:

12776-81.

30) Chujo M, Noguchi T, Miura T, Arinaga M, Uchida Y, Tagawa Y.

Comparative genomic hybridization analysis detected frequent over- representation of chromosome 3q in squamous cell carcinoma of the lung. Lung Cancer 2002;38:23-9.

31) Jeon JP, Shim SM, Jung JS, et al. A comprehensive profile of DNA copy number variations in a Korean population: identification of copy number invariant regions among Koreans. Exp Mol Med 2009;41:

618-28.

수치

Fig. 1 shows chromosomal aberration regions. 1p12-p11.2,  5p15.33, 11p15.5-p15.4, 12p13.33, 15q26.3, 18q23, and  22q13.33 contained CTDP1, HDAC10, KCNQ1, NINJ2,  NOTCH2, PCSK6, and SDHA genes (gained regions), while  loss region 7q22.1 contained MUC17 gene
Table 3. Recurrent gains/losses in spasms {&gt;7 (25%) frequencies}
Table 3. Continued
Table 3. Continued
+2

참조

관련 문서