Current Photovoltaic Research 3(1) 1-4 (2015) pISSN 2288-3274
Quadrant Analysis in Correlation between Mechanical and Electrical Properties of Low-Temperature Conductive Film
Bonded Crystalline Silicon Solar Cells
Su-Wung Baek
1,4)․ Kwang-Il Choi
1)․ Woo-Hyoung Lee
1)․ Suk-Ho Lee
1)․ Chan-Hyuk Cheon
2)․ Seung-Min Hong
2)․ Kil-Song Lee
3)․ Hyun-Woo Shin
3)․ Yeon-Won Yan
3)․ Cheolhyun Lim
1)*
1)Green Energy Institute, 177, Samhyangcheon-ro, Mokpo-si, Jeollanam-do, 530-400, Korea
2)Aaron Co.,Ltd, Changgok-ri, Paltan-myeon, Hwaseong-Si, Gyeonggi-do, 103-022, Korea
3)Solar tech Co.,Ltd, Suite 712, Yucheon Factopia, #196, Anyang-7 Dong, Mana-Gu, Anyang-City, Kyonggi-do, 403-817, Korea
4)Department of Chemical Engineering, Chonbuk National University, Jeonju 561-756, Korea
ABSTRACT: In this study, we analyzed the correlation between mechanical and electrical properties of low-temperature conductive film (LT-CF) bonded silicon solar cells by a quadrant analysis (horizontal axis (peeling strength), vertical axis (power loss)). We found that a series of points with various bonding parameters such as bonding temperature, pressure and time were distributed in the different three regimes; weak regime (Q2: weak bonding strength and high power loss), moderate regime (Q4 : strong bonding strength and low power loss) and hard regime (Q3 : weak bonding strength and low power loss). Using this analogous technique, it was possible to fabricate the LT-CF bonded silicon solar cells with the various conditions displayed in Q3 of the quadrant plots, possessing the peeling strength of ~ 1N/mm and power loss of 2~3%.
Key words: Low-temperature conductive film, PV module, bonding, peeling strength, power loss
*Corresponding author: [email protected]
Received February 16, 2015; Revised February 18, 2015;
Accepted February 23, 2015
ⓒ 2015 by Korea Photovoltaic Society
This is an Open Access article distributed under the terms of the Creative Commons Attribution Non-Commercial License (http://creativecommons.org/licenses/by-nc/3.0)
which permits unrestricted non-commercial use, distribution, and reproduction in any medium, provided the original work is properly cited.
1. Introduction
Low-temperature conductive film (LT-CF) bonding has been widely investigated in the semiconductor packaging and manu- facturing industry as an alternative method to soldering
1-3). Recently, LT-CFs for fabricating solar cell strings were introduced and commercialized.
Epoxy-resin-based LT-CF is especially sensitive to bonding parameters such as bonding temperature, pressure and time. In general, strong mechanical contacts between metal ribbons and cells guarantee good electrical properties. However, when LT-CF faces an over-curing and excess compression, adhesion strength and electric properties are suffered from deterioration.
In this study, we analyzed the correlation between mechanical (peeling strength) and electrical properties (power loss) of LT-CF bonded silicon solar cells by a quadrant analysis (horizontal axis (peeling strength), vertical axis (power loss)). Using the analogous technique, we found that a series of points with various bonding
parameters such as bonding temperature, pressure and time were distributed in the different three regimes; weak regime (Q2: weak bonding strength and high power loss), moderate regime (Q4 : strong bonding strength and low power loss) and hard regime (Q3 : weak bonding strength and low power loss).
Based on these analysis results, the bonding conditions between solder- & flux-free ribbons and cells were carefully optimized.
We will discuss the correlation between mechanical (peeling strength) and electrical properties (power loss) of LT-CF bonded silicon solar cells in details.
2. Experiments
The LT-CF used in this study was CF-205 (25-µm-thick and 1.2-mm-wide, Hitachi Chemical). It was inserted between a Pb-free ribbon and a monocrystalline silicon solar cell (6 inch, 3-bus bar, 4.54 Wp). In order to optimize the bonding conditions, various parameters were examined. The bonding temperature was varied from 110 to 210°C, and the bonding time was varied from 1 to 7 s. Further, the bonding pressure was varied from 1 to 4 MPa.
1
S.W. Baek et al. / Current Photovoltaic Research 3(1) 1-4 (2015) 2
Fig. 1. Top-view images of LT-CFs after removal of ribbons observed by the stereo optical microscope ; bonded at (A)130, (B)180 and (C)210°C
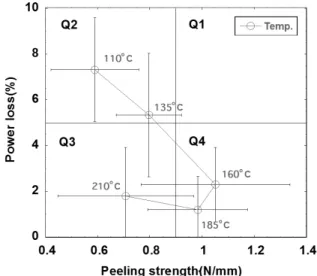
Fig. 2. Correlation between peeling strength and power loss of the samples bonded with various bonding temperatures from 110 to 210°C; the other parameters were maintained constant, for 5 s under 2 MPa
The procedure for LT-CF bonding consists of the following steps: LT-CF placement on cells, pre-bonding, PFR placement, and final bonding. The whole procedure was automatically carried out using a pilot apparatus (ARCF-700), which is capable of interconnecting 700 cells/h. The surface of LT-CFs was observed by stereo optical microscope (Olympus SZX7). To measure the adhesion strength, the 90° peel test was carried out.
The bonded three ribbons on the cells were peeled-off, and the peel strength was measured using a peel tester (IMADA, DS2-20N) at a peeling speed of 0.7 mm/s. Power loss in the solar cell was analyzed before and after the bonding process, and power output was simulated using a flash system (McScience, Lab200) with the AAA class in spectrum.
3. Results and discussion
3.1 Morphology analysis
In order to clarify the morphology changes and failure modes of LT-CF after the bonding process according to the bonding parameters, top-view images of LT-CFs after removal of ribbons were observed by the stereo optical microscope, as shown in Fig. 1. Fig. 1(a), (b) and (c) show the results for the samples bonded at 130, 180 and 210°C, respectively. For all samples, pressure and time were fixed at 2 MPa and 2 s, respectively.
The original width of the LT-CF and ribbon were 1.2 and 1.5 mm. However, the widths after bonding as obtained from their top-view images were 1.55, 1.61 and 1.86 mm for the samples bonded at 130, 180 and 210°C, respectively. This implies that LT-CF beneath the ribbon flowed out after the bonding process and flowed out more as the temperature increased. While, roughly formed surface textures for the samples bonded at 130°C were observed, which is the typical inadequate cohesive failure mode due to an insufficient degree of cure
4). However, the surface
morphology was gradually smoother as the bonding temperature increased, corresponding to the interface failure mode, which is observed when LT-CF is cured over 90%
4). Even though the dependence of failure modes on the various bonding temperatures were only displayed here, it is expectable that curing degree determines the failure mode and both mechanical and electrical bonding strength.
3.2 Quadrant analysis
A conventional characterization method to determine the curing degree of LT-CFs is comparing the two peak areas derived from an epoxy functional group at 915 cm
-1and an aromatic ring band at 1507 cm
-1using FT-IR
5). However its reproducibility is low and the less direct method than the peeling test. Furthermore, we found that the conditions showing the superior electrical property did not guarantee the good mechanical strength. Therefore, we adopted quadrant analysis on the correlation between mechanical (peeling strength, horizontal axis) and electrical properties (power loss, vertical axis) of LT-CF bonded silicon solar cells to optimize the bonding conditions.
3.2.1 Bonding temperature
Fig. 2 shows the correlation between peeling strength and
power loss of the samples bonded with various bonding tem-
peratures from 110 to 210°C; the other parameters were
maintained constant, for 5 s under 2 MPa. Using the quadrant
analysis, we found that a series of points were distributed in the
different three regimes; weak regime (Q2: weak bonding strength
S.W. Baek et al. / Current Photovoltaic Research 3(1) 1-4 (2015) 3
Fig. 3. Correlation between peeling strength and power loss of the samples bonded with various bonding times from 2 to 9 s; the other parameters were maintained constant, at 185°C under 2 MPa
Fig. 4. Correlation between peeling strength and power loss of the samples bonded with various bonding pressures from 1 to 4 Mpa; the other parameters were maintained constant, at 185°C for 5 s
and high power loss), moderate regime (Q4 : strong bonding strength and low power loss) and hard regime (Q3 : weak bonding strength and low power loss). However, there existed no data in Q1, i.e. hard bonding and high power loss.
As the temperature increased, both peeling strength and power loss were improved (Q2 : 110~135°C →Q4 : 160~
185°C) and those were deteriorated with further increased bonding temperature (Q4 : 160~185°C →Q3 : >210°C). It should be pointed out that the decrease in the power loss of the sample in Q4 was much less than that of peeling strength,
Where the peeling strength was as low as the data in Q2. This result is attributed that the density of cross-linkage increases, as the temperature increased resulting in enhanced rheological properties of LT-CF at the interface. However, a too high temperature causes over-curing of CF and decreases adhesion strength
6). On the other hand, excess compression conditions promoted over-curing but formed a sufficient pathway made of conductive particles to result in a power loss of only 2~3%. It is expected that samples with weak peeling strength are clearly vulnerable to humidity, thermal and physical shocks, etc., which deteriorates their long-term reliability.
3.2.2 Bonding time
Fig. 3 shows the correlation between peeling strength and power loss of the samples bonded with various bonding times from 2 to 9 s; the other parameters were maintained constant, at 185°C under 2 MPa. The behavior of the series of points due to bonding time shown in Fig. 2 was similar to that of bonding temperatures. As bonding time increased, peeling strength was drastically dropped and electric contact was slightly improved at the inflection point, 4s. This indicates that in regime Q1, bonding time was too short to achieve a sufficient curing degree, but in regime Q3, long bonding time promoted over-curing.
However, uniformity was improved gradually as the bonding time increased.
3.2.3 Bonding pressure
Fig. 4 shows the correlation between peeling strength and power loss of the samples bonded with various bonding pressures from 1 to 4 Mpa; the other parameters were maintained constant, at 185°C for 5 s. The behavior of the series of points due to bonding pressure was slightly different from those of both temperature and time. All data were existed in Q3 and Q4. It means that LT-CF is sensitive to temperature and time rather
than pressure. Too low or high bonding pressures worsened both peeling strength and power loss. These results presumably account for inadequate adhesion and over-curing, respectively. An excessively high bonding pressure may induce compressive stress in LT-CF and internal stress in bonding areas
7).
4. Conclusions
In conclusion, it was possible to fabricate the LT-CF bonded
silicon solar cells with the various conditions displayed in Q3 of
the quadrant plots possesing the peeling strength of ~1N/mm
S.W. Baek et al. / Current Photovoltaic Research 3(1) 1-4 (2015) 4
and power loss of 2~3%. Even though the samples displayed in Q3 showed comparatively good electrical contact properties, the mechanical strength was not enough to expect a long life time. This result is attributed to a sufficient pathway made of conductive particles despite of over-curing. However, it is expected that samples with weak peeling strength are clearly vulnerable to humidity, thermal and physical shocks, etc., which deteriorates their long-term reliability. Additionally, data distri- butions in the quadrant plots due to various bonding conditions reveled that LT-CF is sensitive to the order of temperature, time and pressure.
Acknowledgments
This work was supported by the New & Renewable Energy Core Technology Program of the Korea Institute of Energy Technology Evaluation and Planning (KETEP), and received a financial grant from the Ministry of Trade, Industry & Energy, Republic of Korea (No. 20113030010070).
References
1. Y.-S. Kim, K. Lee, K.-W. Paik, “Effects of ACF Bonding Parameters on ACF Joint Characteristics for High-Speed Bonding
Using Ultrasonic Bonding Method, Components, Packaging and Manufacturing Technology”, IEEE Transactions on, Vol.
3, pp. 177-182, 2013.
2. X. Chen, J. Zhang, C. Jiao, Y. Liu, “Effects of different bonding parameters on the electrical performance and peeling strengths of ACF interconnection”, Microelectronics reliability, Vol. 46, pp. 774-785, 2006.
3. M. Uddin, M. Alam, Y. Chan, H. Chan, “Adhesion strength and contact resistance of flip chip on flex packages––effect of curing degree of anisotropic conductive film, Microelectronics Reliability”, Vol. 44, pp. 505-514, 2004.
4. C.-K. Chung, K.-W. Paik, “The effects of the degree of cure of anisotropic conductive films (ACFs) on the contraction stress build-up of ACFs and ACF joints stability for chip-on-flex (COF) applications”, in: Electronic Components and Technology Conference, 2009. ECTC 2009. 59th, IEEE, pp. 161-167, 2009.
5. K.K. Chan, N.H. Yeung, Y.C. Chan, S.C. Tan, K.K. Lee
“Microwave Curing of Anisotropic Conductive Film: Effects of Principal Parameters on Curing Situation”, in: ELECTRONIC COMPONENTS AND TECHNOLOGY CONFERENCE, IEEE; Vol 2003, pp. 1701-1704, 1999.
6. Y. Wu, M. Alam, Y. Chan, B. Wu, “Dynamic strength of aniso- tropic conductive joints in flip chip on glass and flip chip on flex packages”, Microelectronics Reliability, Vol. 44, pp. 295-302, 2004.
7. M.-J. Yim, K.-W. Paik, “The contact resistance and reliability of anisotropically conductive film (ACF), Advanced Packaging”, IEEE Transactions on, Vol. 22 pp. 166-173, 1999.