당뇨노인 인지기능의 이질적 변화 궤적에 대한 연구
김찬희
1
ㆍ김민정2
ㆍ박창기2
1
서울대학교 간호과학연구소,2
일리노이 주립대학교 시카고 캠퍼스 간호대학Heterogeneous Trajectories of Cognitive Function in Older Adults with Diabetes:
Findings from the Korean Longitudinal Study of Aging (KLoSA)
Chanhee Kim 1 , Min Jung Kim 2 , Chang Gi Park 2
1
The Research Institute of Nursing Science, Seoul National University, Seoul, Korea,
2College of Nursing, The University of Illinois at Chicago, USA
Received February 11, 2019 Revised March 6, 2019 Accepted March 6, 2019
Corresponding author Min Jung Kim
College of Nursing, The University of Illinois at Chicago, 845 S. Damen Ave., Chicago, IL 60612, USA Tel: +1-217-420-4909 Fax: +1-312-996-8945 E-mail: [email protected] ORCID:
Chanhee Kim
(http://orcid.org/0000-0001-5829-0889) Min Jung Kim
(http://orcid.org/0000-0002-8452-8341) Chang Gi Park
(http://orcid.org/0000-0003-3366-4279)
Copyright © 2019 by stress. All rights reserved.Key messages
본 연구는 지역사회 거주 당뇨노인의 인지기능의 변화궤적 양상을 확인하고자 하였다. 한국복지패널 1차년도부터 6차년도 자료를 활용하여, 당뇨진단을 받은 65세 이상의 노인 672명의 자료를 분석하였 다. 성장혼합모형 분석 결과, 당뇨노인의 인지기능의 변화양상은 ‘정상-유지형’ (41.5%), ‘정상-저하형’
(23.8%), ‘경도인지장애-유지형’ (17.1%), ‘경도인지장애-저하형’ (11.2%), ‘중증인지장애-저하형’ (6.4%) 의 5가지 유형으로 확인되었고, 연령, 성별, 가계소득, 자기보고 건강상태가 영향 요인으로 확인되었다.
본 연구 결과를 통해 당뇨노인의 인지기능의 변화 양상은 이질적이며, 당뇨노인의 인지기능 저하를 예방 하기 위해 대상자에 대한 개별적인 이해와 맞춤형 중재가 필요함을 확인할 수 있었다.
중심단어: 인지기능, 당뇨, 노인
Abstract
Background: Given the rapidly aging population and increasing diabetes prevalence in Korea and worldwide, maintaining optimal cognitive function is a concern in older adults with diabetes. This study aimed to identify heterogeneous trajectories of cognitive function in older adults with diabetes based on the Mini-Mental State Examination and characterize these trajectories.
Methods: Study participants consisted of 672 community-dwelling Korean older adults with diabetes, and data were obtained from the population-based Korean Longitudinal Study of Aging from 2006 through 2016. Growth mixture modeling (GMM) was employed to identify distinct trajectories of cognitive function in older adults with diabetes.
Results: We found that older adults with diabetes followed five distinct cognitive function trajectories over 10 years: normal-maintained (41.5%), normal-declined (23.8%), mildly impaired-maintained (17.1%), mildly impaired-declined (11.2%), and severely impaired-declined (6.4%). Also, we found that age, gender, household income, and self-rated health status at baseline were associated with these trajectories.
Conclusions: Our identification and characterization of heterogeneous cognitive function trajectories in older adults with diabetes have significant implications for developing tailored interventions to older adults with diabetes, specifically to whom at heightened risk for cognitive decline and consequent deterioration in essential diabetes self-management activities.
Key Words: Cognition, Diabetes, Elderly ORIGINAL ARTICLE
Introduction
In 2018, people aged 65 and over accounted for 14.3% of the South Korean population, and by 2060, the elderly will constitute 41% of the population
(Statistics Korea, 2018). This phenomenon is especially concerning as the prevalence of chronic diseases also increases with age. Diabetes in particular is one of the most prevalent chronic conditions and the fifth leading cause of death in the older adult population (Statistics
Korea, 2017). The prevalence of diabetes has been increasing in Korea for the last 10 years. This trend has been especially pronounced in adults aged 70 years and above, among whom the prevalence of diabetes in 2013 (27.6%) was almost double that in 2001 (15.1%) (Noh JH, 2016). Globally, Korea’s po- pulation is aging at the second-greatest rate (Organi- sation for Economic Co-operation and Development (OECD), 2016), and thus the population of Korean older adults diagnosed with diabetes is expected to continue growing.
Diabetes has been linked to mild to severe cognitive impairment, although its etiologic mechanisms have not been confirmed. Some researchers have claimed that pathophysiological processes of diabetes, such as insulin resistance, vascular dysfunction, and inflam- matory changes of brain vessels, could contribute to deterioration of cognitive function in this population (Roberts
et al
., 2014; Umegaki, 2014). A meta-analysis of longitudinal studies also found that people with diabetes had higher relative risks (RR) for mild cog- nitive impairment (MCI) (RR 1.21), Alzheimer’s disease (RR 1.46), vascular dementia (RR 2.48), and any de- mentia (RR 1.51) than those without diabetes (Chenget al
., 2012).Intact cognitive function, however, is necessary for individuals to successfully manage their diabetes, main- tain their overall health and functional status, and reduce the risks for long-term diabetes complications (Tomlin
et al
., 2016; American Diabetes Association (ADA), 2018). Once cognitive impairment develops, it hinders older people with diabetes from actively engaging in diabetes self-management behaviors such as glucose monitoring, insulin dose adjustment, and planning a timely and healthy diet (ADA, 2018). Con- sequently, older adults with cognitive impairment are exposed to an increased risk for diabetes complica- tions resulting from poor glycemic control (Tomlinet al
., 2016; ADA, 2018).The severity, pattern, and progression of loss of cognitive function in older adults with diabetes are heterogeneous, as not everyone’s function deteriorates at the same rate and in the same pattern (Hayden
et al
., 2011). However, to our knowledge, most previous longitudinal studies to date have examined the average cognitive change at a population-level without capturing individual-level heterogeneity. Growth mixture modeling (GMM) is a person-oriented approach that allows identi- fication of subgroups within heterogeneous popula-tions based on similar patterns of change over time (Muthén
et al
., 1999; Nagin, 2005). This person- oriented approach views individuals holistically, while the va- riable-oriented approach (i.e., correlation, regression, and structural equation modeling) views individuals as a sum of variables (Bergmanet al
., 2006). With appli- cation of GMM’s person-oriented approach, healthcare providers can identify patterns of change in cognitive function among older adults with diabetes. The identi- fication and characterization of cognitive function tra- jectories in older adults with diabetes will provide a foundation for healthcare providers to develop indivi- dually tailored interventions.Consequently, the aim of this study was to (a) iden- tify distinct trajectory patterns of cognitive function in older adults with diabetes using a Korean population
‐
based cohort sample and (b) examine associations bet- ween cognitive function trajectory and baseline cha- racteristics, including demographics, socioeconomic status, health status, health behavior, and functional status.Materials and methods
1. Participants
Data were collected from six waves of the Korean Longitudinal Study of Aging (KLoSA) conducted bian- nually from 2006 through 2016. The KLoSA was initiated to collect nationally representative longitu- dinal data on community-dwelling adults aged 45 years or more by means of multistage stratified probability sampling on the basis of geographical areas. In 2006, after providing written informed consent, 10,254 participants completed interviews performed by a trained interviewer (Boo
et al
., 2006). The data collected address a comprehensive range of demographic, socioe- conomic, and health-related issues.Of the 10,254 adults interviewed in 2006, follow-up was conducted with 6,618 individuals in 2016. Of the 6,618 adults, 2,454 who were less than 65 years of age were excluded for the purposes of the current study.
Among the remaining 4,164 adults aged 65 years or older, 672 had reported that they had diabetes and provided complete data at baseline in 2006. Thus, the final sample of our study was composed of 672 older adults with diabetes.
2. Measures
Demographic variables considered for this study in- cluded baseline self-reported age, gender, marital
status (married vs. unmarried
—
i.e., widowed, divorced, separated, or never married), education level (less than high school vs. high school or higher education), and income (total annual household income).Study participants’ cognitive function was examined using the Korean version of the Mini-Mental State Examination (K-MMSE) (Kang YW
et al
., 1997). On this scale, total scores range from 0 to 30, with lower scores reflecting poorer cognitive function. Scores of 24 and above indicate normal cognitive function, 18 through 23 indicate mildly impaired cognitive function, and 17 and below indicate severe impairment (Tom- baughet al
., 1992; Park JHet al
., 1996).Health status variables included the duration of diabetes; the presence of hypertension, heart disease, and cerebrovascular disease; the number of chronic conditions; depressive symptoms; self-rated health status. Depressive symptoms were assessed using the 10-item Center for Epidemiologic Studies Depression Scale (CES-D) (Andresen
et al
., 1994). The total CES-D score ranges from 0 to 10, with a higher score indi- cating more severe depressive symptoms. Self-rated health was dichotomized as poor (reports of poor and very poor) and good (reports of very good, good, and average). As for health behavior variables, self-reported current smoking, alcohol use, and regular exercise were assessed in addition to calculated BMI.Finally, to assess the functional status of the study participants, grip strength was evaluated using a handgrip dynamometer (Model number: NO6103; TANITA, Japan). Specifically, both hands’ grip strength was used to calculate an average grip strength for each partici- pant. Additionally, the 10-item Korean Activities of Daily Living (K-ADL) scale was used to assess functions of daily activities such as eating, dressing, washing face and hands, bathing, performing transfers, using the toilet, and continence (Won CW
et al
., 2002). For the purposes of this study, respondents’ level of performance of each of these activities was recoded (0=needed no assistance, 1=needed partial or full assis- tance), and the total of the ADL scores ranged from 0 to 7, with higher scores reflecting greater functional limitations.3. Analysis
Data were analyzed using SPSS 21.0 (IBM SPSS Statistics for Windows, Armonk, NY, USA) and STATA TRAJ (Stata Corp., College Station, TX, USA). Baseline characteristics of the study participants were sum-
marized using means (with standard deviations [SD]) or frequencies (percentages). Using the longitudinal cohort data, growth mixture modeling (GMM) was em- ployed to identify cognitive function trajectories in older adults with diabetes. GMM was developed to identify differing homogeneous subpopulations with similar growth trajectories (latent classes) within longi- tudinal data from a heterogeneous population (Muthén
et al
., 1999; Nagin, 1999; Nagin, 2005). In our study, final number of trajectories were identified based on the smallest Bayesian information criterion (BIC) (Nylundet al
., 2007). Additionally, in the GMM, each trajectory should contain at least 5% of study partici- pants because classes containing smaller portions of the sample have limited practical applicability. In this study, after the final number of trajectories was deter- mined, Chi-square and analysis of variance (ANOVA) tests were applied to examine differences in charac- teristics of trajectories. Finally, multinomial logistic re- gressions were used to examine associations between cognitive function trajectories and baseline characteri- stics.Results
1. Participant characteristics
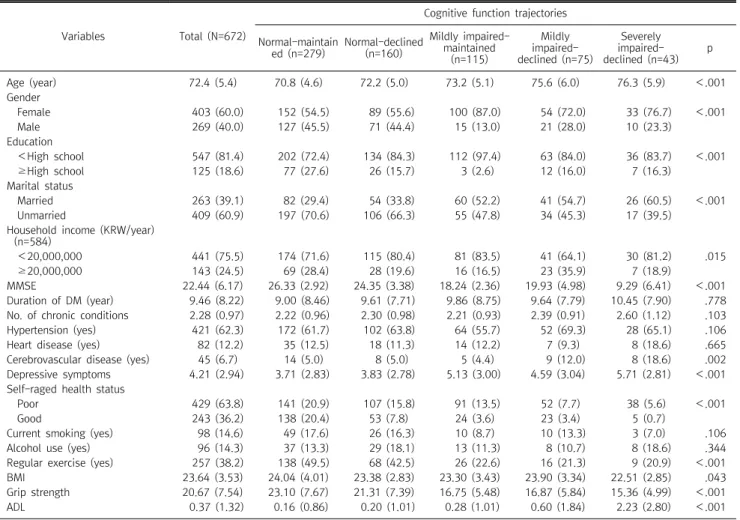
Table 1 shows the characteristics of the 672 study participants. At baseline, the participants were an average of 72.4 years old (SD=5.4), and 60% were female. Most (81.4%) had less than a high school edu- cation, and 39.1% were married. The annual house- hold income of most participants (75.5%) was less than 20,000,000 KRW (
∼
20,000 USD). The average MMSE score was 22.44 (SD=6.17). The duration of diabetes averaged 9.46 years (SD=8.22), and participants had an average of 2.28 (SD=0.97) chronic conditions. Most participants (62.3%) had hypertension, while smaller numbers of participants had heart disease and cere- brovascular disease (12.2% and 6.7%, respectively). The average CES-D score for depressive symptoms was 4.21 (SD=2.94), and over 63.8% of the participants rated their health as poor. Among the participants, 14.6% and 14.3% were current smokers and alcohol users, respectively, and 38.2% exercised regularly. On average, the participants had a BMI score of 23.64 (SD=3.53), a grip strength of 20.67 (SD=7.54), and an ADL score of 0.37 (SD=1.32).Table 2. Model fit and percentage of study participants in each trajectories
Classes AIC BIC (N=263) BIC (N=672) Log-likelihood Percentage of participants in each trajectory
1 2 3 4 5
1 Class − 8361.77 − 8396.45 − 8393.04 − 8376.77
2 Classes − 7974.51 − 8003.88 − 7997.06 − 7964.51 68.3 31.7
3 Classes − 7845.38 − 7889.44 − 7879.21 − 7830.38 52.9 35.7 11.4
4 Classes − 7780.44 − 7839.19 − 7825.54 − 7760.44 41.0 34.2 17.9 6.8
5 Classes − 7772.29 − 7831.03 − 7817.39 − 7752.30 41.5 23.8 17.1 11.2 6.4
Table 1. Baseline characteristics of study participants according to trajectories
Variables Total (N=672)
Cognitive function trajectories
Normal-maintain
ed (n=279) Normal-declined (n=160)
Mildly impaired- maintained
(n=115)
Mildly impaired- declined (n=75)
Severely impaired- declined (n=43) p
Age (year) 72.4 (5.4) 70.8 (4.6) 72.2 (5.0) 73.2 (5.1) 75.6 (6.0) 76.3 (5.9) < .001
Gender
Female 403 (60.0) 152 (54.5) 89 (55.6) 100 (87.0) 54 (72.0) 33 (76.7) < .001
Male 269 (40.0) 127 (45.5) 71 (44.4) 15 (13.0) 21 (28.0) 10 (23.3)
Education
< High school 547 (81.4) 202 (72.4) 134 (84.3) 112 (97.4) 63 (84.0) 36 (83.7) < .001
≥ High school 125 (18.6) 77 (27.6) 26 (15.7) 3 (2.6) 12 (16.0) 7 (16.3)
Marital status
Married 263 (39.1) 82 (29.4) 54 (33.8) 60 (52.2) 41 (54.7) 26 (60.5) < .001
Unmarried 409 (60.9) 197 (70.6) 106 (66.3) 55 (47.8) 34 (45.3) 17 (39.5)
Household income (KRW/year) (n=584)
< 20,000,000 441 (75.5) 174 (71.6) 115 (80.4) 81 (83.5) 41 (64.1) 30 (81.2) .015
≥ 20,000,000 143 (24.5) 69 (28.4) 28 (19.6) 16 (16.5) 23 (35.9) 7 (18.9)
MMSE 22.44 (6.17) 26.33 (2.92) 24.35 (3.38) 18.24 (2.36) 19.93 (4.98) 9.29 (6.41) < .001
Duration of DM (year) 9.46 (8.22) 9.00 (8.46) 9.61 (7.71) 9.86 (8.75) 9.64 (7.79) 10.45 (7.90) .778 No. of chronic conditions 2.28 (0.97) 2.22 (0.96) 2.30 (0.98) 2.21 (0.93) 2.39 (0.91) 2.60 (1.12) .103
Hypertension (yes) 421 (62.3) 172 (61.7) 102 (63.8) 64 (55.7) 52 (69.3) 28 (65.1) .106
Heart disease (yes) 82 (12.2) 35 (12.5) 18 (11.3) 14 (12.2) 7 (9.3) 8 (18.6) .665
Cerebrovascular disease (yes) 45 (6.7) 14 (5.0) 8 (5.0) 5 (4.4) 9 (12.0) 8 (18.6) .002
Depressive symptoms 4.21 (2.94) 3.71 (2.83) 3.83 (2.78) 5.13 (3.00) 4.59 (3.04) 5.71 (2.81) < .001 Self-raged health status
Poor 429 (63.8) 141 (20.9) 107 (15.8) 91 (13.5) 52 (7.7) 38 (5.6) < .001
Good 243 (36.2) 138 (20.4) 53 (7.8) 24 (3.6) 23 (3.4) 5 (0.7)
Current smoking (yes) 98 (14.6) 49 (17.6) 26 (16.3) 10 (8.7) 10 (13.3) 3 (7.0) .106
Alcohol use (yes) 96 (14.3) 37 (13.3) 29 (18.1) 13 (11.3) 8 (10.7) 8 (18.6) .344
Regular exercise (yes) 257 (38.2) 138 (49.5) 68 (42.5) 26 (22.6) 16 (21.3) 9 (20.9) < .001
BMI 23.64 (3.53) 24.04 (4.01) 23.38 (2.83) 23.30 (3.43) 23.90 (3.34) 22.51 (2.85) .043
Grip strength 20.67 (7.54) 23.10 (7.67) 21.31 (7.39) 16.75 (5.48) 16.87 (5.84) 15.36 (4.99) < .001
ADL 0.37 (1.32) 0.16 (0.86) 0.20 (1.01) 0.28 (1.01) 0.60 (1.84) 2.23 (2.80) < .001
2. Cognitive function trajectories in older adults with diabetes
Table 2 shows the model fit for all trajectories and the percentage of participants in each trajectory. Based on the BIC values, five cognitive function trajectories in older adults with diabetes were identified: normal- maintained, normal-declined, mildly impaired-maintained, mildly impaired-declined, and severely impaired-declined (see Fig. 1). The first and largest trajectory was com- posed of 41.5% of the sample (n=279) and was labeled as the normal-maintained trajectory; this trajectory showed normal cognitive function (MMSE
≥
24) at base-line and maintained normal cognitive function over 10 years. The second trajectory was composed of 23.8%
(n=160) of the sample and was labeled as the normal- declined trajectory; this trajectory showed normal cog- nitive function at baseline and a steady decline that eventually ended in mildly impaired cognitive function after 10 years. The third trajectory was composed of 17.1% (n=115) of the sample and was labeled as the mildly impaired-maintained trajectory, having mildly impaired cognitive function (MMSE 18
∼
23) at baseline and maintaining this level of cognitive function over time. The fourth trajectory was composed of 11.2%(n=75) of the sample and was labeled as the mildly
Fig. 1. Cognitive function trajectories in older adults with diabetes.
Table 3. Results of multinomial regression analysis for cognitive function trajectories
Variables Normal-maintained vs. Normal-declined Mildly impaired-maintained vs. Mildly impaired-declined
OR (95% CI) OR (95% CI)
Age (year) 1.078 (1.019 ∼ 1.139)** 1.130 (1.042 ∼ 1.226)**
Gender (ref. female)
Male 0.892 (0.396 ∼ 2.012) 5.132 (1.062 ∼ 24.794)*
Education (ref. ≥ high school)
< High school 1.653 (0.841 ∼ 3.249) 0.246 (0.042 ∼ 1.440)
Marital status (ref. married) 0.830 (0.468 ∼ 1.474) 2.127 (0.875 ∼ 5.172)
Not married
Household Income (ref. ≥ 20,000,000)
< 20,000,000 (KRW/year) 2.000 (1.119 ∼ 3.577)* 0.578 (0.231 ∼ 1.449)
Duration of diabetes (year) 1.018 (0.986 ∼ 1.050) 0.970 (0.923 ∼ 1.020)
No. of chronic conditions 0.967 (0.652 ∼ 1.435) 0.978 (0.481 ∼ 1.991)
Hypertension (ref. no)
Yes 1.115 (0.557 ∼ 2.234) 1.849 (0.571 ∼ 5.988)
Heart disease (ref. no)
Yes 0.718 (0.296 ∼ 1.742) 0.230 (0.038 ∼ 1.408)
Cerebrovascular disease (ref. no)
Yes 1.298 (0.406 ∼ 4.149) 8.237 (0.594 ∼ 114.213)
Self-rated health status (ref. good)
Poor 1.983 (1.129 ∼ 3.483)* 0.629 (0.241 ∼ 1.643)
Depressive symptoms (CESD) 0.967 (0.843 ∼ 1.019) 0.978 (0.481 ∼ 1.991)
Current Smoking (ref. not smoking)
Smoking 1.732 (0.845 ∼ 3.552) 1.068 (0.265 ∼ 4.305)
Alcohol (ref. non-alcohol use)
Alcohol use 1.727 (0.874 ∼ 3.415) 0.179 (0.031 ∼ 1.031)
Exercise (ref. not exercise)
Exercise 0.923 (0.561 ∼ 1.519) 0.907 (0.354 ∼ 2.323)
BMI 0.834 (0.628 ∼ 1.106) 1.242 (0.781 ∼ 1.973)
Grip strength 0.967 (0.920 ∼ 1.017) 0.980 (0.895 ∼ 1.073)
ADL 0.520 (0.239 ∼ 1.131) 2.901 (0.758 ∼ 11.108)
**p < .01, *p < .05.
impaired-declined trajectory; this trajectory had mildly impaired cognitive function at baseline and showed steady cognitive decline that ended in severe cognitive impairment after 10 years. The fifth and smallest trajec-
tory was composed of 6.4% (n=43) of the sample and was labeled as the severely impaired-declined trajectory, showing severe cognitive impairment (MMSE
≤
17) at baseline and steep cognitive decline over time.Baseline participant characteristics are shown accor- ding to the five trajectories in Table 1. Significant differences were observed among the five trajectories with respect to baseline age, gender, education, marital status, household income, MMSE score, presence of cerebrovascular disease, depressive symptoms, self-rated health status, regular exercise, BMI, grip strength, and ADL score. No significant differences among the trajec- tories were observed for baseline duration of diabetes, number of chronic conditions, presence of hypertension or heart disease, smoking, or alcohol use.
3. Associations between cognitive function trajec- tories and baseline characteristics
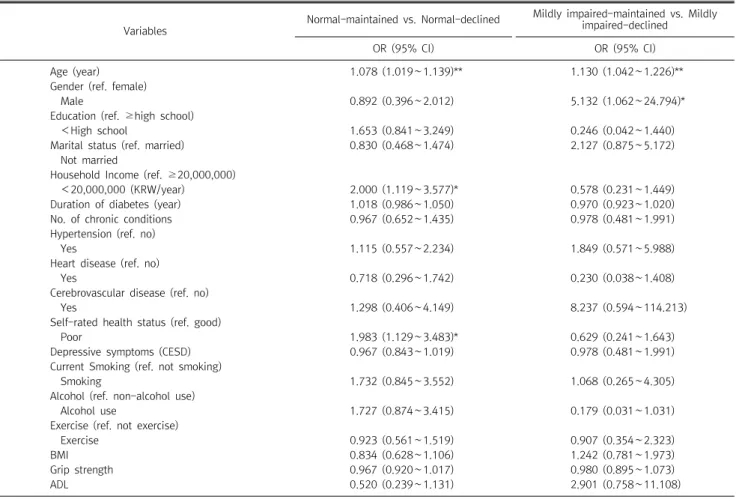
Table 3 shows the results of a multinomial logistic regression model that examined how baseline demo- graphic, health status, health behavior, and functional status factors were associated with cognitive function
trajectories in older adults with diabetes. In this analysis, we focused on comparing the normal-main- tained and normal-declined trajectories as well as the mildly impaired-maintained and mildly impaired-declined trajectories because these comparisons were most clinically relevant. Compared to older adults with the normal-maintained trajectory, those on the normal-declin- ed trajectory were older (OR=1.077, p=.009) and had lower household income (OR=2.000, p=.019) while showing poor self-rated health status (OR=1.983, p=.017). In comparison with the mildly impaired-main- tained trajectory, older adults on the mildly impaired- declined trajectory were older (OR=1.130, p=.003) and more likely to be male (OR=5.132, p=.042). No other significant associations with cognitive function trajectories were identified for education, duration of diabetes, presence of hypertension or heart disease, number of chronic conditions, depressive symptoms, smoking, alcohol use, grip strength, or ADL score.
Discussion
Our study aimed to identify and characterize trajec- tories of cognitive function in community-dwelling older adults with diabetes using data from a Korean popu- lation-based, 10-year longitudinal assessment. GMM, a person-oriented approach, was used to identify hete- rogeneous trajectories of cognitive function in the older adults based on MMSE. The study participants exhi- bited five distinct cognitive function trajectories: normal- maintained (41.5%), normal-declined (23.8%), mildly impaired-maintained (17.1%), mildly impaired-declined (11.2%), and severely impaired-declined (6.4%). The ob- served heterogeneity in cognitive function trajectories among older adults with diabetes is consistent with previous study results that identified distinct trajecto- ries in older adults without dementia (Hayden
et al
., 2011; Hallet al
., 2018; Zammitet al
., 2018), with MCI (Hanfeltet al
., 2011; Xieet al
., 2011), and with Alzheimer’s disease (Wilkoszet al
., 2010; Leoutsakoset al
., 2015).In our study, older adults with diabetes having normal cognitive function at baseline showed two dis- tinct trajectories over 10 years. In our sample, 41.5%
maintained their normal cognitive function. By way of comparison to studies not focusing on diabetics, in a population-based study, 41% maintained their cognitive function with a slow decline over 10 years based on the MMSE (Terrera
et al
., 2010). Also, Haydenet
al
.(2011) found that 65% of older adults free from dementia showed normal cognitive function with a slow decline over 15 years. It is well documented that older adults with diabetes show a greater rate of cognitive decline than those without the disease (Cukier- manet al
., 2005; Chenget al
., 2012). Although a substantial percentage of our participants—
about 42%—
maintained their cognitive function over time, about 24% showed a decline. Based on these results, health- care providers should be aware of the likelihood of cognitive decline among many cognitively intact older adults with diabetes so that they can monitor such individuals for associated symptoms.Similarly, participants with mildly impaired cognitive function at baseline were found to belong to two distinct trajectories over time
—
mildly impaired-maintained (17.1%) and mildly impaired-declined (11.2%). These findings are consistent with those of other longitudinal studies of older adults with MCI, which revealed hetero- geneous cognitive function trajectories (Mungaset al
., 2010; Xieet al
., 2011). Mungaset al
.(2010) found that older adults diagnosed with MCI belonged to three distinct cognitive function trajectories, which the re- searcher described as “some improved, some did not change, and some declined at a rapid rate” (p. 9). Xieet al
.(2011) identified five trajectories in a cohort of 187 older adults diagnosed with MCI over 3.5 years.Based on the collective findings of these studies, MCI in older adults with diabetes was not merely a transi- tional stage in the development of dementia but was rather a heterogeneous phenomenon. Our findings sug- gest that monitoring the cognitive function of older adults with diabetes and MCI over time may help to identify individuals at heightened risk for dementia.
Healthcare providers should recognize that older adults with diabetes and MCI can have different patterns and rates of cognitive change. Thus, healthcare providers should apply a person-oriented approach to help such individuals avoid further cognitive decline and conse- quent deterioration in diabetes self-management.
Exploring characteristics of distinct cognitive func- tion trajectories provides useful information for deve- loping strategies that may prevent the progression of cognitive impairment in later life. Our study showed that age, gender, low household income, and self-rated health status all contributed to cognitive function trajec- tories. As expected, we found that older individuals were more likely to follow declining trajectories, as has been reported in previous studies of the older
adult population (Karlamangla
et al
., 2009; Yaffeet al
., 2009; Wilkoszet al
., 2010; Xieet al
., 2011; Zaninottoet al
., 2018). Given the declining cognitive function trajectory with age observed in our study, cognitive function declined more rapidly in males compared with females among older adults with diabetes and MCI at baseline. Our findings of gender differences in cognitive function trajectory among participants with MCI support recent study results indicating that older males had more rapid declines in global cognitive function than females (Zaninottoet al
., 2018). How- ever, unlike previous study findings (McCarreyet al
., 2016), our study results showed no gender effect on cognitive function trajectory in older adults with diabetes who were cognitively intact at baseline. These differing findings regarding gender effects on cognitive function trajectories may be explained by metho- dological differences such as use of different study populations and different assessment tools for cog- nitive function. In our study, the single crude MMSE measure may not have been sensitive enough to detect differences in cognitive decline between females and males.Regarding socioeconomic factors, education was not associated with cognitive function trajectories among older adults with diabetes. In prior studies, mixed results were obtained for relationships between educa- tion and cognitive function trajectories in older adults:
some studies reported significant associations (Terrera
et al
., 2010; Yuet al
., 2012; Verlindenet al
., 2016;Zaninotto
et al
., 2018), while others showed none (Karlamanglaet al
., 2009; Xieet al
., 2011). On the other hand, in our study, household income was found to be associated with cognitive function trajectories.Specifically, cognitively intact older diabetics with low household income were more likely to follow a decli- ning trajectory. This result is consistent with a previous study finding (Zhang
et al
., 2015) that a significant association existed between socioeconomic status and the rate of cognitive decline in older adults. A possible explanation for Zhanget al
.’s (2015) and our results is that older diabetics with low household income are more likely to have poor dietary habits, less healthy lifestyles, and thus poor glucose control that would affect their cognitive function trajectories over time.Interestingly, health status variables such as duration of diabetes; number of chronic diseases; comorbidity of hypertension, cardiovascular disease, and cerebro- vascular disease; and depressive symptoms were not
associated with cognitive function trajectories in this study. However, the initial self-rated health status of older adults with diabetes was significantly associated with cognitive function trajectory among those who were cognitively intact at baseline. Specifically, parti- cipants who rated their health as poor at baseline were more likely to be on a declining trajectory. This finding is supported by a 10-year longitudinal study of older adults (Bond
et al
., 2006) in which self-rated health predicted cognitive impairment as well as mor- tality and functional impairment. We believe that it is worthwhile for healthcare providers to ask a simple but informative question about self-rated health status in order to identify older adults with diabetes at po- tentially heightened risk for cognitive decline. Ob- jective health status notwithstanding, healthcare pro- viders should give closer attention to older adults with diabetes who rate their health as poor.No significant associations were identified between cognitive function trajectories and health behavior variables (i.e., smoking, alcohol use, exercise, and BMI) in our study. Because health behavior factors can be modified through interventions, more research is needed to identify potential associations between such factors and cognitive function trajectories. Finally, functional status, grip strength, and ADL score at baseline were not associated with cognitive function trajectories.
One major strength of this study is that our findings are drawn from a nationally representative community- based cohort with 10-year follow-up. Also, our use of GMM that is a person-oriented approach, allowed us to identify heterogeneous trajectories of cognitive func- tion in older adults with diabetes.
Some potential limitations of our study should be noted. First, in this longitudinal population-based study, the use of a single measure
—
the MMSE—
may not have been adequate to fully detect changes in cognitive func- tion over time. Even though the MMSE has been vali- dated for detection of global cognitive function (Kurlo- wiczet al
., 1999), this measure has been criticized for its ceiling effect and its lack of sensitivity (Tombaughet al
., 1992; Lancuet al
., 2006; Mitchell, 2009). Thus, future longitudinal studies involving this population should use a comprehensive cognitive function test battery. Furthermore, clinical and biological risk factors of diabetes (e.g., glucose control, medication types, and history of hypoglycemia), and the use of cognitive enhancement medication, which were not assessed, may have contributed to the predicted trajectories ofcognitive function in our study sample. Such factors should be considered in the design of future studies involving older adults with diabetes and their cognitive function trajectories. Finally, the variables were treated as time-invariant. However, changes in some variables such as depressive symptoms, alcohol use, smoking, and BMI may have occurred over the study period, affecting trajectories of cognitive function.
Given the rapidly aging population and the lifestyle changes seen in the 21st century, the prevalence of diabetes in older adults is likely to continue increasing both in Korea and worldwide. Our findings showed that older adults with diabetes followed five distinct cognitive function trajectories over 10 years. In addi- tion, our findings indicated that age, gender, house- hold income, and self-rated health status are related to increased risk of declining cognitive trajectories in community-dwelling older adults with diabetes. Based on these findings, healthcare providers should be aware that changes in cognitive function among older adults with diabetes are heterogeneous and thus that screenings and interventions should be individualized.
Maintaining cognitive function in older adults with diabetes is essential for not only self-management be- haviors but also psychological wellbeing and mental health. Thus, our findings have significant implications for the development of tailored interventions for older adults with diabetes to promote their physical and mental health, specifically those at heightened risk for cognitive decline who might neglect essential diabetes self-management activities. Also, the characteristics of declining cognitive function trajectories identified in our study may help healthcare providers to determine the likelihood of cognitive decline in older adults with diabetes and to tailor interventions according to indi- viduals’ risk factors.
Conflicts of interest
The authors declared no conflict of interest.
References