http://dx.doi.org/10.3938/NPSM.67.581
Revealing the Structure of National R & D Activity in Korea by Using a Keyword Co-occurrence Network
Min-Woo Ahn
∗Department of Physics, Pohang University of Science and Technology, Pohang 37673, Korea
Woo-Sung Jung
†Department of Physics, Pohang University of Science and Technology, Pohang 37673, Korea Department of industrial Management and Engineering,
Pohang University of Science and Technology, Pohang 37673, Korea Asia Pacific Center of Theoretical Physics, Pohang 37673, Korea (Received 10 January 2017 : revised 7 April 2017 : accepted 7 April 2017)
R & D activity is crucial for economic growth of modern society. For this reason, government supports R & D activity in various ways. In this paper, we investigate the structure of the keyword co-occurrence network of national R & D activity from the National Science & Technology Infor- mation System (NTIS) database from 2006 to 2010. In this network, a keyword is a node, and two nodes are connected when they are included in the same research project. Using investment data, we measure the investment for each keyword and investigate the relation with the centrality of keywords for the constructed network. We obtain three major findings from the keyword co-occurrence net- works. First, a heavy-tailed degree distribution with a hierarchical structure is observed. They are modularized with similar classification profiles. Second, betweenness centrality and investment both show heavy-tailed distributions. However, they are not only positively correlates rather, two kinds of relationships are observed. One is the keyword that has both high centrality and investment, and the other keyword has low centrality, but high investment. Third, investment and centrality show different temporal consistencies. When we measure the Pearson correlation coefficient of investment and centrality for adjacent years, investment changes more rapidly than the betweenness centrality does.
PACS numbers: 89.75.-k
Keywords: Complex network, National R & D activity, Keyword co-occurrence network, Network analysis, Betweenness centrality
I. INTRODUCTION
Research and development (R & D) activity is impor- tant driven force of economic growth of modern society [1]. In the case of Korea, for example, R & D activity is major factor for drastic economic growth after Korean War [2]. For this reason, the government supports R &
D activity in various ways such as research projects and investment policy. The amount and coverage of govern-
∗E-mail:[email protected]
†E-mail:[email protected]
ment support has been increased. Because of this vast range of national R & D activity, however, it is hard to figure out the whole structure, therefore inefficiency and uncontrollability appear. For this reason, managing the national R&D activity via knowledge management was suggested [3].
There are researches that mapping and visualizing the knowledge structure, which is called knowledge mapping [4]. Based on the literatural information, network struc- ture is obtained and visualized to observe the overall landscape of the academic field. This technique is widely applied such as patent map [5], finding trend of specific
This is an Open Access article distributed under the terms of the Creative Commons Attribution Non-Commercial License (http://creativecommons.org/licenses/by-nc/3.0) which permits unrestricted non-commercial use, distribution, and reproduction in any medium, provided the original work is properly cited.
subfield [6,7], or even the whole structure of science map from the citation structure [8]. Especially, keyword co- occurrence network is usually employed to exploit more detailed structure of given subfield [9–14]. However, this
‘cartography’ of national R & D activity has less atten- tion in spite of the importance. Mapping the current state of national R & D activity can provide more ef- ficient way to managing them.
In this study, we employ the network analysis to map- ping the structure of national R & D activity. From the data, we exploit the keyword profiles (investment or sci- ence and technology classification profile) and topolog- ical property from the keyword co-occurrence network.
We investigate the structural property of keyword co- occurrence network and find the meaning from the rela- tion between other properties of the keywords.
II. METHODOLOGY
1. Dataset
We use NTIS (National Science & Technology Infor- mation System) database to construct the keyword co- occurrence network. This database includes information about research projects such as title, research field, in- vestment, keywords and so on. We use English keyword with keyword purification (singular/plural, erratum, key- word format) to construct keyword co-occurrence net- work, and used investment data to measure the amount of investment for each keyword. We use data from 2006 to 2010, therefore 5 independent networks are constructed for each year, respectively. In this study, only the projects that includes English keywords are used.
2. Network construction
In the keyword co-occurrence network, which node is keyword and two nodes are connected when they are in- cluded in the same research project (Fig. 1). The result of network construction is unweighted, undirected net- work. In other words, keyword co-occurrence network is the one-mode projection of the keyword-project bipartite network into keyword-based network.
Fig. 1. (Color online) Construction of keyword co- occurrence network and investment allocation for key- words. The node of keyword co-occurrence network is research keyword, and two keywords are connected when they are included in the same research projects. Invest- ment for research project is equally divided into included keywords.
To measure the amount of investment, we use the data of investment for research projects. Investment for re- search project is equally allocated into included keywords (Fig. 1). In this scheme, total amount of investment for keyword is the same with total amount of investment for research projects.
3. Employed parameters
To investigate the property of keyword co-occurrence network, we employed basic network parameters (the number of node, the number of links, clustering coeffi- cient, giant component size). Betweenness centrality is employed to obtain the topological importance of key- words. The detailed definition of parameters are listed:
Clustering coefficient There are two kind of defini- tion of clustering coefficient. One is suggested by Newman, which measures the ratio between trian- gle subgraph for given network and the number of connected triple [15]. Another one is suggested by Watts and Strogatz, which is defined as the average of local clustering coefficient [16]. In details, Local clustering coefficient is defined as
Ci= 2
di(di− 1)Ti (1) where Timeans the number of connections between neighbors of node i and di is the degree of node i.
The clustering coefficient for whole network is then
C = 1 N
X
i
Ci (2)
where N is the number of nodes for given network.
Correlation with degree and local clustering coef- ficient provides additional information about net- work property. Assuming power-law degree dis- tribution, simple model shows the relationship C(N ) ∼ N−0.75 [17,18]. If the network shows hier- archical structure, scaling relation follows C(N ) ∼ N−1 [19].
Betweenness centrality Consider the all of the short- est path between all of the node pairs. Betweenness centrality is the count that pass through nodes. We can write this for the equation as follow:
B(i) =X
j6=k
σjk(i)
σjk (3)
where σjk is the number of shortest path connect- ing node j and k, and σjk(i) is the number of short- est paths that connects the node j and k with pass through the node i. This represents the importance of nodes in terms of the flows on the whole network, assuming that this flow follows shortest path.
Betweenness centrality is widely applied in network analysis to find interdisciplinary journals from the scientific journals [20], influence of the people in the social network [21,22], the importance of keyword in keyword co-occurrence network [10],
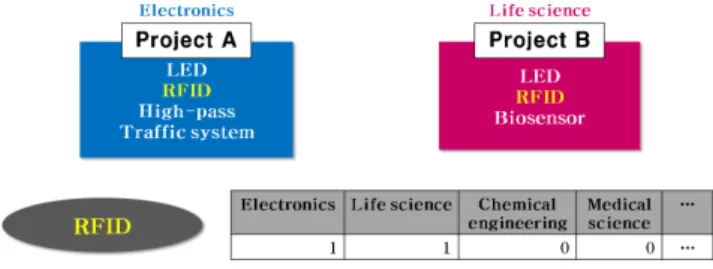
Cosine similarity of research field To investigate the relationship between topological property and research field, we employ research field vector and cosine similarity of keyword vector profile (see Fig. 2). Research project is classified in terms of research field based on the science and technology classification standard. From this information, we can infer the relationship between research field and keywords from the research field which is allocated for corresponding research project. Key- word usually appears in various fields, therefore we make research field vector for the appearance of each research field. The element of this vector
Fig. 2. (Color online) Example for research field vector for each keyword. Elements of research field vector repre- sent the category of the science and technology classifica- tion standard, and the value of each element corresponds to the appearance count of given keyword for each cate- gory. In this example, keyword ‘RFID’ is included in elec- tronics and life science at one times respectively. Then the element of research field vector for RFID is 1 for electronics and life science, and 0 for others.
represent research field, and their value is defined as the number of research projects that includes given keyword and is classified into corresponding research field.
We employ cosine similarity for research field vec- tors to represents the proximity of the research field for keyword pairs. Let ~fa and ~fb be the keyword profile vector of node a and b, then cosine similar- ity is defined as
cos( ~fa, ~fb) =
f~a· ~fb
qf~a· ~fa
qf~b· ~fb
(4)
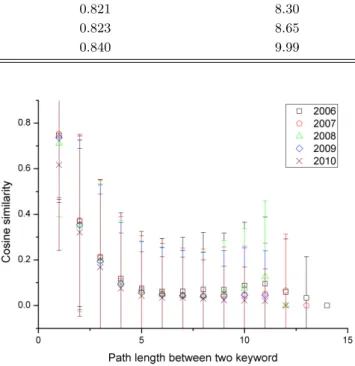
where ~fa· ~fb is the inner product of ~fa and ~fb. It is hard to define the modularity in terms of re- search fields because keyword usually appears in various fields, therefore we observe average rela- tionship between cosine similarity and path length between two keywords to verify clustered structure with similar research field profile.
III. RESULT AND DISCUSSION
1. Basic network properties
Basic network parameters are listed in Table 1. The pa- rameters related with network size is gradually increased, which means that diversity and interaction between key- word are increased. This means that the coverage and inter-relationship of R & D activity has been increased.
Clustering coefficient shows that keyword co-occurrence
Table 1. Basic network parameters for NTIS keyword co-occurrence network. Basic network parameters related with network size are gradually increased, which means the coverage and interconnection between research field becomes larger.
Year Node Link Clustering coefficient Mean degree
2006 47,870 159,754 0.820 6.67
2007 61,888 247,690 0.835 8.00
2008 66,285 275,245 0.821 8.30
2009 73,268 316,966 0.823 8.65
2010 88,220 440,709 0.840 9.99
Fig. 3. (Color online) Complimentary cumulative degree distribution of keyword co-occurrence network for all of years. Heavy-tailed distribution is observed for all of the years.
Fig. 4. (Color online) Relation between local clustering coefficient and degree. Results follow C(N ) ∼ N−1 that originates from the hierarchical structure of the network.
Fig. 5. (Color online) The correlation between cosine sim- ilarity of classification vector and path length for all pairs of the keywords. Negative correlation represents that keyword co-occurrence network has modularized struc- ture with similar research field.
network has highly clustered structure. The degree dis- tribution in Fig. 3 shows heavy-tailed distribution for all of the years. In addition, the local clustering coefficient and degree shows negative correlation with C(N ) ∼ N−1 (Fig. 4), which represents hierarchical structure.
The relationship between average similarity of research field vector and path length is in Fig. 5. Average similar- ity for path length 1 (directly connected) has dominantly high value than other path lengths. Keywords that has similar keyword are clustered, then betweenness central- ity has high value when it has many connection within similar research field, or bridging two or more different subfields. Summarizing the result, we observed that the keyword co-occurrence network of national R & D activ- ity shares properties already observed in keyword net- works in the various subfields, although the national R
& D activity is the sum of the various subfields [9,13]. In- stead, keywords are clustered with similar research field
Fig. 6. (Color online) Probability distribution for be- tweenness centrality. Betweenness centrality also shows heavy-tailed distribution.
Fig. 7. (Color online) Investment distribution for key- word. Both axes are displayed in the log scale. Skewed distribution of investment shows the heterogeniety of in- vestment allocation.
profiles, which can infer from the extremely high cluster- ing coefficient and similarity distribution of classification profile.
2. Relationship between investment and central- lity
The distribution of betweenness centrality is shown in Fig. 6. Like degree distribution, heavy-tailed distribu- tion is observed. The distribution of investment of key- word shows also heavy-tailed distribution as in Fig. 7.
This result means that investment is very concentrated
Fig. 8. (Color online) Scatter plot between betweenness centrality and investment for keywords. There are two re- gion based on different correlation regime. Region I in fig- ure shows positive correlation with investment, whereas Region II shows larger investment with very low central- ity.
for small portion of fields. We obtain scatter plot for investment for keywords and betweenness centrality to observe the relationship between them. The result is in Fig. 8. Two kind of relationship is observed in the figure.
One region has positive correlation between centrality and investment (Region I), and another is low centrality with very high investment (Region II). This two divided region represent that there are two kind of investment policy. In the region I, shows gradually high investment, whereas region II shows short-term investment.
3. Temporal consistency of betweenness central- ity and investment
To verify the temporal consistency of the each prop- erty, we measure the Pearson correlation coefficient for adjacent years for keywords that appear all of the years.
These keywords have different betweenness centrality and investment for each year, therefore we can obtain Pearson correlation from this value. Suppose that By,i is betweenness centrality for year y, keyword i. Then Pearson correlation for adjacent years ρy,y+1can be cal- culated as
ρy,y+1=
P
i(By,i− By)(By+1,i− By+1) q
P
i(By,i− By)2 q
P
i(By+1,i− By+1)2 , (5)
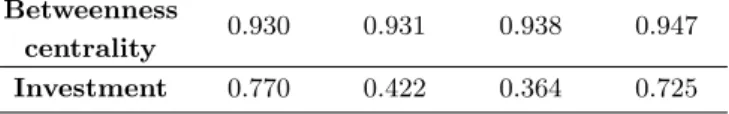
Table 2. Pearson correlation ρy,y+1 of betweenness cen- trality and investment between adjacent years. Invest- ment tends to change more rapidly than betweenness centrality.
ρ2006,2007 ρ2007,2008 ρ2008,2009 ρ2009,2010
Betweenness
0.930 0.931 0.938 0.947
centrality
Investment 0.770 0.422 0.364 0.725
where By= N1 P
iBy,i. Correlation for investment can be calculated from (5) by substuting By,i as Iy,i, where Iy,irepresent the size of investment for keyword i in year y.
Results in Table 2 shows that investment tends to more rapidly change than betweenness centrality. Es- pecially, the size of investment changes drastically in 2008, which was the change of the government. From this result, we conjecture that the investment is driven by government, whereas the research field is relatively self-organized. Also, the rapid change of the investment seems largely depend on the end and the new start of re- search projects. When the projects with large investment end, huge change of investment follows.
In summary, the continuity of research field keeps consistent behavior, whereas investment largely fluctu- ate compared with centrality. The number of research project is very large, therefore it is hard to control the amount of the investment. Keyword co-occurrence net- work provides the overall landscape of the national R &
D activity, which is expected to help establish research policy for investment allocation.
IV. SUMMARY
We observe the landscape of the national R & D activ- ity via keyword co-occurrence network. To construct the network, we use NTIS database including the informa- tion of research project from 2006 to 2010. We employ the betweenness centrality to measure the importance of the keyword, and investment for each keyword is observed.
The coverage and interconnectiion of national R & D activity is annually increased, which means the quanti- tative and qualitative development of national R & D
activity. We also observe the relationship between be- tweenness centrality and investment to observe the topo- logical importance of the keywords and real attribute of each keywords. We observe there are two region of cor- relation. One is the keyword network with both has high centrality and investment (Region I), another is the high investment with low centrality (Region II). Pearson cor- relation coefficient is employed to investigate temporal consistency. Correlation coefficient of betweenness cen- trality has high value, which represents the resilient fea- ture of topological importance. In contrast, low consi- tency for investment is observed, which refers that the investment is not sustainably supported because of the massive amount of the research projects and the com- plexity of investment allocation.
From this study, we can observe the detailed charac- teristics of the national R & D activities in terms of im- portance and investment of the each keywords and their relation. We expect that this study helps diagnose and control the overall national R & D activity to establish more efficient investment policy.
ACKNOWLEDGEMENTS
This research was supported by Basic Science Re- search Program through the National Research Founda- tion of Korea (NRF) funded by the Ministry of Educa- tion (2016R1D1A1B03932590).
REFERENCES
[1] E. Mansfield, Science 175, 4201 (1072).
[2] T. Scitovsky, Korea 1, 3 (1985).
[3] Y. Park and S. Kim, J. Knowl. Manag. 9, 4 (2005).
[4] M. N. Wexler, J. Knowl. Manag. 5, 3 (2001).
[5] J. Choi and Y. S. Hwang, Technol. Forecast Soc.
Change 83, 170 (2014).
[6] R. Tijssen and A. Van Raan, Scientometrics 15, 3 (1989).
[7] E. Mohammadi, Scientometrics 92, 3 (2012).
[8] K. B¨orner, R. Klavans, M. Patek, A. M. Zoss and J.
R. Biberstine et al., PLoS One 7, 7 (2012).
[9] H. Yang and W. S. Jung, J. Eng. Technol. Manage.
40, 64 (2016).
[10] J. Choi, H. Kim and N. Im, J. Intell. Inform. Syst.
17, 4 (2011).
[11] H. Kim, W. S. Jung and S. J. Ahn, J. Korean. Oper.
Res. Manag. Sci. Soc. 40, 4 (2015).
[12] J. P. Courtial, Scientometrics 31, 251 (1994).
[13] S. Yi and J. Choi, Scientometrics 90, 3 (2012).
[14] H. N. Su and P. C. Lee, Scientometrics 85, 1 (2010).
[15] M. E. J. Newman, SIAM Review 45, 2 (2003).
[16] D. J. Watts and S. H. Strogatz, Nature 393, 440 (1998).
[17] R. Albert and A.L. Barab´asi, Rev. Mod. Phys. 74, 47 (2002).
[18] S. N. Dorogovtsev and J. F. F. Mendes, Adv. Phys.
51, 1079 (2002).
[19] E. Ravasz and A.L. Barab´asi, Phys. Rev. E 67, 026112.
[20] L. Leydesdoff, J. Am. Soc. Inf. Sci. 58, 9 (2007).
[21] M. E. J. Newman, Phys. Rev. E 64, 016132 (2001).
[22] S. Wasserman and K. Faust, Social Network Analy- sis (Cambridge University Press, Cambridge, 1994).