© 2018 Korean Breast Cancer Society. All rights reserved. http://ejbc.kr | pISSN 1738-6756
INTRODUCTION
Invasive breast cancer, a leading cause of death among women, has received extensive attention from the interna- tional community [1]. Numerous genes and proteins have been discovered and are now considered biomarkers for more
precise evaluation of the prognosis of breast cancer.
The five zinc finger of the cerebellum (ZIC) family pro- teins—ZIC1, ZIC2, ZIC3, ZIC4, and ZIC5—are structurally similar to each other [2]. Five Cys2His2 zinc-finger domains in each member interact with the Gli family proteins via these homologous structures and are essential for human nervous system development [3]. Currently, these five proteins play different roles in human carcinomas and have been inferred as carcinogenic or suppressor genes. ZIC1 has been found to inhibit the growth of various carcinomas, such as digestive system cancers and thyroid cancer, and has become a putative indicator of good prognosis [4-8]. In addition, the high ZIC4 methylation levels in pTa-bladder cancer patients was corre- lated with an elevated progression risk and became a potential poor prognostic marker in stage pTa [9,10]. However, ZIC2, ZIC3, and ZIC5 are overexpressed in lung cancer cells and can function as oncogenes by improving cell proliferation and inhibiting apoptosis [11-13]. Besides, ZIC2 expression could
Clinicopathologic and Prognostic Significance of the Zinc Finger of the Cerebellum Family in Invasive Breast Cancer
Wei Han*, Cong Zhang1,*, Xiao-jiao Gao2, Hua-bing Wang3, Fang Chen2, Fang Cao, Yong-wei Hu, Jun Ma4, Xing Gu5, Hou-zhong Ding
Department of General Surgery, Kunshan First People’s Hospital Affiliated to Jiangsu University, Kunshan; 1Department of Pharmacy, Kunshan Hospital of Traditional Chinese Medicine, Kunshan; 2Department of Pathology, Kunshan First People’s Hospital Affiliated to Jiangsu University, Kunshan; 3Department of General Surgery, Luan First People’s Hospital, Luan; 4Department of Urinary Surgery, Kunshan Hospital of Traditional Chinese Medicine, Kunshan;
5Department of Gynecology, Kunshan First People’s Hospital Affiliated to Jiangsu University, Kunshan, China ORIGINAL ARTICLE
Purpose: Five members of the zinc finger of the cerebellum (ZIC) family—ZIC1, ZIC2, ZIC3, ZIC4, and ZIC5—have been shown to be involved in various carcinomas. Here, we aimed to explore the clinicopathologic and prognostic roles of ZIC family mem- bers in invasive breast cancer patients using immunohistochemi- cal analysis, western blotting analysis, and real-time quantitative polymerase chain reaction (RT-qPCR). Methods: A total of 241 female invasive breast cancer patients who underwent radical mastectomy between 2009 and 2011 were enrolled. ZIC pro- teins in 241 pairs of breast tumors and corresponding normal tissues were investigated using immunohistochemistry and the clinicopathologic roles of proteins were analyzed using Pearson’s chi-square test. Kaplan-Meier curves and Cox regression analysis were also used to analyze the prognostic value of the ZIC proteins. In addition, 12 pairs of fresh-frozen breast tumors
and matched normal tissues were used in the western blotting analysis and RT-qPCR. Results: Only ZIC1 expression in normal tissues was obviously higher than that in tumors (p<0.001). On multivariate analysis, ZIC1 expression (in overall survival analy- sis: hazard ratio [HR], 0.405, 95% confidence interval [CI], 0.233–0.702, p=0.001; in disease-free survival analysis: HR, 0.395, 95% CI, 0.234–0.669, p=0.001) was identified as a prog- nostic indicator of invasive breast cancer. Conclusion: ZIC1, but not the other proteins, was obviously decreased in breast tumors and associated with clinicopathologic factors. Thus, ZIC1 might be a novel indicator to predict the overall and disease-free sur- vival of invasive breast cancer patients.
Key Words: Breast neoplasms, Pathology, Prognosis, ZIC family
Correspondence to: Hou-zhong Ding
Department of General Surgery, Kunshan First People’s Hospital Affiliated to Jiangsu University, No.5 Qingyang Mid Road, Kunshan, Jiangsu 215300, China
Tel: +86-139-6267-5797, Fax : +86-0512-5755-2925 E-mail: dinghouzhong@163.com
*These authors contributed equally to this work.
This project supported by Suzhou Youth Science and Technology Program of
“Science and Education” (No. KJXW2015053), Kunshan Science and Technology Program of Social Development (No. KS1654), and Jiangsu University Science and Technology Program of Clinical Medicine (No.
JLY20160040).
Received: December 15, 2017 Accepted: March 7, 2018
Cancer
promote cell proliferation and inhibit cell apoptosis during the development of pancreatic ductal adenocarcinoma [14]. Pre- vious studies have also demonstrated that ZIC1 and ZIC4 are potential suppressor genes in breast cancer [15,16]. The ZIC1 expression level was elevated in BT-549 cells after the knock- down of phosphatidylinositolglycan-class X (PIGX), reticulo- calbin 1 (RCN1), or (RCN2), whereas the growth of transfect- ed BT-549 cells was obviously inhibited [15]. Pavlova et al.
[16] identified that methylated ZIC4 might be involved in breast cancer development. Without reports on ZIC2, ZIC3, or ZIC5 in breast cancer, the clinicopathologic and prognostic significance of the ZIC family proteins requires further illumi- nation.
Here, we investigated the expression levels of the ZIC family proteins in 241 cases of invasive breast cancer using immuno- histochemical analysis (IHC) and then detected the relative expression levels of these proteins in 12 pairs of breast tumors and matched normal tissues using western blotting analysis and real-time quantitative polymerase chain reaction (RT-qPCR).
We also analyzed the associations between the ZIC family protein expression levels and the clinicopathological factors of breast cancer and evaluated the prognostic roles of these pro- teins.
METHODS
Patients and tissue samples
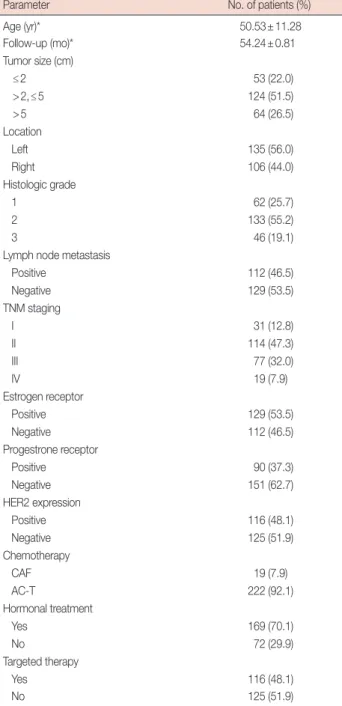
A total of 241 female invasive breast cancer patients (mean age, 50.53±11.28 years) who underwent surgery (radical mas- tectomy in 45, modified radical mastectomy in 196) between 2009 and 2011 were enrolled. Each case had breast tumor and its corresponding normal tissue. None of the patients had re- ceived radiotherapy or chemotherapy before surgery. The cohort was composed of patients with complete clinicopatho- logical data from Wujiang First People’s Hospital (n=64) and Kunshan Second People’s Hospital (n=177). Patients with stage I, II, and III disease received doxorubicin+cyclophosphamide for the first four cycles and paclitaxel for the next four cycles, while patients with stage IV disease received cyclophosphamide+
doxorubicin+5-fluorouracil for six cycles. If a patient confirmed estrogen receptor (ER) or progesterone receptor (PR)-positive, she would receive tamoxifen in the premenopausal period or an aromatase inhibitor in the postmenopausal period. If a pa- tient tested human epidermal growth factor receptor 2 (HER2)-positive, she would receive trastuzumab. Follow-up data were available for all patients for a mean duration of 54.24±0.81 months (range, 3–60 months). More details of the clinicopathological data of 241 cases are listed in Table 1. In addition, 12 pairs of fresh-frozen breast tumor tissue and
matched normal tissue samples (stored at −80°C) were col- lected from Kunshan First People’s Hospital Affiliated to Ji- angsu University and used for total protein extraction. Our study received ethical approval from the Kunshan First Peo- ple’s Hospital Ethics Committee (No. KSLL2008016). Every patient signed an informed consent form.
Table 1. Clinicopathological parameters of 241 patients with breast cancer
Parameter No. of patients (%)
Age (yr)* 50.53±11.28
Follow-up (mo)* 54.24±0.81
Tumor size (cm)
≤2 53 (22.0)
>2,≤5 124 (51.5)
>5 64 (26.5)
Location
Left 135 (56.0)
Right 106 (44.0)
Histologic grade
1 62 (25.7)
2 133 (55.2)
3 46 (19.1)
Lymph node metastasis
Positive 112 (46.5)
Negative 129 (53.5)
TNM staging
I 31 (12.8)
II 114 (47.3)
III 77 (32.0)
IV 19 (7.9)
Estrogen receptor
Positive 129 (53.5)
Negative 112 (46.5)
Progestrone receptor
Positive 90 (37.3)
Negative 151 (62.7)
HER2 expression
Positive 116 (48.1)
Negative 125 (51.9)
Chemotherapy
CAF 19 (7.9)
AC-T 222 (92.1)
Hormonal treatment
Yes 169 (70.1)
No 72 (29.9)
Targeted therapy
Yes 116 (48.1)
No 125 (51.9)
HER2=human epidermal growth factor receptor 2; CAF=cyclophosphamide+
doxorubicin+5-fluorouracil for 6 cycles; AC-T= doxorubicin+cyclophosphamide for first 4 cycles and paclitaxel for next 4 cycles.
*Mean±SD.
Tissue microarray construction and immunohistochemistry A total of 241 breast tumors and corresponding normal tis- sues were collected. Three representative regions of each case were selected to obtain tissue cylinders with a diameter of 0.6 mm; we then arrayed these cylinders into a recipient block us- ing a tissue chip microarrayer. Subsequently, we cut the recipi- ent block into 5-μm sections on pretreated slides to support sample adhesion.
Rabbit anti-human ZIC1, ZIC2, ZIC3, ZIC4, and ZIC5 polyclonal antibodies (Bioss, Beijing, China) were used as the primary antibodies diluted at 1:100 in phosphate-buffered sa- line. A SP Rabbit & Mouse HRP Kit (CWBIO, Beijing, China) was used for the IHC. The slides were deparaffinized, rehy- drated, and then boiled in a citrate buffer solution at a concen- tration of 10 mmol/L. After the solution cooled to room tem- perature, tissue chips were treated with blocking buffers and then incubated with the primary antibodies for 12 hours each.
In sequence, the slides were marked by streptavidin with horseradish peroxidase (HRP), developed by diaminobenzi- dine, and counterstained with hematoxylin. Finally, we dehy- drated and mounted these chips for storage and evaluation of the staining results.
Evaluation of immunohistochemical staining
Two pathologists (X.J.G. and F.C.) who were blinded to the study details independently assessed ZIC family protein ex- pression in a semi-quantitative manner combined with evalu- ation of the percentage of tumor cells with staining of the cy- toplasm or nuclear (“0–100%”=“0–10”) and the assessment of staining intensity (“faint–yellow–sepia”=“1–10”). Multi- plied values, called the immunoreactivity score (IRS), were 0–100. If one protein was detected in the cytoplasm and the nucleus, we used an average score of the cytoplasm and nucle- us (ZIC1–3). The samples were divided into “high-expression”
(IRS >10) and “low-expression” (IRS ≤10) samples accord- ing to each protein’s expression. This cutoff value was identi- fied according to previous relevant studies [17,18]. ER, PR, and HER2 statuses were considered as positive if >10% of tu- mor cells showed staining [19]. Any disagreement of IRS was resolved by discussion or consultation with a third pathologist (H.Z.D.). The results of the agreement statistics are presented in Supplementary Figure 1 (available online) with a Bland- Altman method comparison.
Protein extraction and western blotting
Twelve pairs of fresh-frozen invasive breast cancer tumors and corresponding normal tissues were used for the western blotting analysis. We chose normal breast tissues that were >5 cm away from the tumors. In these regions, there were abun-
dant epithelial cells of the normal mammary duct and acinar structures. We extracted total proteins from the representative tumor regions and normal breast tissues using radioimmuno- precipitation assay (RIPA) Lysis Buffer (Beyotime Biotechnol- ogy, Shanghai, China), and then collected the supernatants, whose protein concentrations were measured using a bicin- choninic acid (BCA) Protein Assay Kit (Beyotime Biotechnol- ogy). Supernatants of the samples were mixed with sodium dodecyl sulfate polyacrylamide gel electrophoresis (SDS- PAGE) Loading Buffer (Beyotime Biotechnology), boiled for 8–10 minutes, resolved on ExpressPlus PAGE Gel (Genscript, Nanjing, China), transferred to polyvinylidene fluoride mem- branes (Beyotime Biotechnology), and then blocked in Tris buffered saline+Tween (TBST) confining liquid with 5% non- fat dry milk for 2 hours at room temperature. Thereafter, the primary antibodies including ZIC1 (diluted at 1:400), ZIC2 (diluted at 1:400), ZIC3 (diluted at 1:400), ZIC4 (diluted at 1:400), ZIC5 (diluted at 1:400), and β-actin (mouse polyclonal antibody diluted at 1:1,000; Beyotime Biotechnology) were dissolved in TBST and used to incubate membranes in 4°C overnight. After a cleaning in TBST, corresponding secondary antibodies with HRP were used to incubate these membranes for 2 hours at 37°C and the protein bands were detected using an Enhanced Chemiluminescence Detection System (Beyotime Biotechnology). The formula of relative expression levels of proteins quantified with Image J was Gray Value (ZIC proteins)/
Gray Value (β-actin). The specificity of antibodies is shown in Supplementary Tables 1, 2, and Supplementary Figure 2 (available online).
Real-time quantitative polymerase chain reaction
Twelve pairs of frozen-thawed tissues were also used to isolate the total RNA using Trizol reagent (Thermo Fisher Scientific, Waltham, USA), and then, 2 µg RNA from each sample was reverse transcribed using the SuperScript II RNase-Reverse Transcriptase System (Thermo Fisher Scientific). Circular DNA was subjected to RT-qPCR using primers specific for
Table 2. The polymerase chain reaction primers of ZIC family genes and GAPDH
Gene Forward primer (5´-3´) Reverse primer (5´-3´) ZIC1 GCGTCCTTTTGTGGATCTTTAA AGTAATCACATCTGCTTCTGGG ZIC2 ACACTCCTCCCAGAAGCAGAC GCAACTGAGCAATCCCAAGAA ZIC3 AGACTGTCCCGGATACCAAGC CAACAGCAGCGACCGTAAGAA ZIC4 GCCTTTTCCCAGAGGGTATTA CCTTTCTTTCCTGATTTGTGC ZIC5 TCCCCACTGATGAGTAACCAA AAGAAACATTCCCATGTCCAC GAPDH GAAGGTGAAGGTCGGAGT GAAGATGGTGATGGGATTTC ZIC=zinc finger of the cerebellum; GAPDH=glyceraldehyde-3-phosphate dehydrogenase.
ZIC1, ZIC2, ZIC3, ZIC4, ZIC5, and glyceraldehyde-3-phos- phate dehydrogenase (GAPDH). The PCR primers are shown in Table 2. The PCR cycling conditions were as follows: 94°C for 4 minutes, followed by 40 cycles at 95°C for 1 minute, 60°C for 1 minute, and 72°C for 1 minute. The amplified DNA was measured using an SYBR Premix Ex TaqTM kit (Takara Bio,
Dalian, China), whereas RT-qPCR was performed using an iQ5 Real-Time PCR Detection System (Bio-Rad, Berkeley, USA).
The 2-ΔΔCt value was used to calculate the relative expression and ΔΔCt=(CtTumor-ZICn−CtTumor-GAPDH)−(CtNor- mal-ZICn−CtNormal-GAPDH) (n=1–5). A higher 2-ΔΔCt lev- el indicated greater mRNA expression.
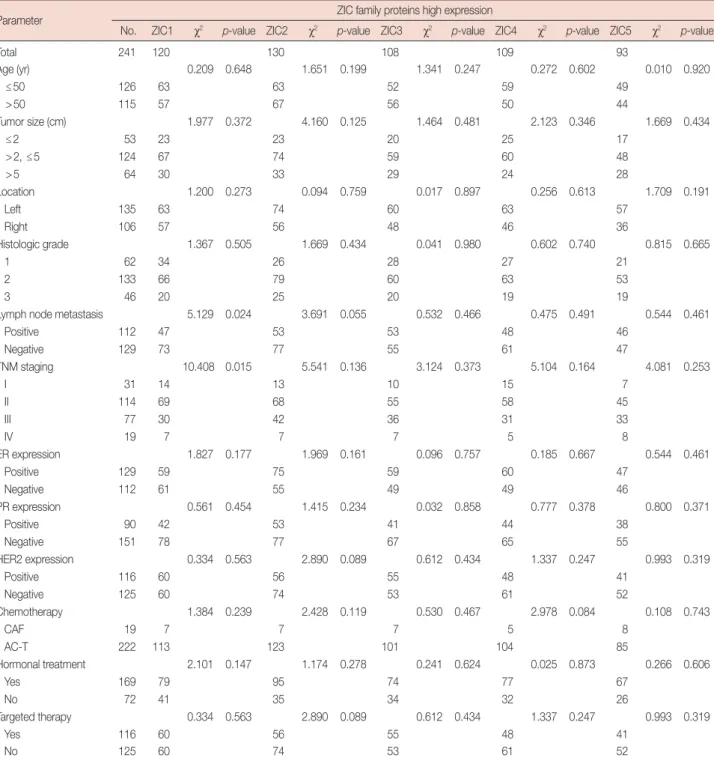
Table 3. Associations of ZIC family proteins expression with various clinicopathological factors of 241 patients with invasive breast cancer
Parameter ZIC family proteins high expression
No. ZIC1 χ2 p-value ZIC2 χ2 p-value ZIC3 χ2 p-value ZIC4 χ2 p-value ZIC5 χ2 p-value
Total 241 120 130 108 109 93
Age (yr) 0.209 0.648 1.651 0.199 1.341 0.247 0.272 0.602 0.010 0.920
≤50 126 63 63 52 59 49
>50 115 57 67 56 50 44
Tumor size (cm) 1.977 0.372 4.160 0.125 1.464 0.481 2.123 0.346 1.669 0.434
≤2 53 23 23 20 25 17
>2, ≤5 124 67 74 59 60 48
>5 64 30 33 29 24 28
Location 1.200 0.273 0.094 0.759 0.017 0.897 0.256 0.613 1.709 0.191
Left 135 63 74 60 63 57
Right 106 57 56 48 46 36
Histologic grade 1.367 0.505 1.669 0.434 0.041 0.980 0.602 0.740 0.815 0.665
1 62 34 26 28 27 21
2 133 66 79 60 63 53
3 46 20 25 20 19 19
Lymph node metastasis 5.129 0.024 3.691 0.055 0.532 0.466 0.475 0.491 0.544 0.461
Positive 112 47 53 53 48 46
Negative 129 73 77 55 61 47
TNM staging 10.408 0.015 5.541 0.136 3.124 0.373 5.104 0.164 4.081 0.253
I 31 14 13 10 15 7
II 114 69 68 55 58 45
III 77 30 42 36 31 33
IV 19 7 7 7 5 8
ER expression 1.827 0.177 1.969 0.161 0.096 0.757 0.185 0.667 0.544 0.461
Positive 129 59 75 59 60 47
Negative 112 61 55 49 49 46
PR expression 0.561 0.454 1.415 0.234 0.032 0.858 0.777 0.378 0.800 0.371
Positive 90 42 53 41 44 38
Negative 151 78 77 67 65 55
HER2 expression 0.334 0.563 2.890 0.089 0.612 0.434 1.337 0.247 0.993 0.319
Positive 116 60 56 55 48 41
Negative 125 60 74 53 61 52
Chemotherapy 1.384 0.239 2.428 0.119 0.530 0.467 2.978 0.084 0.108 0.743
CAF 19 7 7 7 5 8
AC-T 222 113 123 101 104 85
Hormonal treatment 2.101 0.147 1.174 0.278 0.241 0.624 0.025 0.873 0.266 0.606
Yes 169 79 95 74 77 67
No 72 41 35 34 32 26
Targeted therapy 0.334 0.563 2.890 0.089 0.612 0.434 1.337 0.247 0.993 0.319
Yes 116 60 56 55 48 41
No 125 60 74 53 61 52
ZIC =zinc finger of the cerebellum; ER =estrogen receptor; PR =progesterone receptor; HER2 =human epidermal growth factor receptor 2; CAF = cyclophosphamide+doxorubicin+5-fluorouracil for 6 cycles; AC-T=doxorubicin+cyclophosphamide for first 4 cycles and paclitaxel for next 4 cycles.
Statistical analysis
All results were analyzed using SPSS version 20.0 software (IBM, Armonk, USA) or GraphPad Prism version 6.0 (GraphPad Software, San Diego, USA), and p-values <0.05 were considered statistically significant. Pearson’s chi-square and Fisher exact tests were used to analyze the associations between ZIC protein expression and clinicopathological fac- tors. In addition, Kaplan-Meier curves with the log-rank test and Cox univariate and multivariate regression analyses were used to evaluate the roles of every factor in overall survival (OS) and disease-free survival (DFS). Independent risk fac- tors for survival were selected using SPSS version 20.0 soft- ware.
RESULTS
ZIC member expression in invasive breast cancer
IHC confirmed that ZIC1, ZIC2, and ZIC3 could be ex- pressed in the nucleus or cytoplasm, whereas ZIC4 and ZIC5
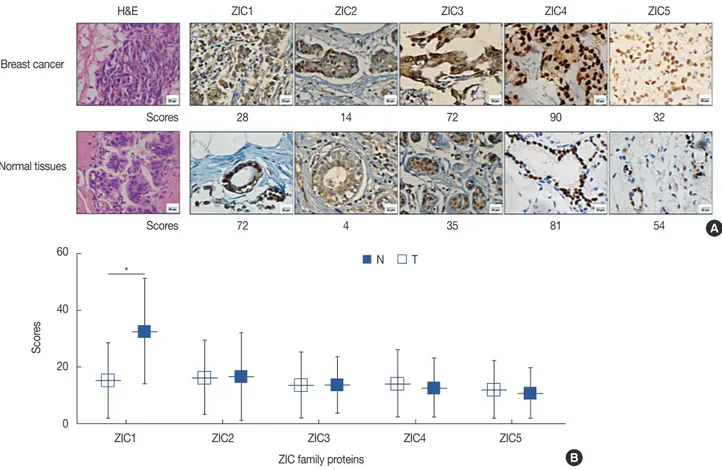
were expressed only in the nucleus. The rates of high ZIC1–5 expression were 49.8%, 53.9%, 44.8%, 45.2%, and 38.6%, re- spectively (Table 3). Figure 1 shows the expression of ZIC proteins in tumors and matched normal tissues, while the ex- pression score of ZIC1 protein in the normal tissues was obvi- ously higher than that in the tumors (normal tissues vs. tu- mors, 32.66±18.76 vs. 15.38±13.37, p<0.001). However, no difference in ZIC2 (tumors vs. normal tissues, 16.26±13.08 vs. 16.71±15.38, p>0.05), ZIC3 (tumors vs. normal tissues, 13.49±11.58 vs. 13.61±9.71, p>0.05), ZIC4 (tumors vs. normal tissues, 14.20±11.95 vs. 12.62±10.38, p>0.05), or ZIC5 (tumors vs. normal tissues, 12.08±10.23 vs. 10.81±9.02, p>0.05) ex- pression scores were seen between the tumor tissues and cor- responding normal tissues.
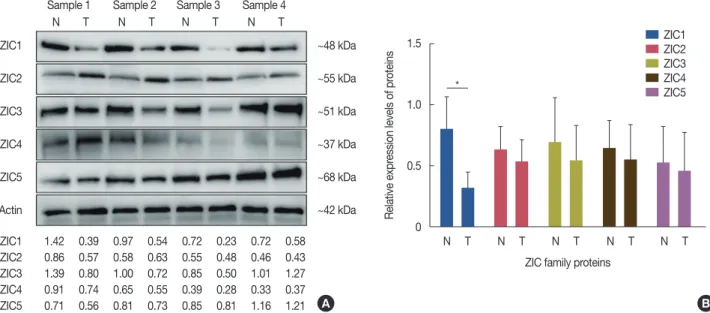
We then used western blotting analysis to detect the ZIC protein expressions in the 12 pairs of tissues, and the sizes of the ZIC1–5 proteins were 48 kDa, 55 kDa, 51 kDa, 37 kDa, and 68 kDa, respectively. We found that the level of ZIC1 pro- tein expression in the tumors was significantly lower than that
Figure 1. ZIC member expression in invasive breast cancer. (A) Hematoxylin and eosin (H&E) and immunohistochemical staining of zinc finger of the cerebellum (ZIC) family proteins in breast tumors and corresponding normal tissues. ZIC family proteins were observed in the nucleus or cytoplasm (×400 magnification). (B) There was a significant difference in ZIC1 expression, but not other proteins, between breast tumors and matched normal tissues from 241 patients.
N=normal tissue; T=breast tumor. *p<0.001.
60
40
20
0
ZIC1 ZIC2 ZIC3 ZIC4 ZIC5 ZIC family proteins
Scores
H&E
Breast cancer
Normal tissues
Scores
Scores
ZIC1 ZIC2 ZIC3 ZIC4 ZIC5
28 14 72 90 32
72 4 35 81 54 A
B
* N T
in normal tissues (tumors vs. normal tissues, 0.324±0.127 vs.
0.801±0.261, p<0.001) (Figure 2, Supplementary Figure 3).
However, we found no difference in ZIC2 (normal tissues vs.
tumors, 0.533±0.181 vs. 0.633±0.190, p>0.05), ZIC3 (normal tissues vs. tumors, 0.543±0.290 vs. 0.687±0.365, p>0.05), ZIC4 (normal tissues vs. tumors, 0.544 ±0.294 vs.
0.641±0.229, p>0.05), or ZIC5 (normal tissues vs. tumors, 0.457±0.317 vs. 0.522±0.302, p>0.05) between the tumors and matched normal tissues.
Also, in the RT-qPCR analysis, we found that the ZIC1 mRNA expression level in the tumors was significantly lower than that in the normal tissues (0.163±0.139 vs. 1.197±0.921, respectively, p<0.001) (Figure 3).
Associations between ZIC protein expression and clinicopathologic factors
Next, to evaluate the relationship between every ZIC pro- tein and clinicopathologic factors, we divided all patients into two groups by cutoff values. As shown in Table 3, only the high ZIC1 expression level was negatively related to lymph node metastasis (p=0.024) and TNM stage (p=0.015). How- ever, no significant relationships were observed between ZIC1 and other factors (p>0.05) (Table 3).
Overall survival
The OS rate was 73.4%. We used Kaplan-Meier analysis to examine the survival rates of 241 invasive breast cancer cases with high or low ZIC protein expressions. The 5-year survival
rate of patients with high ZIC1 expression was obviously higher than those with low expression (high vs. low, mean survival time, 57.08±0.81 months vs. 51.42±1.34 months, p<0.001; 5-year survival rate, 84.2% vs. 62.8%, p<0.001) (Figure 4A). However, no significant differences in survival rates were detected between the high and low ZIC2 levels (mean survival time, 54.12±1.10 months vs. 54.38±1.19 months, respectively, p>0.05; 5-year survival rate, 73.8% vs.
73.0%, p >0.05) (Figure 4B), ZIC3 (mean survival time, 52.69±1.44 months vs. 55.49±0.87 months, respectively, p>0.05; 5-year survival rate, 72.2% vs. 74.4%, respectively, Figure 2. Western blotting analysis of zinc finger of the cerebellum (ZIC) family proteins in breast tumors and matched normal tissues. (A) Represent blots of ZIC family proteins in four samples. (B) Relative protein expression of ZIC family proteins in 12 pairs of breast tumors and matched normal tis- sues.
N=normal tissue; T=breast tumor. *p<0.001.
Sample 1 Sample 2 Sample 3 Sample 4 N T N T N T N T ZIC1
ZIC2
ZIC3
ZIC4
ZIC5
β-Actin ZIC1 ZIC2 ZIC3 ZIC4 ZIC5
1.42 0.39 0.97 0.54 0.72 0.23 0.72 0.58 0.86 0.57 0.58 0.63 0.55 0.48 0.46 0.43 1.39 0.80 1.00 0.72 0.85 0.50 1.01 1.27 0.91 0.74 0.65 0.55 0.39 0.28 0.33 0.37 0.71 0.56 0.81 0.73 0.85 0.81 1.16 1.21
~48 kDa
~55 kDa
~51 kDa
~37 kDa
~68 kDa
~42 kDa
A
1.5
1.0
0.5
0
N T N T N T N T N T ZIC family proteins
Relative expression levels of proteins
B ZIC1 ZIC2 ZIC3 ZIC4 ZIC5
*
Figure 3. Real-time quantitative polymerase chain reaction analysis of zinc finger of the cerebellum (ZIC) family members in breast tumors and matched normal tissues.
N=normal tissue; T=breast tumor. *p<0.001.
4
3
2
1
0
N T N T N T N T N T ZIC family proteins
Expression of ZIC mRNA
ZIC1 ZIC2 ZIC3 ZIC4 ZIC5
*
p>0.05) (Figure 4C), ZIC4 (mean survival time, 53.78±1.27 months vs. 54.61±1.04 months, respectively, p>0.05; 5-year survival rate, 72.5% vs. 74.2%, p>0.05) (Figure 4D), or ZIC5 (mean survival time, 52.81±1.44 months vs. 55.14±0.95 months, respectively, p>0.05; and 5-year survival rate, 67.7%
vs. 77.0%, respectively, p>0.05) (Figure 4E).
In the next Cox regression analysis, we first conducted a univariate analysis and found that nine factors—ZIC1 expres- sion, tumor size, location, histologic grade, lymph node me- tastasis, TNM staging, ER expression, HER2 expression, and targeted therapy—could affect the OS of invasive breast can- cer patients; in the further multivariate analysis, five factors—
including ZIC1 expression (hazard ratio [HR], 0.405; 95%
confidence interval [CI], 0.233–0.702; p=0.001), tumor size (HR, 1.762; 95% CI, 1.014–3.062; p=0.038), histologic grade (HR, 2.024; 95% CI, 1.159–3.536; p=0.013), TNM staging (HR, 2.606; 95% CI, 1.509–4.500; p=0.001), and HER2 ex- pression (HR, 0.535; 95% CI, 0.317–0.905; p=0.020) —were identified as prognostic indicators of invasive breast cancer
patients (Table 4).
Disease-free survival
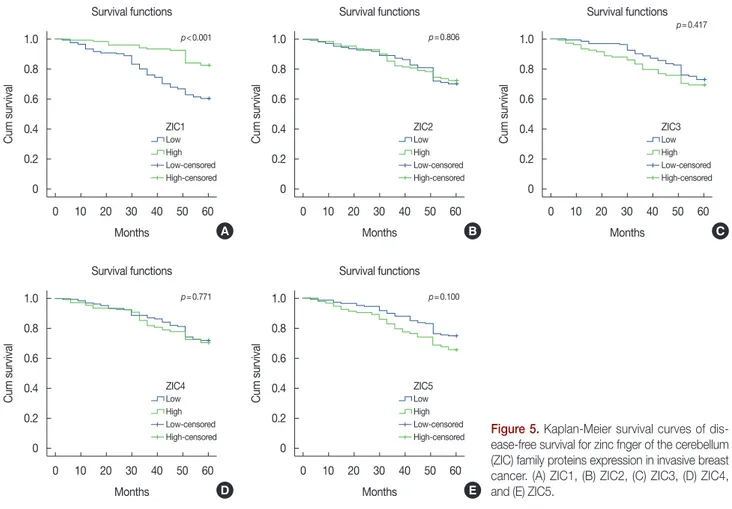
The 5-year DFS rate was 71.4%. The DFS of patients with high ZIC1 expression was significantly higher than that of pa- tients with low expression (high vs. low, mean survival time, 56.63±0.88 months vs. 49.29±1.46 months, respectively, p<0.001; 5-year DFS rate, 82.5% vs. 60.3%, respectively, p<0.001) (Figure 5A). No significant differences in DFS rates were detected between high and low levels of ZIC2, ZIC3, ZIC4, or ZIC5 (p>0.05) (Figure 5). As shown in Table 5, we found that seven factors—ZIC1 expression, tumor size, histo- logic grade, lymph node metastasis, TNM staging, HER2 ex- pression, and targeted therapy—were related to DFS in uni- variate analysis; in the further multivariate analysis, five inde- pendent factors were identified: ZIC1 expression (HR, 0.395;
95% CI, 0.234–0.669; p=0.001), tumor size (HR, 1.838; 95%
CI, 1.090–3.101; p=0.022), histologic grade (HR, 1.936; 95%
CI, 1.123–3.340; p=0.018), TNM staging (HR, 2.559; 95% CI, Figure 4. Kaplan-Meier survival curves of overall survival for zinc fnger of the cerebellum (ZIC) family proteins expression in invasive breast cancer. (A) ZIC1, (B) ZIC2, (C) ZIC3, (D) ZIC4, and (E) ZIC5.
1.0
0.8
0.6
0.4
0.2
0
1.0
0.8
0.6
0.4
0.2
0
1.0
0.8
0.6
0.4
0.2
0
1.0
0.8
0.6
0.4
0.2
0
1.0
0.8
0.6
0.4
0.2
0 0 10 20 30 40 50 60
0 10 20 30 40 50 60
0 10 20 30 40 50 60
0 10 20 30 40 50 60
0 10 20 30 40 50 60 Months
Months
Months
Months
Months Survival functions
Survival functions
Survival functions
Survival functions
Survival functions
Cum survivalCum survival Cum survivalCum survival Cum survival
A
D
B
E
C
Low (n=121)
Low (n=132)
Low (n=111)
Low (n=148)
Low (n=133) ZIC1
ZIC4
ZIC2
ZIC5
ZIC3 High (n=120)
High (n=109)
High (n=130)
High (n=93)
High (n=108) Low-censored
Low-censored
Low-censored
Low-censored
Low-censored High-censored
High-censored
High-censored
High-censored
High-censored p<0.001
p=0.748
p=0.927
p=0.119
p=0.590
Table 4. Prognostic value of ZIC family proteins expression and clinicopathological factors for the overall survival by univariate and multivariate analyses with Cox regression
Variable HR 95% CI p-value Variable HR 95% CI p-value
Univariate analysis Multivariate analysis
ZIC1 expression: high vs. low 0.370 0.216–0.633 <0.001 ZIC1 expression: high vs. low 0.405 0.233–0.702 0.001 ZIC2 expression: high vs. low 0.977 0.598–1.597 NS
ZIC3 expression: high vs. low 1.145 0.701–1.870 NS ZIC4 expression: high vs. low 1.084 0.663–1.771 NS ZIC5 expression: high vs. low 1.478 0.905–2.416 NS Age (yr): >50 vs. ≤50 0.709 0.430–1.167 NS
Tumor size (cm): >5 vs. ≤5 2.039 1.234–3.370 0.005 Tumor size (cm): >5 vs. ≤5 1.762 1.014–3.062 0.044 Location: right vs. left 1.568 1.086–2.264 0.016 Location: left vs. right - - NS Histologic grade: 3 vs. 1 and 2 2.127 1.254–3.610 0.005 Histologic grade: 3 vs. 1 and 2 2.024 1.159–3.536 0.013 Lymph node metastasis: yes vs. no 1.949 1.179–3.221 0.009 Lymph node metastasis: yes vs. no - - NS TNM staging: III/IV vs. I/II 3.106 1.863–5.179 <0.001 TNM staging: III/IV vs. I/II 2.606 1.509–4.500 0.001 ER expression: high vs. low 0.587 0.357–0.964 0.035 ER expression: high vs. low - - NS PR expression: high vs. low 1.342 0.819–2.199 NS
HER2 expression: high vs. low 0.558 0.335–0.930 0.025 HER2 expression: high vs. low 0.535 0.317–0.905 0.020 Chemotherapy: CAF vs. AC-T 0.923 0.370–2.300 NS
Hormonal treatment: yes vs. no 0.665 0.401–1.104 NS Targeted therapy: yes vs. no 0.558 0.335–0.930 0.025
ZIC =zinc finger of the cerebellum; HR =hazard ratio; CI =confidence interval; NS =no significance; ER =estrogen receptor; PR =progesterone receptor;
HER2=human epidermal growth factor receptor 2; CAF=cyclophosphamide+doxorubicin+5-fluorouracil for 6 cycles; AC-T=doxorubicin+cyclophosphamide for first 4 cycles and paclitaxel for next 4 cycles.
Figure 5. Kaplan-Meier survival curves of dis- ease-free survival for zinc fnger of the cerebellum (ZIC) family proteins expression in invasive breast cancer. (A) ZIC1, (B) ZIC2, (C) ZIC3, (D) ZIC4, and (E) ZIC5.
1.0
0.8
0.6
0.4
0.2
0
1.0
0.8
0.6
0.4
0.2
0
1.0
0.8
0.6
0.4
0.2
0
1.0
0.8
0.6
0.4
0.2
0
1.0
0.8
0.6
0.4
0.2
0 0 10 20 30 40 50 60
0 10 20 30 40 50 60
0 10 20 30 40 50 60
0 10 20 30 40 50 60
0 10 20 30 40 50 60 Months
Months
Months
Months
Months Survival functions
Survival functions
Survival functions
Survival functions
Survival functions
Cum survivalCum survival Cum survivalCum survival Cum survival
A
D
B
E
C
Low
Low
Low
Low
Low ZIC1
ZIC4
ZIC2
ZIC5
ZIC3 High
High
High
High
High Low-censored
Low-censored
Low-censored
Low-censored
Low-censored High-censored
High-censored
High-censored
High-censored
High-censored p<0.001
p=0.771
p=0.806
p=0.100
p=0.417
1.517–4.318; p<0.001), and HER2 expression (HR, 0.580;
95% CI, 0.352–0.955; p=0.032).
DISCUSSION
The development of novel effective biomarkers to assist in diagnosing clinicopathologic features and to determine the prognosis of invasive breast cancer patients has become a popular research topic. For this, in our study, we detected the protein expressions of five ZIC family members and assessed their clinicopathologic and prognostic functions. First, the distributions of the ZIC family proteins differed. ZIC1–3 pro- teins were distributed both in the nucleus and cytoplasm, whereas ZIC4 and ZIC5 proteins were distributed in the nu- cleus alone. Although the ZIC family proteins were expressed in stem cells and associated with cell differentiation, we inves- tigated only ZIC family protein expression in breast or breast carcinoma and found that not all cancer cells within tumor tissues expressed higher ZIC protein levels [20]. In addition, only ZIC1 expression in tumors was obviously downregulated compared to that in the corresponding normal tissues, and there were no differences between tumor and normal tissues during the investigation of the other four proteins. Further comparative analyses indicated that the ZIC1 protein expres- sion level in invasive breast cancer was negatively correlated with lymph node metastasis and TNM staging. However, only
the finding of p=0.0056 (0.05/9) was significant according to Bonferroni correction (Table 3), which indicated that our findings (lymph node metastasis, p=0.024; TNM staging, p=0.015) may be accurate and a larger quantity of samples should be surveyed. Admittedly, there was significant hetero- geneity in the cellular composition of the samples. Thus, we chose representative tumor regions and normal breast tissues
>5 cm away from tumors to avoid this heterogeneity. In add- ition, Kaplan-Meier curves showed that invasive breast cancer patients with high ZIC1 protein expressions had higher 5-year OS rates and DFS rates than those with low expressions. Be- sides, other clinicopathologic factors, including tumor size, histologic grade, lymph node metastasis, TNM staging, and HER2 expression, ZIC1 expression might become an inde- pendent biomarker of OS and DFS in invasive breast cancer patients per our Cox analyses. However, the expression of other ZIC family proteins failed to assess clinicopathologic features or predict the prognosis of invasive breast cancer pa- tients. A recent study also confirmed that only decreased ZIC1 protein expression was associated with aggressive dis- ease progression and a poor prognosis of gastric cancer pa- tients through an IHC analysis of 160 cases [8].
With its control of various biological processes, such as cell division, cell differentiation, myogenesis, neurogenesis, and neurodevelopment, ZIC1 is usually expressed in normal tis- sues [21]. Several studies demonstrated that upregulated Table 5. Prognostic value of ZIC family proteins expression and clinicopathological factors for the disease-free survival by univariate and multivariate analyses with Cox regression
Variable HR 95% CI p-value Variable HR 95% CI p-value
Univariate analysis Multivariate analysis
ZIC1 expression: high vs. low 0.368 0.220–0.616 <0.001 ZIC1 expression: high vs. low 0.395 0.234–0.669 0.001 ZIC2 expression: high vs. low 0.943 0.588–1.512 NS
ZIC3 expression: high vs. low 1.216 0.758–1.950 NS ZIC4 expression: high vs. low 1.073 0.668–1.722 NS ZIC5 expression: high vs. low 1.488 0.927–2.388 NS Age (yr): >50 vs. ≤50 0.710 0.439–1.148 NS
Tumor size (cm): >5 vs. ≤5 2.173 1.344–3.514 0.002 Tumor size (cm): >5 vs. ≤5 1.838 1.090–3.101 0.022 Location: right vs. left 1.180 0.736–1.893 NS
Histologic grade: 3 vs. 1 and 2 1.950 1.159–3.280 0.012 Histologic grade: 3 vs. 1 and 2 1.936 1.123–3.340 0.018 Lymph node metastasis: yes vs. no 2.097 1.288–3.413 0.003 Lymph node metastasis: yes vs. no - - NS TNM staging: III/IV vs. I/II 3.099 1.896–5.067 <0.001 TNM staging: III/IV vs. I/II 2.559 1.517–4.318 <0.001 ER expression: high vs. low 0.657 0.409–1.056 NS ER expression: high vs. low - - NS PR expression: high vs. low 1.337 0.831–2.152 NS
HER2 expression: high vs. low 0.598 0.367–0.973 0.039 HER2 expression: high vs. low 0.580 0.352–0.955 0.032 Chemotherapy: CAF vs. AC-T 0.842 0.339–2.092 NS
Hormonal treatment: yes vs. no 0.702 0.429–1.147 NS Targeted therapy: yes vs. no 0.598 0.367–0.973 0.039
ZIC =zinc finger of the cerebellum; HR =hazard ratio; CI =confidence interval; NS =no significance; ER =estrogen receptor; PR =progesterone receptor;
HER2=human epidermal growth factor receptor 2; CAF=cyclophosphamide+doxorubicin+5-fluorouracil for 6 cycles; AC-T=doxorubicin+cyclophosphamide for first 4 cycles and paclitaxel for next 4 cycles.
ZIC1, an oncogene promoting cell proliferation and invasion, was involved in the progression and development of endome- trial cancer and liposarcoma [22,23]. However, accumulating evidence suggested that ZIC1 expression was significantly downregulated in various carcinomas and that overexpressed ZIC1 protein suppressed cell proliferation and induced apop- tosis by interfering with the mitogen-activated protein kinase, sonic hedgehog homolog, and phosphatidylinositol 3-hy- droxy kinase/protein kinase B pathways in vitro [4,5]. In add- ition, promoter hypermethylation of the ZIC1 gene in thyroid carcinoma, digestive system neoplasms, and gynecologic ma- lignant tumors might be responsible for ZIC1 protein down- regulation [4-8,24]. In cervical scrapes, levels of methylated ZIC1 were positively correlated with cervical intraepithelial neoplasia grade [25]. Especially in breast cancer, Nakakido et al. [15] found that the phosphatidylinositol glycan anchor bio- synthesis, class X-containing complex elevated BT-549 cell proliferation by inhibiting ZIC1 and then promoted breast cancer growth. Combined with these basic studies, our study showed that ZIC1 protein was a potential good prognostic marker. Despite methylated ZIC4 impelling breast cancer de- velopment in a previous study, our study failed to find any as- sociation between ZIC4 expression and clinicopathologic fea- tures or prognosis [16].
Three classic biomarkers of breast carcinoma (ER, PR, and HER2) were widely used to identify progression, predict prog- nosis, and select chemotherapy regimens for breast cancer pa- tients. In our study, we also found that only HER2 was an in- dependent biomarker of good prognosis in a Cox regression analysis. However, ZIC family member expression was not significantly associated with ER, PR, or HER2, indicating that ER, PR, and HER2 expression levels did not influence ZIC protein expression. This hypothesis requires confirmation in vitro and in vivo. In addition, further cytological studies and animal models were essential to investigate alterations of cell proliferation, apoptosis of breast cancer cells, and explore po- tential specific signaling pathways through lentivirus-mediat- ed overexpression of ZIC1 protein. As a result, we could also develop new regimens of chemotherapy or targeted therapy in future studies.
In summary, using western blotting analysis and IHC eval- uations, we concluded that ZIC1 was downregulated in breast tumors and could become a potential biomarker to infer the progression and predict the prognosis of invasive breast can- cer patients. Further fundamental and clinical studies would be worthwhile before application of this novel marker in the clinical setting.
CONFLICT OF INTEREST
The authors declare that they have no competing interests.
REFERENCES
1. Siegel RL, Miller KD, Jemal A. Cancer statistics, 2015. CA Cancer J Clin 2015;65:5-29.
2. Ali RG, Bellchambers HM, Arkell RM. Zinc fingers of the cerebellum (Zic): transcription factors and co-factors. Int J Biochem Cell Biol 2012;
44:2065-8.
3. Aruga J, Nagai T, Tokuyama T, Hayashizaki Y, Okazaki Y, Chapman VM, et al. The mouse zic gene family: homologues of the Drosophila pair-rule gene odd-paired. J Biol Chem 1996;271:1043-7.
4. Gan L, Chen S, Zhong J, Wang X, Lam EK, Liu X, et al.. ZIC1 is down- regulated through promoter hypermethylation, and functions as a tu- mor suppressor gene in colorectal cancer. PLoS One 2011;6:e16916.
5. Zhong J, Chen S, Xue M, Du Q, Cai J, Jin H, et al. ZIC1 modulates cell- cycle distributions and cell migration through regulation of sonic hedgehog, PI(3)K and MAPK signaling pathways in gastric cancer.
BMC Cancer 2012;12:290.
6. Qiang W, Zhao Y, Yang Q, Liu W, Guan H, Lv S, et al. ZIC1 is a putative tumor suppressor in thyroid cancer by modulating major signaling pathways and transcription factor FOXO3a. J Clin Endocrinol Metab 2014;99:E1163-72.
7. Wang YY, Jiang JX, Ma H, Han J, Sun ZY, Liu ZM, et al. Role of ZIC1 methylation in hepatocellular carcinoma and its clinical significance.
Tumour Biol 2014;35:7429-33.
8. Ma G, Dai W, Sang A, Yang X, Li Q. Roles of ZIC family genes in human gastric cancer. Int J Mol Med 2016;38:259-66.
9. Beukers W, Kandimalla R, Masius RG, Vermeij M, Kranse R, van Leenders GJ, et al. Stratification based on methylation of TBX2 and TBX3 into three molecular grades predicts progression in patients with pTa-blad- der cancer. Mod Pathol 2015;28:515-22.
10. Kandimalla R, van Tilborg AA, Kompier LC, Stumpel DJ, Stam RW, Bangma CH, et al. Genome-wide analysis of CpG island methylation in bladder cancer identified TBX2, TBX3, GATA2, and ZIC4 as pTa-spe- cific prognostic markers. Eur Urol 2012;61:1245-56.
11. Vural B, Chen LC, Saip P, Chen YT, Ustuner Z, Gonen M, et al. Frequen- cy of SOX Group B (SOX1, 2, 3) and ZIC2 antibodies in Turkish pa- tients with small cell lung carcinoma and their correlation with clinical parameters. Cancer 2005;103:2575-83.
12. Yang B, Jia L, Guo Q, Ren H, Hu D, Zhou X, et al. MiR-564 functions as a tumor suppressor in human lung cancer by targeting ZIC3. Biochem Biophys Res Commun 2015;467:690-6.
13. Sun Q, Shi R, Wang X, Li D, Wu H, Ren B. Overexpression of ZIC5 pro- motes proliferation in non-small cell lung cancer. Biochem Biophys Res Commun 2016;479:502-9.
14. Inaguma S, Ito H, Riku M, Ikeda H, Kasai K. Addiction of pancreatic cancer cells to zinc-finger transcription factor ZIC2. Oncotarget 2015;6:
28257-68.
15. Nakakido M, Tamura K, Chung S, Ueda K, Fujii R, Kiyotani K, et al.
Phosphatidylinositol glycan anchor biosynthesis, class X containing complex promotes cancer cell proliferation through suppression of
EHD2 and ZIC1, putative tumor suppressors. Int J Oncol 2016;49:868- 76.
16. Pavlova TV, Kashuba VI, Muravenko OV, Yenamandra SP, Ivanova TA, Zabarovskaia VI, et al. Technology of analysis of epigenetic and struc- tural changes of epithelial tumors genome with NotI-microarrays by the example of human chromosome. Mol Biol (Mosk) 2009;43:339-47.
17. Belev B, Alerić I, Vrbanec D, Petrovecki M, Unusic J, Jakić-Razumović J.
Nm23 gene product expression in invasive breast cancer: immunohis- tochemical analysis and clinicopathological correlation. Acta Oncol 2002;41:355-61.
18. Patel DD, Bhatavdekar JM, Chikhlikar PR, Ghosh N, Suthar TP, Shah NG, et al. Node negative breast carcinoma: hyperprolactinemia and/or overexpression of p53 as an independent predictor of poor prognosis compared to newer and established prognosticators. J Surg Oncol 1996;62:86-92.
19. Idirisinghe PK, Thike AA, Cheok PY, Tse GM, Lui PC, Fook-Chong S, et al. Hormone receptor and c-ERBB2 status in distant metastatic and locally recurrent breast cancer. Pathologic correlations and clinical sig- nificance. Am J Clin Pathol 2010;133:416-29.
20. Lyu Y, Nakano K, Davis RR, Tepper CG, Campbell M, Izumiya Y. ZIC2 is essential for maintenance of latency and is a target of an immediate-
early protein during KSHV lytic reactivation. J Virol 2017;91:e00980- 17.
21. Degreef I, De Smet L, Sciot R, Cassiman JJ, Tejpar S. Immunohisto- chemical evidence for Zic1 coexpression with beta-catenin in the myo- fibroblast of Dupuytren disease. Scand J Plast Reconstr Surg Hand Surg 2009;43:36-40.
22. Gu X, Liu Q, Yang N, Shen JF, Zhang XG, Cao F, et al. Clinicopathologi- cal significance of increased ZIC1 expression in human endometrial cancer. J Huazhong Univ Sci Technolog Med Sci 2015;35:898-903.
23. Brill E, Gobble R, Angeles C, Lagos-Quintana M, Crago A, Laxa B, et al.
ZIC1 overexpression is oncogenic in liposarcoma. Cancer Res 2010;70:
6891-901.
24. Huang RL, Gu F, Kirma NB, Ruan J, Chen CL, Wang HC, et al. Com- prehensive methylome analysis of ovarian tumors reveals hedgehog signaling pathway regulators as prognostic DNA methylation biomark- ers. Epigenetics 2013;8:624-34.
25. Verlaat W, Snijders PJ, Novianti PW, Wilting SM, De Strooper LM, Trooskens G, et al. Genome-wide DNA methylation profiling reveals methylation markers associated with 3q gain for detection of cervical precancer and cancer. Clin Cancer Res 2017;23:3813-22.