27
Bibliometric Approach to Research Assessment:
Publication Count, Citation Count, & Author Rank
ABSTRACT
We investigated how bibliometric indicators such as publication count and citation count affect the assessment of research performance by computing various bibliometric scores of the works of Korean LIS faculty members and comparing the rankings by those scores. For the study data, we used the publication and citation data of 159 tenure-track faculty members of Library and Information Science departments in 34 Korean universities. The study results showed correlation between publication count and citation count for authors with many publications but the oppo-site evidence for authors with few publications. The study results suggest that as authors publish more and more work, citations to their work tend to increase along with publication count. However, for junior faculty members who have not yet accumulated enough publications, citations to their work are of great importance in assessing their research performance. The study data also showed that there are marked differences in the magnitude of citations between papers published in Korean journals and papers published in international journals.
Keywords: Bibliometrics, Citation Analysis, Author Rank, Research Assessment
1. INTRODUCTION
In the fairy tale of “Snow White,” the evil queen asks the magic mirror the following question: “Mirror, mirror, on the wall, who is the fairest of them all?” From a research perspective, this is a loaded question that invites consideration of a
range of issues on quality assessment. How do we assess beauty? Is it quantifiable? Is there an objec-tive standard for beauty? After all, isnØt beauty in the eye of the beholder? Research assessment, being ultimately an exercise in quality assessment, shares much in common with assessment of beauty, although one may argue that research is much more tangible
Received date: November 25, 2012 Accepted date: February 22, 2013 *Corresponding Author: Kiduk Yang Associate professor
Department of Library and Information Science Kyungpook National University, Republic of Korea E-mail: kiyang@knu.ac.kr
All JISTaP content is Open Access, meaning it is accessible online to everyone, without fee and authors’ permission. All JISTaP content is published and distributed under the terms of the Creative Commons Attribution License (http://creativecom-mons.org/licenses/by/3.0/). Under this license, authors reserve the copyright for their content; however, they permit anyone to unrestrictedly use, distribute, and reproduce the content in any medium as far as the original authors and source are cited. For any reuse, redistribution, or reproduction of a work, users must clarify the license terms under which the work was produced. Open Access
http://dx.doi.org/10.1633/JISTaP.2013.1.1.2
Kiduk Yang*
Department of Library and Information Science Kyungpook National University, Republic of Korea Email: kiyang@knu.ac.kr
Jongwook Lee
School of Library and Information Studies Florida State University, USA
Email: nadoopro@gmail.com Journal of Information Science Theory and Practice
than beauty and therefore easier to quantify.
When we evaluate a researcher, however, we often assess the person for his or her research potential rather than simply basing our judgments on the one-dimensional examination of existing research outcome. The determination of research potential encompasses consideration of three key aspects: capability, experience, and impact. The main component of research capability is the researcherØs knowledge and skill set, which is accrued initially by education and then by experi-ence. Although its impact is secondary, the compu-tational, organizational, and operational support infrastructure of the organization the researcher is affiliated with also influences research potential. The third component of research capability is net-working ability, which grows in importance as col-laboration becomes the norm rather than the exception in a modern day research environment. Research experience, with the typical lifecycle of grant proposal, project management, and publica-tion, is directly related to research capability in that it is the natural outcome of research capability.
Research impact, on the other hand, is not neces-sarily proportional to research capability and expe-rience. For instance, a capable researcher with plen-ty of experience may not have as much impact as a young researcher on the trail of a hot topic. If the research experience is the quantitative outcome of research capability, the research impact is the con-sequence of research quality and significance. Just as research capability and experience reinforce each other, research impact and experience feed off one another. The impact of a researcher, demonstrated by citations to and extension of his or her work in related studies, helps the researcher to obtain fund-ing, which fuels his or her research productivity and thus increases the impact potential.
Among the three aspects of research potential, experience and impact are more readily measurable than capability since they are tangible outcomes of research activity as opposed to qualitative condi-tions for producing those outcomes. In fact, research experience and impact are components of research performance, which is typically the main target of assessment in bibliometric analysis. The bibliomet-ric approach to research assessment, however, does
not adequately capture all the facets of research performance. In bibliometric analysis, research quantity, i.e., how much research has been done, is usually measured in terms of the number of publi-cations the research generates, and impact, i.e., how significant the research contribution is, is approxi-mated by the number of citations to the publica-tions that the research produces. To properly assess the quality of research, however, one must look at not only the count of citations but also the sources and contexts of citations so that the true impact of research that each citation implies can be ascer-tained.
1.1. Research Assessment Metrics
There are several research assessment metrics which are often used in bibliometric analysis. Citation count, i.e., the number of citations to a publication, is a document-level measure used to approximate the impact or importance of a paper, whereas publication count, i.e., the number of pub-lications, is an author-level measure that represents an authorØs research productivity. Another author-level measure that takes into consideration both the impact and productivity of a researcher is h-index (Hirsh, 2005). h-index is computed by sorting the publications of a given author by the descending order of citation count and finding the rank of pub-lication at which the citation count is equal to or greater than the rank. In this way, an author with h-index of k is guaranteed to have k papers with at least k or more citations to each paper. The strength of h-index lies in the fact that it requires many high impact papers to achieve a high score. In other words, neither the authors with many papers that are cited infrequently nor the authors with a few papers that are cited highly will receive high h-index scores.
h-index, however, is not good at differentiating among authors with similar publication and cita-tion patterns but different citacita-tion magnitudes. As Table 1 illustrates, authors with a higher number of citation counts at top ranks (e.g., author 1) can get the same h-index as other authors with fewer cita-tions (e.g., author 2) as long as their citation counts near the h-index rank are similar. g-index, proposed by Egghe (2006), compensates for this weakness of
29
http://www.jistap.org29
http://www.jistap.orgh-index by using the cutoff rank criteria as the rank at which the accumulative citation counts are equal to or greater than the rank squared, thus taking into consideration the total number of citations for high-ly cited papers.
Another way to assess the quality of publications other than citation count is to consider the venue of publication. A paper published in a high impact journal can be regarded to be of higher quality than a paper published in a low impact journal. The pop-ular metric for assessing the impact of a journal is given by the impact factor, which is computed by dividing the number of citations in a given year to papers published in a journal during the prior two years by the number of publications in those years (Equation 1). Impact factor, being the average num-ber of citations to a paper for a journal, suffers from the same weakness as the citation counts which estimate the impact of a publication in that they treat all citations to be of equal importance, which can be a gross oversight in reality.
IF = citation counts in year Y to papers in Y-1 & Y-2
publication counts in Y-1 & Y-2 (1) Eigenfactor (Bergstrom, 2007) addresses this shortcoming of impact factor by estimating the importance of citing journals similar to GoogleØs PageRank approach. As can be seen in Figure 1, d1 and d2 both have two citations but one of the
papers that cites d1 is much more important (indi-cated by its size) due to its own citation counts. Eigenfactor captures this property with a recursive link propagation algorithm (Equation 2). Unfortunately, computation of recursive link propagation mea-sures such as Eigenfactor requires a complete set of the citation network, which is impractical if not impossible for most people. The computation, not to mention data collection, needed to apply an eigenfactor-like algorithm at an author- or docu-ment-level is prohibitively complex, so it is doubtful whether such measures can be computed in a dynamic fashion even with an inside access to cita-tion databases such as Web of Science and Scopus.
R(P) =
“
R(Pi)C(Pi)
(2)
1.2. Challenges for Research Assessment
Like the assessment of beauty, research assess-ment is an inherently subjective task that strives for objective standards by means of commonality. The Table 1. Example: h-index vs. g-index
(Author 1) h-index=5, g-index=8 (Author 2) h-index=5, g-index=6
P CC >h CC+ >g 1 8 1 8 1 2 7 2 15 4 3 6 3 21 9 4 6 4 27 16 5 5 5 32 25 6 5 6 37 36 7 5 7 42 49 8 4 8 46 64 9 4 9 50 81 P CC >h CC+ >g 1 20 1 20 1 2 10 2 30 4 3 8 3 38 9 4 8 4 46 16 5 5 5 51 25 6 5 6 56 36 7 5 7 61 49 8 4 8 65 64 9 4 9 69 81 d1 d2
Fig. 1 Link Propagation Example
k i=1
input, outcome, and methods for research assess-ment depend on who is evaluating whom for what purpose and in what context. At the same time, research assessment should be a consistent and methodological process that produces a valid and robust outcome. Consequently the first issue in research assessment is whether to take a qualitative approach, in which subjective criteria suitable for the purpose and context of assessment can be applied to evaluate research performance in a com-prehensive manner, or to take the quantitative approach that employs standard evaluation metrics to generate comparable assessment outcomes.
The qualitative approach has the advantages of human judgment, flexibility, and customization, but is a resource-intensive process with a lack of standardized criteria and methodology that can lead to inconsistent or biased results. The quantita-tive approach is a fairly standardized process which can be applied to evaluate and compare a large amount of data in an efficient manner. However, the evaluative outcome, which is based on only those facets of research performance that are readi-ly quantifiable, is neither as holistic nor personal-ized as that arrived at by the qualitative approach. Furthermore, the quantitative approach typically does not adequately take into consideration the dif-ferences among base units of evaluation (e.g., cita-tions, publications), thus sacrificing the accuracy of assessment for the sake of simplification. On top of these challenges, properly assessing the contribu-tion of each author for a collaborative work is a troublesome undertaking. Estimating author contri-butions by the order of authorship (i.e. author rank) in a multi-author paper is guess work at best and does not always correspond to the true contribu-tions that authors put forth to the publication in question.
In addition to the challenges inherent in assess-ment approaches are the sources of evaluation data, especially for the quantitative approach. The publi-cation and citation data that feed into research per-formance assessment are collected from citation databases such as Web of Science, but citation data-bases suffer from lack of comprehensive coverage and standard data inclusion criteria that can lead to inconsistent outcomes (Meho & Yang, 2007; Yang et
al., 2012). Moreover, citation databases are not yet very user-friendly for research assessment tasks that require more than raw publication and citation counts.
Faced with these challenges for research assess-ment, meaningful and consistent analysis of biblio-metric data is no trivial task. Until the coverage, quality, and usability of citation databases are sig-nificantly enhanced, we must keep in mind that bibliometric indicators are only as reliable as their data sources and methods employed to produce them. Although the approach to citation database enhancement is one of the core issues in our project (Yang & Meho, 2011), we focused on examining bib-liometric measures for research assessment in the current study. Specifically, we investigated how robust different bibliometric indicators are in assessing research performance.
1.3. Study Design
In order to test the reliability and stability of bib-liometric indicators (BI) for research assessment, we compared the rankings of faculty members by vari-ous BI scores, such as publication count, citation count, and h-index. By comparing the rankings, we hoped to gain insights into the aspects of research performance measured by BIs and to determine how robust the assessment may be.
1.3.1. Study Data
For the study data, we used the publication and citation data of 159 tenure-track faculty members of Library and Information Science (LIS) departments in 34 Korean universities (Yang & Lee, 2012). The study data included 2402 peer-reviewed papers published between 2001 and 2010, 2232 of which were Korean journal papers, 111 international jour-nal papers, and 59 internatiojour-nal conference papers. We collected 2811 citations to 871 papers (1531 papers had no citations), 1452 of which were cita-tions to Korean journal papers, 1116 were to 93 international journals, and 243 citations were to 38 international conference proceedings.
We initially compiled the publication list of 146 faculty members from the National Research Foun-dation’s (NRF) Korean Researcher Information (KRI) system, which was supplemented by 4
author-31
http://www.jistap.org supplied publication lists and publicationinforma-tion for 9 addiinforma-tional authors from the Korea Institute of Science and Technology InformationØs (KISTI), Science and Technology Society Village (STSV), and Nurimedia’s DBPIA citation database. KRI publication data was then validated and sup-plemented by double-checking with STSV, DBPIA, and Naver’s Scholarly Publication Database service, after which Google Scholar was searched to update the international publication data (e.g., SSCI journal papers).
After all the publication data was compiled, we collected the citation data from KISTI’s Korean Science Citation Index (KSCI) and NRF’s Korea Citation Index (KCI). Since the KCI data appeared to be sparsely populated at the time of data collection, we used the KSCI to obtain citations to the five major Korean LIS journals and used KCI to obtain citations to other miscellaneous journal papers.1 The citations to international publications were col-lected from Web of Science and Google Scholar. The inclusion criteria for publication were as follows: For Korean publications, only the papers published in KCI journals were included.2For international publications, only the papers published in peer-reviewed journals as indicated in Ulrich’s Periodicals and peer-reviewed conferences as verified in the conference websites were included.
2. RELATED RESEARCH
Although counting citations to estimate the quali-ty of scholarly publication is fundamental to cita-tion analysis (Garfield, 1979; Smith, 1981; Cronin, 1984), the effectiveness of citation count as a surro-gate measure for publication quality has been ques-tioned by researchers (MacRoberts & MacRoberts, 1996; Seglen, 1998). Limitations reported in litera-ture range from the problems associated with
limit-ed data sources, sparse coverage of non-English publications, and omission of citations from non-journal sources (e.g., books, conferences), to many technical problems dealing with synonyms, homonyms, and authority control (Funkhouser, 1996; Meho & Yang, 2007; Seglen, 1998).
Meho and Yang (2007) conducted a citation study that further demonstrated the necessity of using multiple citation sources. The study used citations to more than 1,400 works by 25 library and informa-tion science faculty to examine the effects of adding Scopus and Google Scholar data on the citation counts and rankings of these faculty members as measured by WoS. The study found that the addi-tion of Scopus citaaddi-tions to those of WoS significantly altered the relative ranking of faculty in the middle of the rankings. The study also found that Google Scholar stands out in its coverage of conference proceedings as well as international, non-English language journals. According to the authors, the use of Scopus and Google Scholar, in addition to WoS, reveals a more comprehensive and complete pic-ture of the extent of the scholarly relationship bet-ween library and information science and other fields. Despite criticisms, which are largely concerned with the comprehensiveness of citation data sources, proponents have reported the validity of citation counts in research assessments as well as the positive correlation between them and peer reviews and lists of publications. In citation studies that compared peer assessment to citation counts (Oppenheim, 1995; Holmes & Oppenheim, 2001), researchers found that peer ratings of academic departments are strongly correlated to the citation counts for the publications by the members of departments. In a study that compared the results of expert surveys with citations to 10 German-lan-guage journals, Schloegl and Stock (2004) found strong correlation (+0.7) between reading frequency and the regional impact factor,3the impact factor of
1
KSCI covers only science and engineering journals whereas KCI covers journals in all disciplines. Since the five major LIS journals covered in KSCI make up the bulk of LIS publications, it is likely that other journals may be of non-LIS disciplines and covered in KCI rather than KSCI.
2
KCI journals are those journals selected by the NRF to be included in KCI. They are similar to ISI journals in that they are regarded as high quality publi-cations. There are 4 KCI journals in the LIS field.
3
To adjust the journal impact factor for a given region, the regional impact factor was computed by adding journal self-citation counts and numbers of citations from regional journals to the numerator of the impact factor formula.
journals, while finding slightly negative correlation (-0.11) between reading frequency and the overall impact factor. In addition to giving more evidence to the validity of citation count as a measure of research impact, Schloegl and Stock’s study under-scored the importance of appropriate application of citation analysis by showing how simple adjustment for region resulted in a much different outcome. Li et al. (2010), who conducted a study correlating the results from an expert survey of publications by researchers with citation-based author scores (e.g., h-index, g-index) using WoS, Scopus, and Google Scholar data, found that expert assessment of schol-arly work is strongly correlated to automatic quan-tification of research performance by citation analy-sis. The authors cautioned, however, that the mag-nitudes of correlation, though statistically signifi-cant, were not at levels where citation-based indica-tors could substitute for expert judgments.
While the bulk of citation analysis studies has been focused on validating citation-based measures against the gold standard of human judgment, some researchers have explored the idea that not all citations are created equal (Cronin, 1984). Google’s PageRank (Brin & Page, 1998) can be regarded as an adaptation of Pinski and Narin’s algorithm to the setting of the Web to estimate the importance of web pages. A recent application of link-propagated citation weighting is the Eigenfactor score (Bergstrom, 2007), which calculates the impact of journals by aggregating citation weights that are computed in a manner similar to the PageRank score. Aside from differentiating articles according to their importance or impact, a publication by multi-ple authors may be assigned a weight that corre-sponds to the contribution of each author. Zhang (2009) proposed a citation weighting scheme that multiplies the raw citation count by “co-author
weight coefficients”4based on author rank (i.e., the order of authors) to differentiate among contribu-tions of multiple authors. Zhang extended an earlier reciprocal-rank based weighting proposal (Seker-cioglu, 2008) that assigned the weight of 1/k to kth ranked co-author with the formula shown below that linearly transformed previously hyperbolic author weight distribution.5
c(k, n)= 2(n-k+1)
(n+1)(n-2),
{n√ 4, 2 ¬ k ¬ n-1} (3)
Literature on bibliometric assessment of Korean faculty research is limited mostly to studies that analyze the publication data. A few studies that make use of the citation count rely on Web of Science, which does not have the complete citation data for Korean publications. Chung (2009), who evaluated the scholarly work of 41 Korean LIS pro-fessors published between 2003 and 2007 (239 jour-nal articles and 49 monographs), compared the publication counts of authors with publication counts weighted according to faculty evaluation guidelines used in typical Korean universities.6 Chung emphasized the importance of qualitative over quantitative analysis of scholarly publications; however, his study did not delve deeply into specifics of the qualitative approach beyond the simple application of somewhat arbitrary publica-tion quality standards (i.e., faculty evaluapublica-tion guide-lines). Yang and Lee (2012), in an analysis of 2,401 publications authored by 159 Korean LIS professors between 2001 to 2010, ranked LIS departments in Korea by publication counts in various categories, such as domestic (i.e., Korean) papers, international papers, per faculty, and overall, to highlight the effect of different bibliometrics on evaluative outcomes.
4
First and corresponding authors are each given weights of 1 while the weights of remaining authors sum to one with co-author weights being inversely proportional to author ranks.
5
In the special case of c(2,3), the weight of 0.7 is assigned.
6
In many universities in Korea, faculty evaluation guidelines specify how research performance should be assessed. For instance, the guidelines may specify that articles published in SCI or SSCI journals receive 150 points while articles published in Korean journals of equivalent status obtain 100 points.
33
http://www.jistap.org3. STUDY RESULTS
In order to test the reliability and stability of bib-liometric indicators (BI) for research assessment, we compared the rankings of faculty members by vari-ous BI scores, such as publication count, citation count, and h-index. By comparing the rankings, we hoped to gain insights into the aspects of research performance measured by BIs and to learn how robust the assessment may be.
3.1 Publication Count vs. Citation Count
We first compared the ranking of the authors by publication count (PC) with the ranking by citation count (CC). Table 2 shows the top 20 faculty mem-bers ranked by PC versus the top 20 by CC. It can be seen that in the left table where authors are ranked by PC, large PC and CC rank differences (rows in red) are due to high PC and low CC. In other words,at least 4 out of 20 most-published authors in the study sample have very few citations to their work despite the high numbers of papers that they pro-duced. On the other hand, large rank differences in the right table, where authors are ranked by CC, are caused by a handful of highly cited papers. For example, the top ranked author (P075) had four papers cited 179, 30, 26, and 18 times respectively, and the second ranked author had a paper with 87 citations and another with 45 citations. Similarly, the fourth and fifth ranked authors (P008 and P033) had 29, 20, 19, and 19 citations and 27, 23, and 21 citations respectively, and so on. Another interesting fact is that these highly cited papers are all interna-tional publications, whereas most of the papers with few citations in the right table are published in Korean journals.
To ascertain whether PC and CC measure the same or different aspects of research performance, we computed the Spearman’s rank order
correla-Table 2. Top 20 Authors by Publication Count (PC) and Citation Count (CC)
AuID PC CC PC-rank CC-rank Rank Diff
P091 63 77 1 8 7 P044 49 38 2 14 12 P077 48 78 3 7 4 P042 46 29 4 20 16 P041 44 38 5 15 10 P111 39 134 6 3 -3 P069 38 3 7 108 101 P133 37 86 8 6 -2 P089 37 28 9 23 14 P037 36 57 10 10 0 P018 36 37 11 16 5 P110 35 45 12 12 0 P006 34 25 13 28 15 P131 33 9 14 74 60 P028 32 35 15 17 2 P050 32 1 16 138 122 P104 31 29 17 21 4 P015 30 1 18 139 121 P007 29 32 19 18 -1 P005 29 26 20 26 6
AuID CC PC CC-rank PC-rank Rank Diff
P075 333 22 1 31 30 P051 186 22 2 32 30 P111 134 39 3 6 3 P008 134 19 4 41 37 P033 123 12 5 77 72 P133 86 37 6 8 2 P077 78 48 7 3 -4 P091 77 63 8 1 -7 P011 58 6 9 129 120 P037 57 36 10 10 0 P073 54 18 11 44 33 P110 45 35 12 12 0 P129 42 20 13 38 25 P044 38 49 14 2 -12 P041 38 44 15 5 -10 P018 37 36 16 11 -5 P028 35 32 17 15 -2 P007 32 29 18 19 1 P101 32 15 19 58 39 P042 29 46 20 4 -16
tion. For the entire rank of 159, Spearman’s rho showed positive association (p = 0.7045). PC and CC both being the measures of research performance, overall association between two indicators showing positive correlation seemed reasonable since pock-ets of differences are likely to be hidden when aver-aged over the entire ranking. To examine the rank differences at a finer grade, we computed the rank correlation for the rank intervals of 20 (Table 3). We can see clearly that PC and CC are not correlated at rank intervals, which indicates that PC and CC mea-sure different aspects of research performance. Table 3 also shows that the strength of association gets weaker at lower rank intervals, which suggests the importance of citation counts for authors with low publication counts.
3.2. Author Rank Effect
Collaborative research projects produce publica-tions with multiple authors. Typically, the first author is the main contributor with co-authors list-ed in the order of contribution amount. An excep-tion to this format occurs when there is a corre-sponding author, who may sometimes be listed as the last author but whose contribution can be com-parable to the first or the second author. A corre-sponding author may be someone akin to the prin-cipal investigator of a research project, who archi-tected and directed the research that produced the publication, while the first author did the leg work and wrote the bulk of the paper. In such an
instance, the contribution of the corresponding author should be counted heavily regardless of the author order. Zhang (2009), for example, assigns an author weight of 1 to both the first author and corre-sponding author, while remaining co-authors are assigned weights that diminish with the author order.
However, there is no guarantee regarding the contribution of the corresponding author and the order of authorship linearly corresponding to the contribution amount. Co-author contributions will probably vary from case to case, so the most accu-rate assessment should come from authors them-selves. Since such information is impractical to col-lect in a large scale as well as being subject to per-sonal bias and subjective interpretations, one must turn to readily available evidence, which is the order in which authors are listed in a publication. Based on the assumption that an author’s contribution to a collaborative work should correspond to what we call the “authorRank” (i.e. author order), we com-pared the raw citation count (CC) with citation counts weighed by their estimated contribution to the paper that is being cited. The first weighting for-mula (CC2) is a modified version of ZhangØs (2009) co-author weights. Since our study data did not include information on who the corresponding authors are, we assigned the first author the weight of 1 and the co-authors diminishing weights that sum to 1. The formula for CC2 is shown in Equation 4.
CC2 = cc*auwt
1,
auwt=
aucnt- aurank+1
0.5*aucnt*(aucnt-1),
We also computed the second co-author weight-ing formula for citation count (CC3) usweight-ing 1 over authorRank (Equation 5) and the third formula using 1 over author count (Equation 6). CC3 uses diminishing author weights, the sum of which can exceed the first author weight of 1, while CC4 assigns all co-authors the same weights that can be a small fraction of the first author weight for publi-cations with many authors. An example shown in Table 4 illustrates the differences in the authorRank formulas.
Table 3. Spearman’s Rank Order Correlation at Rank Intervals:
Publication Count vs. Citation Count
(df=18, =0.05, CV=0.447) Rank p (PC-CC) 1-20 0.5677 21-40 0.0606 41-60 0.1321 61-80 0.4439 81-100 0.2465 101-120 -0.0116 121-140 0.0666 141-159 0.0320 aurank= 1 aurank> 1 (4)
{
˝
35
http://www.jistap.orgAuID PC CC CC2 CC3 CC4 CC-rank CC2-rank CC3-rank CC4-rank
P075 22 333 332 239 163 1 1 1 1 P051 22 186 108 108 64 2 4 3 6 P111 39 134 132 91 84 3 2 4 3 P008 19 134 118 118 95 4 3 2 2 P033 12 123 80 78 74 5 6 6 4 P133 37 86 86 82 42 6 5 5 9 P077 48 78 75 72 63 7 8 8 7 P091 63 77 77 77 69 8 7 7 5 P011 6 58 58 58 58 9 9 9 8 P037 36 57 57 51 37 10 10 11 11 P073 18 54 54 54 42 11 11 10 10 P110 35 45 42 34 24 12 12 12 16 P129 20 42 42 31 27 13 13 15 13 P044 44 38 30 26 21 14 17 22 22 P041 49 38 37 30 22 15 14 16 19 P018 36 37 34 31 21 16 16 14 21 P028 32 35 35 33 24 17 15 13 15 P007 29 32 29 28 20 18 20 19 23 P101 15 32 30 29 23 19 18 18 18 P042 46 29 25 20 13 20 24 27 33
Table 5. Top 20 Authors by Citation Counts, Using AuthorRank Weights
Aurank Auwt CC CC2 CC3 CC4 1 1 10 10 10 10 2 4/10 10 4 5 2 3 3/10 10 3 3.3 2 4 2/10 10 2 2.5 2 5 1/10 10 1 2 2
Table 4. Example: AuthorRank Weights Applied to Citation Counts
(5) (6)
CC3 = CC * aurank1
CC4 = CC *aucnt1
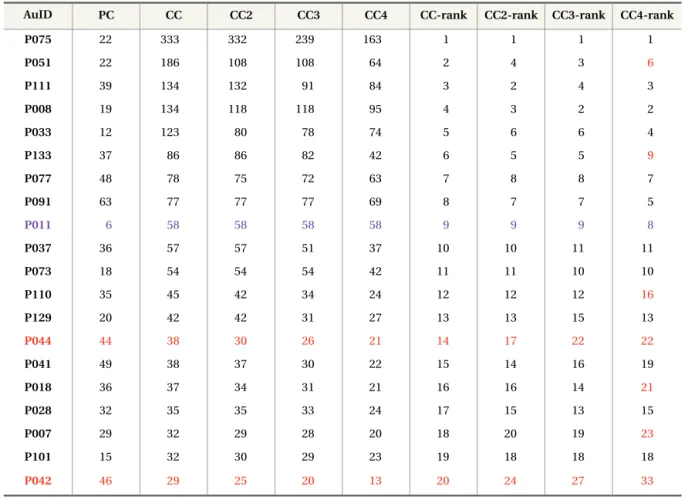
When we compared the rankings of authors by CC, CC2, CC3, and CC4, we observed only small
dif-ferences in rankings across authorRank weight for-mulas (Table 5). We attribute this to the fact that only about half of the study data is co-authored (31% with 2 authors, 16% with 3 or more authors). For the 51% of the single author papers, authorRank weights can have no effect, thus the authorRank effect is muted when averaged out over the entire
study data. One notable occurrence in the Spearman’s coefficient table (Table 6) is the low numbers in the CC-CC4 column, which suggests that the raw citation count, which passes the entire impact indicator of a given paper to all authors equally, is quite different from CC4, which passes only a fraction of the impact indicator amount to the co-authors.
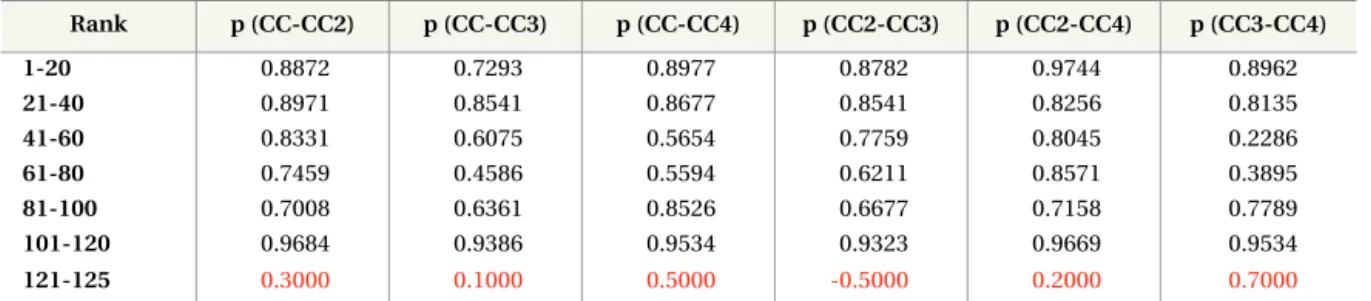
To isolate the effect of authorRank, we excluded single-author publications and redid the rank com-parisons with authorRank. There were 1136 out of 2402 papers that were co-authored, 65% of which were written by 2 authors and 35% with 3 or more authors. As can be seen in Table 7, the rank differ-ences are more pronounced without the single author papers, but Spearman’s coefficients still
Rank p (CC-CC2) p (CC-CC3) p (CC-CC4) p (CC2-CC3) p (CC2-CC4) p (CC3-CC4) 1-20 0.9085 0.9504 0.9263 0.9714 0.9143 0.9278 21-40 0.5474 0.4632 0.2752 0.8361 0.4316 0.6331 41-60 0.7895 0.6677 0.1789 0.9128 0.3574 0.4120 61-80 0.8376 0.4571 0.4632 0.5579 0.5173 0.7230 81-100 0.7955 0.5143 0.2346 0.7805 0.5008 0.2526 101-120 0.8421 0.6090 0.3429 0.7910 0.7188 0.8090 121-140 0.9474 0.7744 0.3729 0.7594 0.5699 0.5444 141-159 0.9959 0.9959 0.9876 0.9794 0.9732 0.9794
Table 6. Spearman’s Rank Order Correlation at Rank Intervals, Using AuthorRank Weights
AuID PC CC CC2 CC3 CC4 CC-rank CC2-rank CC3-rank CC4-rank
P075 20 298 297 204 128 1 1 1 1 P051 13 163 85 85 49 2 4 2 4 P111 24 96 94 53 46 3 2 4 2 P133 37 86 86 82 42 4 3 3 3 P033 8 70 27 25 21 5 10 9 6 P008 10 61 45 45 22 6 5 5 5 P037 25 37 37 31 17 7 6 6 7 P110 28 35 32 24 14 8 7 11 9 P129 14 31 31 20 16 9 8 15 8 P041 34 29 28 21 13 10 9 13 12 P018 27 29 26 23 13 11 12 12 11 P042 38 28 24 19 12 12 15 17 15 P044 27 27 20 15 10 13 19 20 18 P160 2 27 4 6 4 14 64 44 39 P138 12 27 27 27 14 15 11 7 10 P077 35 26 23 20 11 16 16 14 16 P039 13 26 26 26 13 17 13 8 13 P073 6 25 25 25 13 18 14 10 14 P017 16 24 7 9 6 19 42 31 27 P006 28 23 14 12 8 20 23 24 21
Table 7. Top 20 Authors by Citation Counts, Using AuthorRank Weights (aucnt>1)
37
http://www.jistap.org showed little differences and thus an insignificanteffect of authorRank (Table 8). The strength of asso-ciation, especially in the top rank interval, is weaker than when single-author papers were included, which may be due to a few authors who received many citations as authors. Restricting to co-authored papers reduced the total number of authors in the study data from 159 to 125, so the last row in the Spearman’s coefficient table spanned the rank interval of 5 instead of 20. The rhoØs in the rank interval of 121-125 turned out to be all statistically insignificant, but we considered the ranking
differ-ence in such a small interval to be not meaningful for gauging differences in bibliometric measures even if such outcomes were not spurious.
To isolate the authorRank effect further to the point of magnification, we excluded all publications from the study data where the faculty members in the study were listed as first authors. The resulting data subset included 107 authors that published 594 papers, where 61% were 2-author papers and 39% were papers with 3 or more authors. As expected, the rank differences became more pronounced with a restricted dataset (Table 9) with smaller rho across
Rank p (CC-CC2) p (CC-CC3) p (CC-CC4) p (CC2-CC3) p (CC2-CC4) p (CC3-CC4) 1-20 0.8872 0.7293 0.8977 0.8782 0.9744 0.8962 21-40 0.8971 0.8541 0.8677 0.8541 0.8256 0.8135 41-60 0.8331 0.6075 0.5654 0.7759 0.8045 0.2286 61-80 0.7459 0.4586 0.5594 0.6211 0.8571 0.3895 81-100 0.7008 0.6361 0.8526 0.6677 0.7158 0.7789 101-120 0.9684 0.9386 0.9534 0.9323 0.9669 0.9534 121-125 0.3000 0.1000 0.5000 -0.5000 0.2000 0.7000
Table 8. Spearman s Rank Order Correlation at Rank Intervals, Using AuthorRank Weights (aucnt>1)
AuID PC CC CC2 CC3 CC4 CC-rank CC2-rank CC3-rank CC4-rank
P075 5 187 186 93 93 1 1 1 1 P051 5 101 23 23 18 2 3 3 3 P111 20 85 83 42 42 3 2 2 2 P033 6 61 18 16 16 4 7 4 4 P160 9 27 4 5 4 5 31 14 18 P110 24 23 20 12 10 6 5 5 6 P129 10 22 22 11 11 7 4 6 5 P008 4 22 6 6 6 8 20 12 13 P044 20 21 14 9 8 9 9 8 8 P017 9 20 3 5 4 10 36 16 21 P035 12 19 19 10 10 11 6 7 7 P006 20 18 9 7 6 12 12 10 11 P041 14 16 15 8 8 13 8 9 9 P042 22 15 11 6 6 14 11 11 10 P037 7 12 12 6 6 15 10 13 12 P018 12 11 8 5 4 16 14 15 15 P077 16 10 7 4 4 17 18 18 16 P133 24 9 9 5 5 18 13 17 14 P104 14 9 5 4 3 19 25 23 23 P116 10 9 7 4 4 20 17 19 20
Table 9. Author Rankings by Citation Counts Weighted by AuthorRank Weights (aurank>1)
rank intervals (Table 10), which serves as evidence that non-primary author contributions should be treated differently from primary author contributions.
3.3. Publication Count and Citation Count vs.
h-index and g-index
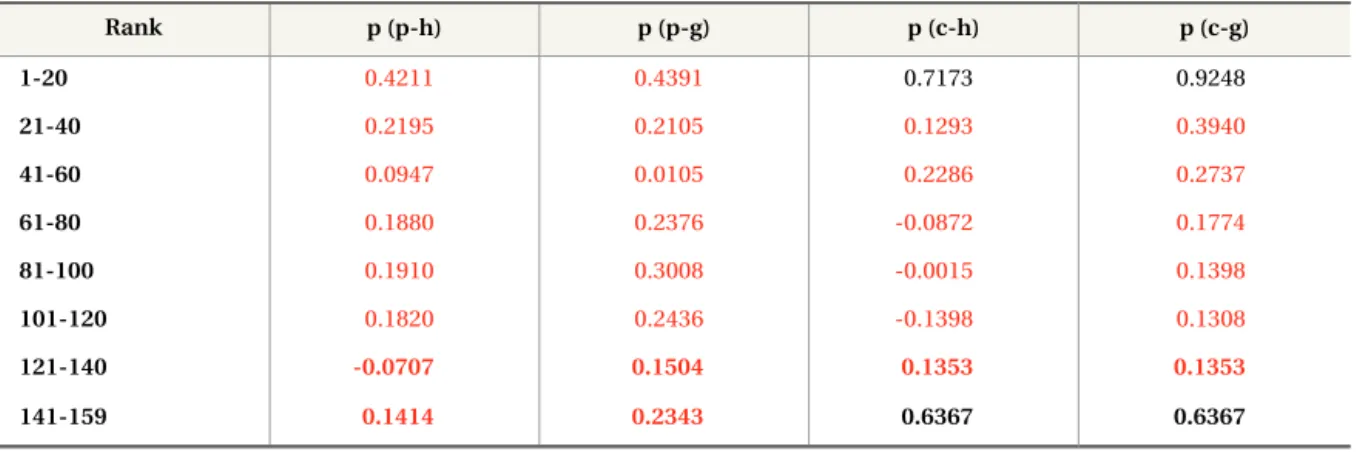
In addition to comparing publication count and citation count, which measure quantity and quality of research respectively, we investigated h-index and g-index, which consider both quantity and quality of research. The fact that rankings by publi-cation count and h-index (p-h) and by publipubli-cation count and g-index (p-g) show significant ranking differences in all rank intervals demonstrates inher-ent differences in what publication count measures and what h- or g-index measure (Table 11). Rankings by citation count and h-index (c-h) and by publica-tion count and g-index (c-g) show significant
rank-ing differences in all rank intervals except for the very top and very bottom rank intervals, which could reflect the tendency of citations to overwhelm the h- and g-index computations for authors with very high or low citation counts.
Table 12 shows the Spearman’s coefficients for the entire 159 authors with additional comparisons of authorRank weights, where suffixes correspond with authorRank formulas. For instance, h2 is rank-ing by h-index where citation counts are weighted with the author weight formula (CC2), h3 uses the author rank formula (CC3), and h4 uses the author count formula. The strength of association between publication count and h-/g-index using CC2 are consistently lower than for other ranking compari-son pairs, which suggests that CC2 (author weight) formula may be the most robust authorRank weight-ing formula used in the study.
Rank p (CC-CC2) p (CC-CC3) p (CC-CC4) p (CC2-CC3) p (CC2-CC4) p (CC3-CC4) 1-20 0.5955 0.8556 0.7459 0.9083 0.9338 0.9639 21-40 0.5654 0.9143 0.6421 0.5789 0.7098 0.8030 41-60 0.4060 0.5008 0.5053 0.6451 0.8992 0.8647 61-80 0.3233 0.6902 0.5038 0.3474 0.7910 0.8286 81-100 0.9338 0.9173 0.9609 0.9850 0.9564 0.9444 101-107 0.6786 0.7143 0.6071 0.7857 0.2143 0.1786
Table 10. Spearman’s Rank Order Correlation at Rank Intervals, Using AuthorRank Weights (aurank>1)
(df=18, =0.05, CV=0.447), (df=5, =0.05, CV=0.786) Rank p (p-h) p (p-g) p (c-h) p (c-g) 1-20 0.4211 0.4391 0.7173 0.9248 21-40 0.2195 0.2105 0.1293 0.3940 41-60 0.0947 0.0105 0.2286 0.2737 61-80 0.1880 0.2376 -0.0872 0.1774 81-100 0.1910 0.3008 -0.0015 0.1398 101-120 0.1820 0.2436 -0.1398 0.1308 121-140 -0.0707 0.1504 0.1353 0.1353 141-159 0.1414 0.2343 0.6367 0.6367
39
http://www.jistap.org4. CONCLUSION
We investigated how bibliometric indicators such as publication count and citation count affect the assessment of research performance by computing various bibliometric scores of the works of 159 Korean LIS faculty members and comparing the rankings by those scores. The study results showed correlation between publication count and citation count for authors with many publications but the opposite evidence for authors with few publica-tions. This suggests that as authors publish more and more work, citations to their work tend to increase along with publication count. However, for junior faculty members who have not yet accumu-lated enough publications, citations to their work are of great importance in assessing their research performance.
The study data also showed that there are marked difference in the magnitude of citations between papers published in Korean journals and papers published in international journals. To say that this difference, which is over an order of magnitude in most cited papers, is due to the population size dif-ference between Korean scholars and scholars in the world at large overlooks some important aspects of research impact. Specifically, we must keep in mind that the open access to a wide audience pool that most international journals enjoy increases the potential of research impact. In addition, research of significance should theoretically incur more cita-tions than those exhibited in the study data regard-less of its venue. Evidence to the contrary may be a
reflection of citation behavior specific to Korean LIS researchers. Whether low citation counts to Korean journals reflect the impact of those journals or their environment, such as the size and characteristics of the user groups, remains to be seen. It may very well be that some of the papers published in Korean journals are of little interest to non-Korean scholars, in which case citation counts should be normalized accordingly. Papers with less than two citations, however, suggest low impact regardless of the size of the citation pool.
We also found that citation counts should be weighted according to authorRank for non-primary authors in multi-author papers. Though not conclu-sive, an author weighting formula that assigns decreasing weights to authorRank and sums to 1 may be the most robust approach to handling the authorRank effect. Another study finding is that h-index and g-h-index measure markedly different aspects of research performance than publication count and citation count. Although this finding is no surprise since it is in accordance with the origi-nal intention of h-index and g-index, much weaker strength of association between publication/cita-tion counts and h-/g-index than publicapublication/cita-tion count and citation count indicate that integrating the con-sideration of quality and quality in research assess-ment produces quite a different outcome than com-paring quality and quantity of research separately.
The study demonstrated that bibliometric approach to research assessment can produce different evalu-ation outcomes depending on how the data is ana-lyzed. Such findings, even without the issue of data Table 12. Spearman’s Rank Order Correlation at Rank Intervals (Overall)
p (p-c) p (p-h) p (p-g) p (c-h) p (c-g) p (h-g) 0.7169 0.5608 0.5609 0.8522 0.9137 0.9171 p (p-c2) p (p-h2) p (p-g2) p (c2-h2) p (c2-g2) p (h2-g2) 0.5445 0.5445 0.4726 0.8315 0.8315 0.8496 p (p-c3) p (p-h3) p (p-g3) p (c3-h3) p (c3-g3) p (h3-g3) 0.7096 0.5346 0.4870 0.8256 0.8416 0.8695 p (p-c4) p (p-h4) p (p-g4) p (c4-h4) p (c4-g4) p (h4-g4) 0.6963 0.5266 0.4511 0.8267 0.8265 0.8602
problems, should serve as a reminder that biblio-metric methods have limitations and we should take care in interpreting their results. Research per-formance, let alone research potential, has many facets that quantitative methods cannot fully cap-ture. Even the aspects of research performance that are quantifiable are not necessarily measured by the conventional bibliometric measures in a robust and consistent manner. We must therefore continue the investigation into research assessment approaches that can incorporate a wider spectrum of research performance in an efficient and effective manner. One of the key steps in future research must be to compare various measures across boundaries for the purpose of normalization. Evaluation of research performance using document-level versus journal level measures (e.g., citation count vs. jour-nal impact factor) and ajour-nalysis of impact factor dif-ferences across disciplines and countries would be good places to begin exploring ways to normalize these measures that in some cases are like apples and oranges.
REFERENCES
Bergstrom, C. T. (2007). Eigenfactor: Measuring the value and prestige of scholarly journals. College & Research Libraries News,68(5), 314-316.
Chung, J. S. (2009). A study on assessment of faculty performance in research achievement: A focus on library and information science field. Journal of the Korean BIBLIA Society for Library and Information Science, 20(2), 129-142.
Cronin, B. (1984). The citation process: The role and significance of citations in scientific communica-tion. London: Taylor Graham.
Egghe, L. (2006). Theory and practice of the g-index. Scientometrics, 69(1), 131-152.
Funkhouser, E. T. (1996). The evaluative use of cita-tion analysis for communicacita-tions journals. Human Communication Research, 22(4), 563-574. Garfield, E. (1979). Citation indexing: Its Theory and
Application in Science. New York, NY: Wiley. Hirsch, J. E. (2005). An index to quantify an
individ-ual’s scientific research output. Proceedings of the National Academy of Sciences of the United
States of America, 12(46): 16569-16572.
Holmes, A., & Oppenheim, C. (2001). Use of citation analysis to predict the outcome of the 2001 Rese-arch Assessment Exercise for Unit of Assessment (UoA) 61: Library and information management. Information Research, 6(2). Retrieved from http: //informationr.net/ir/6-2/paper103.html Li, J., Sanderson, M., Willett, P., Norris, M., & Oppen
heim. C. (2010). Ranking of library and informa-tion science researchers: Comparison of data sources for correlating citation data, and expert judgments. Journal of Informetrics, 4, 554-556. MacRoberts, M. H., & MacRoberts, B. R. (1996).
Pro-blems of citation analysis. Scientometrics, 36(3), 435-444.
Meho, L., & Yang, K. (2007). Impact of data sources on citation counts and rankings of LIS faculty: Web of Science vs. Scopus and Google Scholar. Journal of the American Society for Information Science and Technology, 58(13), 2105-2125. Oppenheim, C. (1995). The correlation between
cita-tion counts and the 1992 Research Assessment Exercise Ratings for British library and informa-tion science university departments. Journal of Docu- mentation, 51(1), 18-27.
Page, L., Brin, S., Motwani, R., & Winograd, T. (1998). The PageRank citation ranking: Bringing order to the Web. Retrieved from http://dbpubs.stanford. edu/pub/showDoc. Fulltext?lang = en & doc = 1999 - 66 & format = pdf.
Schloegl, C., & Stock, W. G. (2004). Impact and rele-vance of LIS journals: A scientometric analysis of international and German-language LIS journals-Citation analysis versus reader survey. Journal of the American Society for Information Science and Technology, 55(13), 1155-1168.
Seglen, P. O. (1998). Citation rates and journal impact factors are not suitable for evaluation of research. Acta Orthopaedica Scandinavica, 69(3), 224-229. Sekercioglu, C. H. (2008). Quantifying coauthor
con-tributions. Science, 322(5900), 371-375.
Smith, L. C. (1981). Citation analysis. Library Trends, 30(1), 83-101.
Yang, K., & Lee, J. (2012). Analysis of publication pat-terns in Korean library and information science research. Scientometrics, 93(2), 233-251.
Com-41
http://www.jistap.org parison and analysis of data coverage for citationindex. Eighth International Conference on Webometrics, Informetrics and Scientometrics (WIS) & Thirteenth COLLNET Meeting. Seoul: COLLNET.
Yang, K., & Meho, L. (2011). Multi-faceted citation analysis for quality assessment of scholarly pub-lications. Journal of the Korean Society for Infor-mation Management, 28(2), 79-96.
Zhang, C. T. (2009). A proposal for calculating weighted citations based on author rank. Embo Reports, 10(5), 416-417.