2009, Vol. 53, No. 6
Printed in the Republic of Korea
요약. 여러 CO2-O2 혼합기체에서 인도산 분말숯의 연소반응실험을 수행하였다. 샘플을 분쇄하여 58 마이크론보다 작은 채로 거르고 질소분위기에서 숯으로 만들었다. CPRI 방갈로에 있는 열분석기 (TGA-50)을 사용해 실험을 하였다. CO2-O2 혼합기체는 몰비로 (80-20, 60-40, 40-60, 20-80)을 사용하였 다. 활성화에너지 (E) 및 지수앞자리인자 (A)을 통합접근 및 수정된 Arrhenius식을 사용해 계산하였다.
주제어: 연소반응, 인도산 분말숯, CO2-O2 혼합기체
ABSTRACT. Experimental work was carried out to study the combustion kinetics of the Indian coal-char in the varying mixture of carbon dioxide-oxygen (CO2-O2). The coal sample was pulverized and sieved to less than 58 microns and charred using volatile furnace by passing the nitrogen gas. The experiments were carried out using the Thermo Gravimetric Analyzer (TGA-50) at CPRI, Bangalore, different proportions of (CO2-O2) gas was allowed in to the TGA-50 (80-20, 60-40, 40-60, 20-80) mole basis were used to study the combustion kinetics of coal Isothermally, kinetic parameters like Activation energy (E) and the pre-exponential factors (A) are calculated using the unification approach and modified Arrhenius equation.
Keywords: Combustion kinetics, Pulverized Indian coal-char, CO2-O2 mixture
여러 CO2-O
2 혼합기체에서 인도산 분말숯의 등온 연소반응
V. Saravanan†, R. Shivakumar*, P. Niruguna babu, and Ramakrishna† Siddaganga Institute of Technology, Tumkur, India
†Central Power Research Institute, Bangalore, India (접수 2009. 8. 3; 수정 2009. 8. 28; 게재확정 2009. 10. 26)
Combustion Kinetics of Pulverized Indian Coal-Char in Different CO
2-O
2Mixture Isothermally
V. Saravanan†, R. Shivakumar*, P. Niruguna babu, and Ramakrishna† Siddaganga Institute of Technology, Tumkur, India
†Central Power Research Institute, Bangalore, India
(Received August 3, 2009; Revised August 28, 2009; Accepted October 26, 2009)
INTRODUCTION
Many researchers in the past have studied the combustion kinetics of the coal-chars either by iso- thermal or non-isothermal analysis,1-7 the reaction kinetics of coal-chars concerns correlation with char morphology, pore structure (porosity), surface area.
Surface area and porosity of the prepared coal-char was determined using BET nitrogen gas adsorption.
To estimate the combustion kinetics of coal-char, we need to consider the reactions occurring on
surfaces (external and internal) of solid particles.
There are different types of models farmed to study the kinetics of coal-chars, one such model is shrinking unreacted core model (SCM).1,3,5 In this model chemical reaction occurring at the pore sur- face is the rate controlling step at low temperatures, here reaction starts on the outer surfaces and later ash layer is formed and then the reaction processed inside core of the particle leaving behind the ash or unreacted minerals, hence at any time during the reaction their exit a unreacted core which shrinks
Table 1. Proximate and Ultimate analysis of coal and char samples
Samples
Proximate Analysis
(dry basis), % Ultimate analysis (dry basis), % Particle size D (V, 0.9) (microns) Volatile
Matter Ash Fixed
Carbon Carbon Hydrogen Nitrogen Sulphur Oxygen
Coal-A 25.6 40.6 33.8 42.2 3.4 1.3 0.31 12.19 33.2
Char-A 1.7 62 36.3 37.2 0.22 0.1 0.28 0.20 26.0
Table 2. BET surface area analysis of char samples
Samples Porosity, % External surface area, m2/m3 Total pore length, m/m3 Structural parameter (Ψ)
Char-A 43.3 8.0 11.6 1.30
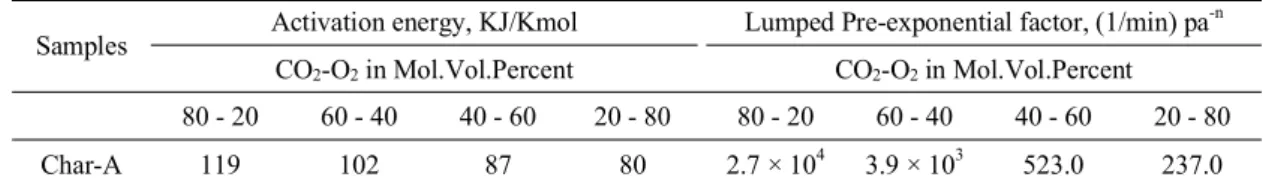
Table 3. Activation energy and lumped Pre exponential factor for different gas environment
Samples Activation energy, KJ/Kmol Lumped Pre-exponential factor, (1/min) pa-n CO2-O2 in Mol.Vol.Percent CO2-O2 in Mol.Vol.Percent 80 - 20 60 - 40 40 - 60 20 - 80 80 - 20 60 - 40 40 - 60 20 - 80
Char-A 119 102 87 80 2.7 × 10⁴ 3.9 × 10³ 523.0 237.0
in size during the reaction hence the model named as shrinking unreacted core model.1,3
The aim of this paper is to estimate the overall reaction rate, which is the product of conversion factor (f (X)) and intrinsic reaction rate (rs). The activation energy (E) and pre-exponential factor (A) are determined by a unification approach using Ran- dom Pore Model (RPM), for experiments conduct- ed isothermally using Thermogravimetric analyzer (TGA) for different CO2-O2 proportion mixtures viz (80-20, 60-40, 40-60, 20-80), were the oxygen concentration was maintained constant for all the cases.
EXPERIMENTAL PROCEDURE Char preparation and Coal properties
Pulverized coal sample was heated in volatile furnace Leco (U.S.A), in flowing nitrogen gas en- vironment at 950 oC at a rate of 20 liters/min and socked for 60 min, after 60 min the furnace was cooled to room temperature in flowing nitrogen gas environment and later the resulted coal-char was homogenized and stored for combustion studies in TGA. The char and coal samples, were analyzed for proximate, ultimate, particle size shown in Table 1
and BET nitrogen surface area, are shown in Table 2.
Experimental work
Thermogravimetric analyzer (TGA) used here was TGA-50 model. Different proportions of (CO2-O2) gas mixtures were fed to TGA at room temperatures and pressure more than atmospheric pressure (1.1 - 1.2 atm). The pre-mixed and calibrated (CO2-O2) mixture cylinders were used for analysis. The oxy- gen concentration for all the case was maintained constant by mainly fixing the flow rate of the oxygen same for the cases i.e. (10.5 mL/min). Isothermal experiments were carried out with prepared coal- char (15 - 18 mg) in the presence of the (CO2-O2) mixtures with constant heating rate 20 oC/min for different temperatures 500, 525, 550, 575 and 600 oC respectively. Flow rate of the gas mixtures were varied by keeping oxygen flow rate constant at 10.5 mL/min.
ISOTHERMAL METHOD FOR EVALUATION OF MODEL AND
ARRHENIUS PARAMETERS A description of isothermal method used for our calculation, was earlier used by1,9,10,11 with applica-
여러 CO2 2
tion to char combustion with mixture of (N2-CO2) or pure CO2 using Random pore model (RPM). The overall reaction rate or rate of the reaction incorpo- rating the conversion factor f (X) is given by
(
T,P2)
f(X)dt r dX
O
= s (1)
Were, rs is the intrinsic reaction rate (m/min).
From RPM, conversion in terms of dimension less time is given by9,10
+
−
−
= 4
1 . exp
1 τ τψ
X (2)
on differentiating equation (2), we get
(
X) (
X)
d
dX = 1− 1−ψln1−
τ (3)
After integrating equation (3), the time constant
[
1 ln(1 ) 1]
2 − − −
= ψ X
τ ψ (4)
Time factor, = t τ
0 0
1−ε
= rS
tf s (5)
Were, rs =KPO2n (6)
But according to Arrhenius equation the reaction rate constant ‘K’ is given by
) / exp( E RT A
K= − (7)
Substituting equation (7) in to equation (6)
n O
s A E RT P
r = exp(− / ) 2 (8)
Substituting equation (8) in to equation (5) )
/ 1 0 2 exp(
0 P E RT
tf AS O n −
= − ε
In the above equation {(AS0)/(1-ε0)} = K0. Were K0 is the lumped pre exponential factor.
There fore, tf =K0PO2nexp(−E/RT) (9)
Taking logarithm of equation (9)
(
E RT)
P n K
tf ln ln o /
ln = 0+ 2− (10)
Partial pressure of oxygen (PO2) is constant for a particular temperature. The order of the reaction can be obtained by plotting ln tf vs. ln PO2. Further, plotting ln tf vs. 1/T, the E and K0 will be obtained from the slope and intercept respectively.
Replace dτ with dt in equation (2) ) ( ) /
2exp(
!P E RT f X
dt K
dX n
o
o −
= (11)
Where: f(X)=
(
1−X)
1−ψln(
1−X)
for RPM model.RESULTS AND DISCUSSION Property of coal char
Char prepared from volatile furnace was sub- jected to proximate (TGA-600, Leco), ultimate (CHNS-2000, Leco), particle size (Malvern particle size analyser) and BET nitrogen adsorption analysis (Micrometrics GEMINI 2360). The results are given in Table 1.
The particle size of parental coal and its res- pective char was analysed using the Master sizer X (Malvern make), which works on the principle of laser ensemble light scattering technique.
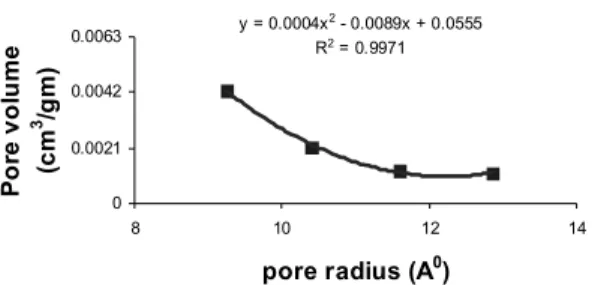
A pore size distribution data were obtained from BET analysis using BJH approach this measurement was uniform and repeatable results were obtained, using this data we plotted a graph of pore radius against the pore volume is shown to get 2nd order polynomial equation of pore volume in terms of pore radius which up on the integration will give the porosity εo, External surface area per unit volume So and pore length per unit volume Lo using the following relation given by Bhatia.9,10
BJH Adsorption pore distrubution
y = 0.0004x2 - 0.0089x + 0.0555 R2 = 0.9971
0 0.0021 0.0042 0.0063
8 10 12 14
pore radius (A0) Pore volume (cm3 /gm)
Fig. 1. BJH adsorption pore distribution curve for char-A.
-0.03 -0.025 -0.02 -0.015 -0.01 -0.005 0
0 500 1000
Time in sec
dW/dt
80-20 60-40 40-60 20-80
Fig. 2. Rate of weight loss with time for char-A at 600 oC.
∞∫
=
0 0 V( drr)
ε (12)
∞∫
=
0 0
)
2 ( dr
r r
S V (13)
∫∞
=
0 2
0
) ( dr r
r
L π V (14)
Conformation of model and determination of reactivity constants (isothermally)
The experiment was carried out with the char prepared in volatile furnace from the data obtained conversion on (ash dry free basis) as the ash is the minerals left out and will not take part in the combu- stion was calculated. Conversion X is calculated by
− ∞
= − W W
W
X W 0 (15)
The equation (11) was used for validating the shrinking core unreacted model (SCM) and the Ran- dom pore model (RPM), from BET results we can observe that the porosity values of the char sample was very high around 45%. Hence the SCM is not suitable model to calculate kinetics of the char because the SCM model does not take in to the account of the structural properties of the char, the reactivity of the char is confined to availability of the surface area. i.e. initially the pore surface area will grow therefore the rate of reaction will in- crease but latter due to the overlapping of growing surfaces will decrease the rate of reactions, this concept is very well explained in the RPM, there- fore the RPM is used to calculate the kinetic para-
meters. The complete conversion was not able to be at temperatures 500 and 525 oC, hence the Arrhenius plot was plotted for 50% conversion.We have got different activation energy (E), lumped pre-expo- nential factor (K0) and pre exponential factor (A) for different (CO2-O2) mixtures which are in range with earlier works.
CONCLUSION
The combustion profiles of the char in CO2-O2
mixtures for temperatures 600, 575 and 550 oC showed the influence of CO2 concentrationover the reactivity. The overall reactivity increases when the concentration of CO2 decreases in the CO2-O2
mixture for the constant O2 concentration which indicates that the CO2 have some cooling effect on the reactivity of char, because of which the differen- tial weight loss with respect to time is slowed as concentration of CO2 is increased even after main- taining same amount of O2 concentration as shown in weight loss patterns at different temperatures in Fig. 2, 3 and 4.
Here we have used a different approach to de- termine the Arrhenius parameters like activation energy (E) and lumped Pre exponential factor (K0) experimentally which are very important inputs for numerical analysis of burning profiles of coal-chars in different (CO2-O2) gas-environments using Com- putational Fluid Dynamics (CFD). The E and K0
values were determined using the modified Arr- henius equation (10), were the partial pressure of the O2 is constant through out the experiment for particular temperature, therefore lnPO2 term in the
여러 CO2 2
-0.03 -0.025 -0.02 -0.015 -0.01 -0.005 0
0 500 1000 1500
Time in sec
dW/dt 80-2060-40
40-60 20-80
Fig. 3. Rate of weight loss with time for char-A at 575 oC.
-0.025 -0.02 -0.015 -0.01 -0.005 0
0 500 1000 1500 2000 2500 3000
Time in sec
dW/dt 80-2060-40
40-60 20-80
Fig. 4. Rate of weight loss with time for char-A at 550 oC.
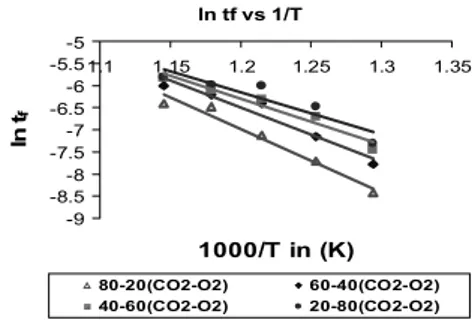
ln tf vs 1/T
-9 -8.5 -8 -7.5 -7 -6.5 -6 -5.5 -5
1.1 1.15 1.2 1.25 1.3 1.35
1000/T in (K) ln tf
80-20(CO2-O2) 60-40(CO2-O2) 40-60(CO2-O2) 20-80(CO2-O2)
Fig. 5. Determination of activation energies and lumped pre-exponential factors for char-A for 50% conversion.
Nomenclature E Activation energy, kJ/ mole
f(X) Conversion factor
A Pre exponential factor, (m/min) (Pa)-n. K Reactivity or reaction rate constant,
(m/min) (Pa)-n
K0 Lumped pre-exponential factor, (1/min) (Pa)-n.
n Order of reaction.
Lo Total pore length per unit volume, m/m3. PO2 Partial pressure of reacting gas, kPa.
R Universal gas constant, 8.213 kJ/mol K.
rs Intrinsicreaction rate, m/min r Pore radius in A0
So External pore surface area, m2/m3.
tf Time factor, 1/min.
V Pore volume adsorbed in m3/g W Weight of char in mg at time t sec W0 Initial weight of char in mg W∞ Weight of non-combustible matter
after complete combustion in mg.
X Fractional conversion of carbon
t Time, sec
T Temperature, K
To Initial Temperature, K εo Initial porosity ρ Density of solid, g/m3 ψ Structural parameter.
τ Dimension less time in case RPM
equation (10) will be constant for a particular tem- perature, if we plot the graph of lntf versus 1/T the negative slope of the line give the Activation energy (E) in terms of KJ/mole and intercept will give the lumped pre-exponential factor (K0) in terms of (1/min) pa-n. The E and K0 values decreases as the concentration of CO2 decreases which means as the peaking temperature comes down the activation energy required for the reaction to initiate decreases.
The values experimentally determined are in range with the previous experimental results of other re- searchers.
REFERENCES
1. Everson, R. C.; Neomagus, H. W. J. P.; Kaitano, R.;
Falcon. R.; Du Cann, V. M. Fuel article; in press: JFUE 3921.
2. Orfao, J. J. M.; Martins, V. Therm. chim. act 2002, 390, 195-211.
3. Everson, R. C.; Neomagus, H. W. J. P.; Njapha, D.
Fuel 2006, 85, 418-422.
4. Madhusudanan, P. M.; Krishnan, K.; Ninan, K. N.
Therm. chim. act 1986, 97, 189-201.
5. Everson, R. C.; Neomagus, H. W. J. P.; Njapha, D.;
Kasaini, H. Fuel 2006, 85, 1067-1075.
6. Madhusudanan, P. M.; Krishnan, K.; Ninan, K. N.
Therm. chim. act 1993, 221, 13-21.
7. Vyazovkin, S. Therm. chim. act 2000, 355, 155-163.
8. Bhatia, S. K.; Perlmutter, D. D. AIChE Journal 1980, 26(3), 379-386.
9. Bhatia, S. K.; Perlmutter, D. D. AIChE Journal 1981, 27(2), 247-254.
10. Chodankar, C. R.; Feng, B.; Klimenko, A. Proceed.
Austr. Comb. Sym 2007, 82-85.