D I A B E T E S & M E T A B O L I S M J O U R N A L
This is an Open Access article distributed under the terms of the Creative Commons Attribution Non-Commercial License (http://creativecommons.org/licenses/by-nc/4.0/) which permits unrestricted non-commercial use, distribution, and reproduction in any medium, provided the original work is properly cited.
Effects of Body Weight Reduction on Serum Irisin and Metabolic Parameters in Obese Subjects
Yaeko Fukushima1, Satoshi Kurose1,2, Hiromi Shinno1, Ha Cao Thi Thu1, Nana Takao1, Hiromi Tsutsumi1, Takaaki Hasegawa3, Toshiaki Nakajima3, Yutaka Kimura1,4
1Department of Health Science, Kansai Medical University Graduate School of Medicine, Hirakata,
2Disease Prevention Center, Ijinkai Takeda General Hospital, Kyoto,
3Department of Cardiovascular Medicine, Dokkyo Medical University, Tochigi,
4Health Science Center, Kansai Medical University, Hirakata, Japan
Background: Irisin is a myokine implicated in lipid and glucose metabolism. The objective of this study is to examine the effect of a body weight reduction on the serum irisin level and physical indicators in obese Japanese patients without diabetes.
Methods: The subjects were 22 patients (male/female, 5/17; age, 46.1±16.0 years; body mass index [BMI], 36.9±5.0 kg/m²) who completed a 6-month body weight reduction program at our clinic. The program included diet, exercise therapy and cognitive behavioral therapy. Blood parameters, body composition, exercise tolerance, homeostasis model assessment of insulin resistance (HOMA-IR), and serum irisin were determined before and after intervention, and relationships among changes in these data were examined.
Results: There were significant decreases in body weight and BMI after the intervention. Irisin before the intervention was signifi- cantly positively correlated with HOMA-IR (r=0.434, P<0.05). The mean irisin level showed no significant change after the inter- vention in all participants. However, improvements in % body fat, subcutaneous fat area, triglycerides, and fasting glucose were significantly greater in patients with an increase in irisin compared to those with a decrease in irisin after the intervention. Pa- tients with an increase in irisin also had significantly lower fasting insulin (9.7±4.8 vs. 16.4±8.2, P<0.05) and HOMA-IR (2.2±1.1 vs. 3.7±1.6, P<0.05) after the intervention, compared to patients with a decrease in irisin.
Conclusion: Body weight reduction did not alter irisin levels. However, irisin may play important roles in fat and glucose metab- olism and insulin resistance, and the effects of body weight reduction on irisin kinetics may be a key for obesity treatment.
Keywords: Body composition; Insulin resistance; Irisin; Lean muscle mass; Obesity
Corresponding author: Yaeko Fukushima http://orcid.org/0000-0001-9677-8762 Department of Health Science, Kansai Medical University Graduate School of Medicine, 2-3-1, Shinmachi, Hirakata 573-1191, Japan
E-mail: [email protected]
INTRODUCTION
Skeletal muscle produces bioactive substances referred to as myokines, as well as serving as the locomotor apparatus [1].
Myokines act on skeletal muscle and perimuscular tissue in an autocrine or paracrine manner and on distal organs in an en- docrine manner. Therefore, skeletal muscle is implicated in both musculoskeletal and glycolipid metabolism, and loss of skeletal muscle mass is responsible for insulin resistance [2,3].
Irisin is a skeletal muscle myokine that alters the color of white adipocytes to brown and enhances fat combustion, which suggests that irisin may be useful for obesity therapy [4- 6]. The first study of the anti-obesity effect of irisin in mice was performed by Bostrom et al. [4] in 2012. Irisin is secreted in skeletal muscle in mice and humans in response to exercise stimulus, and this has led to many studies of the effects of exer- cise on irisin. However, the results of these studies are unclear, with exercise intervention performed by Kerstholt et al. [7] in http://dx.doi.org/10.4093/dmj.2016.40.5.386
pISSN 2233-6079 · eISSN 2233-6087
740 healthy adults and by Hecksteden et al. [8] in a random- ized comparative trial showing no consistent increase in irisin.
There are also no consistent results in obese patients and it is unclear if body weight reduction has an effect on irisin in obese patients.
Our previous study showed that the serum level of irisin was positively correlated with homeostasis model assessment of in- sulin resistance (HOMA-IR) in Japanese patients with obesity in both sexes. We suggested that compensatory enhancement of irisin secretion may occur in response to insulin resistance [9-13]. In seeking a treatment for obesity, improving the HOMA-IR score for assessment of insulin resistance may be helpful as the first priority for patients with obesity, but with- out severe disease such as diabetes, kidney or heart failure and cancer or medication that influences insulin resistance. This approach requires detailed information on irisin metabolism and the relationship between irisin and metabolic parameters (visceral and subcutaneous fat, blood chemistry and HOMA- IR), but many effects of irisin remain unclear. Therefore, in this study, we examined the relationship of irisin with HOMA-IR and physical parameters in Japanese obese patients and the ef- fects of body weight reduction through exercise intervention on irisin and its relationships with metabolic parameters.
METHODS
Subjects and study protocol
The subjects were 22 patients with obesity (male/female, 5/17;
age, 46.1±16.0 years; body weight, 93.0±17 kg; body mass in- dex [BMI], 36.9±5.0 kg/m²) who visited our obesity clinic and completed a 6-month body weight reduction program. The subjects were among 66 obese patients (BMI >30 kg/m²) who visited our clinic between 2013 and 2014 and had not been treated previously (male/female, 19/47; age, 45.7±13.4 years;
body weight, 93.8±17.6 kg; BMI, 36.5±4.7 kg/m²). Physical findings (height, body weight), blood parameters in a fasted state, cholesterol, triglycerides (TG), body composition, vis- ceral fat area (VFA) and subcutaneous fat area (SFA) on com- puted tomography, exercise tolerance, and lower extremity muscle strength were evaluated at the first visit and after the intervention. Changes in parameters before and after the inter- vention and relationships among parameters were evaluated.
The exclusion criteria were subjects with diabetes, renal or heart failure, or cancer, or use of medication that affects muscle mass, such as sex hormones and steroids. The study was con-
ducted in accordance with the Code of Ethics of Kansai Medi- cal University. All subjects received an explanation of the pur- pose, contents and risks of the study and gave written in- formed consent for participation in the study (approval no.
H130181, date of approval March 26, 2014).
Body weight control program and monitoring
The weight control program included exercise therapy, month- ly nutritional guidance, and psychological counseling. A symptom-limited cardiopulmonary exercise (CPX) test was performed before the program to determine the anaerobic threshold oxygen uptake (ATVO2) and peak oxygen uptake (peak VO2) in each subject. The exercise program lasted 70 minutes, and included 30 minutes of aerobic exercise such as that on a bicycle or treadmill, and gravity level resistance exer- cise based on stretching [14]. Over a period of 6 months, exer- cise therapy was supervised by a health exercise instructor at least once or twice a month in our health science center. The subjects were asked to perform similar exercise three times a week at home. For exercise at home, a pedometer was given to each subject to measure activity. Individual exercise amounts were determined from the pedometer at every visit to the cen- ter. The health exercise instructor also provided guidance to subjects at each visit. For nutritional guidance, education on eating behavior and dietary instruction was provided. The di- etitian provided advice on eating behavior based on cognitive behavioral medicine. In psychological counseling, a clinical psychotherapist provided guidance, with a focus on self-moni- toring and self-efficacy based on cognitive behavioral therapy [15,16].
Body composition and skeletal muscle mass indexes Body fat mass and fat-free mass were measured using dual-en- ergy X-ray absorptiometry (DXA; DPX-NT System; GE Health- care, Buckinghamshire, UK). After the 6-month intervention, these parameters were determined before other effects were evaluated. Absolute values of fat mass and fat-free mass (whole body, upper extremities, body trunk, and lower extremities) were obtained from DXA. % Skeletal muscle was obtained by adjusting the total lean body mass for weight (total lean body mass/body weight [%]) and the skeletal muscle index (SMI) was obtained by adjusting the lean body mass of the extremi- ties for height² (total lean-body mass of extremities/square height [kg/m²]). These are appropriate indexes for lean mass volume in subjects with obesity [17].
Measurement of lower limb muscle strength
The lower limb muscle strength was measured twice based on the uniform rotation leg strength using a recumbent ergometer (Strength Ergo; Mitsubishi Electric Corp., Tokyo, Japan). The maximum was recorded and values were corrected for body weight (Nm/kg).
Cardiopulmonary exercise test
A symptom-limited CPX test was performed using a bicycle ergometer (232C-XL; Combi Co. Ltd., Tokyo, Japan). For anal- ysis of expired gas, measurements were performed with the breath-by-breath method using an AE-300 System (Minato Medical Science Co. Ltd., Osaka, Japan). The anaerobic thresh- old (AT) was determined using the V-slope method. Peak VO2
was defined as the highest level under load. AT and VO2 were recorded [18].
Hematological parameters and serum irisin levels
Blood was collected after fasting and peripheral and biochemi- cal blood parameters and myokines were measured. Blood samples for irisin measurement were collected, promptly cen- trifuged at 4°C and 3,000 rpm for 10 minutes, and placed in a container for serum storage at –80°C until performance of an enzyme-linked immunosorbent assay. Serum irisin was deter- mined using an irisin enzyme immunoassay kit (EK-067-29;
Phoenix Pharmaceuticals, Burlingame, CA, USA). Optical density at 450 nm was measured using a microplate reader (Powerscan HT; DS Pharma Biomedical Co. Ltd., Osaka, Ja- pan). HOMA-IR was used as an index of insulin resistance and was obtained from the fasting blood insulin (immunoreactive insulin [IRI]) concentration and the fasting blood sugar (FBS) level early in the morning, based on the equation: HOMA- IR=(IRI×FBS)/405 [19]. Glucose analysis was performed with an automatic analyzer (Adams Glucose GA-1170; Arkray Inc., Kyoto, Japan). An automatic glycohemoglobin analyzer (HLC- 723G7; Tosoh Bioscience Corp., Tokyo, Japan) was used for measurement of glycosylated hemoglobin.
Statistical analysis
Data are expressed as mean±standard deviation or number (%). Values before and after the 6-month intervention in all participants were compared by paired t-test. Differences be- tween participants with increases and decreases in irisin after the intervention were compared by unpaired t-test. Spearman rank-correlation coefficients were used to examine relation-
ships between changes in values. For factors showing correla- tion, partial correlation coefficients were calculated using gen- der as a control variable. All calculations were performed using SPSS version 21 (IBM Corp., Armonk, NY, USA). P<0.05 was considered significant in all analyses.
RESULTS
The background of the 22 subjects is shown in Table 1. Nine- teen had no smoking or alcohol history, only two had taken antihypertensive agents, and none had received an antidiabet- ic, insulin injection, lipid-regulating agent or any medication that affects muscle mass. No subjects had diabetes, renal or heart failure, cancer or any other severe disease (Table 1).
After the 6-month body weight reduction program, there were significant decreases in body weight (93.0±17.3 to 87.1±
16.2 kg), BMI (36.9±5.0 to 34.5±4.5 kg/m²), VFA (168.8±58.3 to 142.5±40.2 cm²), SFA (465.8±125.0 to 418.0±111.4 cm²), and fasting glucose (96.8±10.5 to 92.8±7.9 mg/dL); and significant increases in % skeletal muscle (49.5%±5.1% to 52.8%±5.8%), leg strength (1.3±0.4 to 1.4±0.3 kg/kg), exercise tolerance (ATVO2, 11.1±1.8 to 12.2±1.9 mL/kg/min; peak VO2, 18.7±4.3 to 19.6±
4.1 mL/kg/min), and high density lipoprotein (HDL; 42.1±9.4 to 49.7±8.8 mg/dL; all P<0.01) (Table 2). There were also non- Table 1. Baseline demographic and lifestyle data for partici- pants
Item Value
Sex, male/female 17/5
Age, yr 46.1±16.0
Body weight, kg 93.0±17.3
Body mass index, kg/m2 36.9±5.0
Smoking status
Current 1 (4.5)
Past 2 (9.1)
Never 19 (86.4)
Alcohol
Every day 1 (4.5)
Often 2 (9.1)
None 19 (86.4)
Medication
Hypertensive drug 2 (9.1)
Antidiabetic drug/insulin 0
Values are presented as mean±standard deviation or number (%).
significant decreases in % body fat (46.3%±9.9% to 44.0%±
7.8%), SMI (7.7±1.2 to 7.6±1.2 kg/m2), TG (142.6±50.1 to 135.0±
52.8 mg/dL), fasting insulin (13.8±8.2 to 12.5±7.1 μU/mL), and HOMA-IR (3.3±1.8 to 2.8±1.5); and non-significant in- creases in low density lipoprotein (LDL) cholesterol (106.9± 29.1 to 113.8±25.3 mg/dL) and serum irisin (1.20±0.20 to 1.25±
0.18 ng/mL) (Table 2).
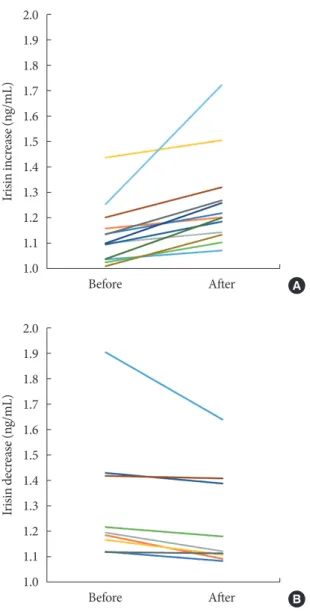
Before body weight reduction, irisin levels were significantly positively correlated with HOMA-IR. Partial correlation coeffi- cients were also calculated using gender as a control variable (r=0.627, P=0.002) (Fig. 1). There was no significant change in irisin from before to after the intervention (1.20±0.2 to 1.25±
0.18 ng/mL) (Fig. 2). However, 13 subjects had an increase in irisin and nine had a decrease in irisin after the intervention (Table 3). In the patients with increased irisin, body weight
(92.5±15.3 to 86.0±13.1 kg), BMI (36.8±5.0 to 34.0±3.7 kg/m²),
% body fat (48.2%±10.4% to 43.2%±7.8%), VFA (169.6±66.1 to 147.2±45.5 cm²), SFA (477.2±138.4 to 425.8±129.1 cm²), TG (152.1±53.6 to 122.7±42.8 mg/dL), and fasting glucose (97.3±10.5 to 92.4±8.3 mg/dL) significantly decreased; and % skeletal muscle (49.5%±5.4% to 53.4%±6.7%), HDL (39.0±7.3 to 49.0±8.3 mg/dL), LDL (98.8±28.1 to 109.2±26.5 mg/dL), and serum irisin (1.1±0.1 to 1.3±0.2 ng/mL) significantly in- creased (all P<0.05). In contrast, in the patients with decreased irisin, only body weight (93.6±20.9 to 88.8±20.6 kg), BMI (37.0±5.2 to 35.2±5.7 kg/m²), and serum irisin (1.3±0.3 to 1.2±0.2 ng/mL) significantly decreased (P<0.05), while % body fat (43.7%±9.0% to 45.1%±8.0%), SFA (449.3±108.3 to 406.7±85.6 cm²), TG (128.9±43.8 to 152.7±63.1 mg/dL), and fasting glucose (96.1±11.1 to 93.3±7.6 mg/dL) did not change Table 2. Changes of parameters from baseline to after a 6-month weight reduction intervention in all participants
Variable Pre-intervention After intervention P value
Body weight, kg 93.0±17.3 87.1±16.2 <0.01
Body mass index, kg/m2 36.9±5.0 34.5±4.5 <0.01
% Body fat, %a 46.3±9.9 44.0±7.8 0.14
% Skeletal muscle, %b 49.5±5.1 52.8±5.8 <0.01
Skeletal muscle indexc 7.7±1.2 7.6±1.2 0.19
Leg strength, kg/kg 1.3±0.4 1.4±0.3 <0.05
Exercise capacity
ATVO2, mL/min/kg 11.1±1.8 12.2±1.9 <0.01
Peak VO2, mL/min/kg 18.7±4.3 19.6±4.1 <0.01
Metabolic parameter
Visceral fat area, cm² 168.8±58.3 142.5±40.2 <0.01
Subcutaneous fat area, cm² 465.8±125.0 418.0±111.4 <0.01
HDL-C, mg/dL 42.1±9.4 49.7±8.8 <0.01
LDL-C, mg/dL 106.9±29.1 113.8±25.3 0.06
Triglycerides, mg/dL 142.6±50.1 135.0±52.8 0.51
Fasting glucose, mg/dL 96.8±10.5 92.8±7.9 <0.01
Fasting insulin, μU/mL 13.8±8.2 12.5±7.1 0.19
HOMA-IR, ×10-6 mol×IU×L-2 3.3±1.8 2.8±1.5 0.09
HbA1c, % 5.7±0.5 5.7±0.4 1.00
Myokine
Serum irisin, ng/mL 1.20±0.20 1.25±0.18 0.14
Values are presented as mean±standard deviation. P values are calculated by paired t-test.
ATVO2, anaerobic threshold oxygen uptake; Peak VO2, peak oxygen uptake; HDL-C, high density lipoprotein cholesterol; LDL-C, low density lipoprotein cholesterol; HOMA-IR, homeostasis model assessment of insulin resistance; HbA1c, glycosylated hemoglobin.
a% Body fat=total fat mass/weight (%), b% Skeletal muscle index=total lean body mass/weight (%), cSkeletal muscle index=lean body mass of extremities/height² (kg/m²).
significantly.
Data reflecting insulin resistance in subjects with increases and decreases in irisin after the intervention are shown in Table 4. After the intervention, there were some significant differenc- es in metabolic parameters between these groups. Before the in- tervention, fasting insulin (P=0.058) and HOMA-IR (P=
0.069) did not differ between the groups, but after the interven- tion the HOMA-IR was significantly lower in subjects with in- creased irisin compared to those with decreased irisin (P<0.05).
DISCUSSION
The 6-month body weight reduction program did not alter iri- sin levels in all participants, but patients with an irisin increase had significantly improved % body fat, SFA, TG, fasting glu- cose, fasting insulin, and HOMA-IR, compared with those with decreased irisin. These data suggest that increasing serum irisin might be important for improvement of fat and glucose metabolism and improvement of insulin resistance.
Previous studies have shown irisin changes after exercise in- tervention for short to long periods in mice and humans [20].
Irisin secretion in skeletal muscle is linked to exercise-induced expression of FNDC5 mRNA, and Bostrom et al. [4] found in- creased expression of FNDC5 mRNA in skeletal muscle of mice after exercise for 3 weeks and in muscle cells of obese pa-
tients after exercise therapy for 10 weeks. However, a signifi- cant increase in irisin was not found after exercise therapy in non-obese individuals [7,21,22], and no significant changes in irisin occurred in obese patients after 8-week endurance train- ing [23] and 12-week strength and endurance training [24,25].
The effects of body weight reduction on irisin were exam- ined by Crujeiras et al. [10] in an 8-week body weight reduc- tion program in 93 obese patients (BMI, 35.66±4.5 kg/m2), by Huerta et al. [26] in a 10-week body weight reduction program in 79 female obese patients (BMI, 27.5 to 39.9 kg/m2), and by de la Iglesia et al. [27] in a 6-week body weight reduction pro- gram. In all obese patients in these studies, irisin decreased Fig. 1. Relationship between irisin and homeostasis model as-
sessment of insulin resistance (HOMA-IR) before intervention in all subjects. Partial correlation analysis was performed using gender as a control variable.
10 9 8 7 6 5 4 3 2 1 0
HOMA-IR
0.9 1.1 1.3 1.5 1.7 1.9 2.1 Serum irisin (ng/mL)
r=0.627, P=0.002
Fig. 2. Changes of serum irisin before and after the interven- tion in subjects with (A) an increase in irisin and (B) a decrease in irisin.
2.0 1.9 1.8 1.7 1.6 1.5 1.4 1.3 1.2 1.1 1.0
2.0 1.9 1.8 1.7 1.6 1.5 1.4 1.3 1.2 1.1 1.0
Irisin increase (ng/mL)Irisin decrease (ng/mL)
Before
Before
After
After
A
B
with body weight reduction [10,26,27]. Irisin is an anti-obesity hormone that enhances fat combustion and has an anti-obesity effect [4-6]. Therefore, irisin in obese patients has a positive correlation with fat mass [9-11,28-31]. However, subject back- ground and exercise vary among studies, resulting in difficulty in assessment of the effects of body weight reduction.
In this study, the 6-month weight reduction intervention caused no significant change in irisin, with nine subjects show- ing a decrease and 13 an increase in irisin. The mean irisin lev- els before intervention were 1.31 and 1.13 ng/mL in the respec- tive groups. Previous studies in obese patients have shown that irisin decreases with weight reduction [10,22,26] and this may
have occurred in the nine subjects with decreased irisin after the intervention in the current study. Stengel et al. [29] found a positive relationship between BMI and irisin level in a com- parison of obese and non-obese patients, and Moreno et al.
[32] found that irisin was higher in subjects with low activity than in those with average or high activity. In a cross-sectional study, Huth et al. [33] showed that irisin was highest in obese prediabetic patients, followed by obese patients and non-obese individuals, and lowest in athletes. The higher irisin in obese persons is due to compensation for metabolic homeostasis, and this suggests that irisin should be decreased by body weight reduction due to discontinuation of compensatory ac- Table 3. Differences in metabolic parameters before and after a 6-month weight reduction intervention in participants with in- creased or decreased irisin levels
Variable Increase in irisin Decrease in irisin
Before After P value Before After P value
Sex, male/female 13 (4/9) 9 (3/6)
Age, yr 48.2±15.0 43.1±17.8
Body weight, kg 92.5±15.3 86.0±13.1 <0.01 93.6±20.9 88.8±20.6 <0.05
Body mass index, kg/m2 36.8±5.0 34.0±3.7 <0.01 37.0±5.2 35.2±5.7 <0.05
% Body fat, % 48.2±10.4 43.2±7.8 <0.05 43.7±9.0 45.1±8.0 0.45
% Skeletal muscle, % 49.5±5.4 53.4±6.7 <0.01 49.5±4.9 51.9±4.5 <0.01
Skeletal muscle index 7.6±1.3 7.5±1.2 0.15 7.9±1.2 7.8±1.1 0.69
Leg strength, kg/kg 1.3±0.3 1.2±0.2 0.11 1.5±0.4 1.7±0.3 0.20
Exercise capacity
ATVO2, mL/min/kg 11.1±1.7 12.0±1.6 0.14 11.1±2.1 12.5±2.4 0.07
Peak VO2, mL/min/kg 17.2±3.9 18.4±3.0 0.06 20.8±4.2 21.1±5.0 0.31
Metabolic parameter
Visceral fat area, cm² 169.6±66.1 147.2±45.5 <0.05 167.7±48.7 135.7±32.4 <0.05 Subcutaneous fat area, cm² 477.2±138.4 425.8±129.1 <0.01 449.3±108.3 406.7±85.6 0.06
HDL-C, mg/dL 39.0±7.3 49.0±8.3 <0.01 46.6±10.6 50.7±9.9 <0.05
LDL-C, mg/dL 98.8±28.1 109.2±26.5 <0.05 118.6±28.0 120.4±23.5 0.75
Triglycerides, mg/dL 152.1±53.6 122.7±42.8 <0.05 128.9±43.8 152.7±63.1 0.23
Fasting glucose, mg/dL 97.3±10.5 92.4±8.3 <0.01 96.1±11.1 93.3±7.6 0.33
Fasting insulin, μU/mL 11.1±4.0 9.7±4.8 0.20 17.8±11.0 16.4±8.2 0.52
HOMA-IR, ×10-6 mol×IU×L-2 2.7±1.2 2.2±1.1 0.08 4.1±2.2 3.7±1.6 0.48
HbA1c, % 5.7±0.5 5.7±0.4 0.66 5.7±0.4 5.7±0.3 0.43
Myokine
Serum irisin, ng/mL 1.1±0.1 1.3±0.2 <0.01 1.3±0.3 1.2±0.2 <0.05
Values are presented as mean±standard deviation. Differences in metabolic parameters from before to after the intervention in each group were evaluated by paired t-test.
ATVO2, anaerobic threshold oxygen uptake; Peak VO2, peak oxygen uptake; HDL-C, high density lipoprotein cholesterol; LDL-C, low density lipoprotein cholesterol; HOMA-IR, homeostasis model assessment of insulin resistance; HbA1c, glycosylated hemoglobin.
tion. However, irisin in patients with metabolic syndrome or simple obesity, and in prediabetic and type 2 diabetes mellitus patients, is lower than that in healthy individuals [25,34-36].
These results suggest that homeostatic breakdown inhibits the compensatory action of irisin, causing a decrease in irisin.
Based on these results, activity, obesity, abnormal glucose tol- erance, and other diseases need to be considered to differenti- ate irisin kinetics in obese patients. The obese nondiabetic pa- tients in this study had borderline manifestation, and changes in irisin after body weight reduction were unlikely to be con- sistent.
BMI, % skeletal muscle, and HDL showed significant im- provements after the intervention in all subjects in the current study, but % body fat, SFA, TG, and fasting glucose showed significant decreases only in patients with an irisin increase.
First, this result indicates that irisin alters lipid metabolism, and irisin has previously been shown to have beneficial effects on metabolism by inducing browning of white adipocytes and contributing to fat metabolism [5,37,38]. In mouse models, FNDC5 mRNA expression induces browning of adipocytes and thermogenesis by increasing the level of uncoupling pro- tein 1 (UCP1) [4]. Serum irisin is associated with metabolic disorders, including obesity and diabetes [5,11,29,34,35,37,39, 40], and browning of adipose tissue contributes to decreased weight gain [5,38], but our results showed significant body weight reduction in patients with increased and decreased iri- sin. Secretion of irisin is higher from white adipose tissues in diet-induced obese rats compared to lean control rats [41], and some studies in humans have also found a positive correlation of the serum irisin level with fat [4,28,38,42-44]. These results indicate that adipose tissue, especially in obesity, is an impor- tant source of irisin secretion. Second, fasting insulin and the HOMA-IR score after the intervention were significantly lower in patients with increased irisin, which supports the suggestion that irisin has an anti-metabolic effect [4,6]. One possible effect of irisin involves single nucleotide polymorphisms in FNDC5 modulating glucose metabolism and insulin sensitivity [38,40, 45,46], and this is consistent with the low HOMA-IR score in patients with increased irisin in the current study.
Irisin in obese subjects before the intervention had a signifi- cant positive correlation with HOMA-IR. Park et al. [9] and Crujeiras et al. [10] have also shown this positive correlation between irisin and HOMA-IR in obese patients, whereas Al- Daghri et al. [38] found a negative correlation and Moreno- Navarrete et al. [28] confirmed this negative correlation in male obese patients. Obese patients with BMI >30 kg/m² in this study had a positive correlation of irisin with HOMA-IR;
therefore, irisin secretion in response to adiposis and insulin resistance probably enhanced metabolic homeostasis in a com- pensatory manner [11,12]. These factors are also affected by gender, but the number of subjects was too small for an inter- ventional trial and this prevented analysis by gender. In a large- scale cross-sectional study, Kerstholt et al. [47] found no sex difference in irisin, and we previously showed that serum irisin levels were positively correlated with HOMA-IR in 19 men and 47 women with obesity without diabetes and that HOMA- Table 4. Comparison of metabolic parameters in participants
with increased and decreased irisin levels after a 6-month weight reduction intervention
Variable After intervention
P value Increase Decrease
Body weight, kg 86.0±13.1 88.8±20.6 0.70
Body mass index, kg/m2 34.0±3.7 35.2±5.7 0.57
% Body fat, % 43.2±7.8 45.1±8.0 0.58
% Skeletal muscle, % 53.4±6.7 51.9±4.5 0.59 Skeletal muscle index 7.5±1.2 7.8±1.1 0.50 Leg strength, kg/kg 1.2±0.2 1.7±0.3 <0.01 Exercise capacity
ATVO2, mL/min/kg 12.0±1.6 12.5±2.4 0.58 Peak VO2, mL/min/kg 18.4±3.0 21.1±5.0 0.18 Metabolic parameter
Visceral fat area, cm² 147.2±45.5 135.7±32.4 0.52 Subcutaneous fat area, cm² 425.8±129.1 406.7±85.6 0.70
HDL-C, mg/dL 49.0±8.3 50.7±9.9 0.67
LDL-C, mg/dL 109.2±26.5 120.4±23.5 0.32 Triglycerides, mg/dL 122.7±42.8 152.7±63.1 0.20 Fasting glucose, mg/dL 92.4±8.3 93.3±7.6 0.79 Fasting insulin, μU/mL 9.7±4.8 16.4±8.2 <0.05 HOMA-IR, ×10-6 mol×IU×L-2 2.2±1.1 3.7±1.6 <0.05
HbA1c, % 5.7±0.4 5.7±0.3 0.77
Myokine
Serum irisin, ng/mL 1.3±0.2 1.2±0.2 0.84 Values are presented as mean±standard deviation. Differences in metabolic parameters in participants with increased and decreased irisin after the intervention were evaluated by unpaired t-test.
ATVO2, anaerobic threshold oxygen uptake; Peak VO2, peak oxygen uptake; HDL-C, high density lipoprotein cholesterol; LDL-C, low density lipoprotein cholesterol; HOMA-IR, homeostasis model as- sessment of insulin resistance; HbA1c, glycosylated hemoglobin.
IR was independently related to the irisin level in stepwise multiple linear regression analysis [13]. Therefore, the changes in irisin levels in the current study are unlikely to have been re- lated to gender.
This study has several limitations. Irisin kinetics are likely to differ between obese patients with and without diabetes, but only obese patients without diabetes were included in the study.
Also, menopause could influence the results, but we could not check how many subjects were postmenopausal. However, most Japanese women are postmenopausal at an average of about 50 years old, and thus few of the subjects were likely to be postmenopausal. Further studies in more subjects are required to validate the results.
In conclusion, irisin before a body weight reduction inter- vention in obese patients was significantly positively correlated with HOMA-IR. Body weight reduction did not alter irisin levels in all participants. Only subjects with an irisin increase showed significant improvements in % body fat, SFA, TG, and fasting glucose from before to after the intervention. Fasting insulin and HOMA-IR scores were significantly lower in these subjects compared to those with decreased irisin after the in- tervention. These findings suggest that increased irisin has beneficial regulatory effects on fat, glucose, and insulin resis- tance. Therefore, the effects of body weight reduction and ex- ercise intervention on irisin kinetics might be keys in obesity treatment.
CONFLICTS OF INTEREST
No potential conflict of interest relevant to this article was re- ported.
REFERENCES
1. Pedersen BK. Muscle as a secretory organ. Compr Physiol 2013;3:1337-62.
2. Moon SS. Low skeletal muscle mass is associated with insulin resistance, diabetes, and metabolic syndrome in the Korean population: the Korea National Health and Nutrition Examina- tion Survey (KNHANES) 2009-2010. Endocr J 2014;61:61-70.
3. Lee CG, Boyko EJ, Strotmeyer ES, Lewis CE, Cawthon PM, Hoffman AR, Everson-Rose SA, Barrett-Connor E, Orwoll ES;
Osteoporotic Fractures in Men Study Research Group. Associ- ation between insulin resistance and lean mass loss and fat mass gain in older men without diabetes mellitus. J Am Geriatr
Soc 2011;59:1217-24.
4. Bostrom P, Wu J, Jedrychowski MP, Korde A, Ye L, Lo JC, Ras- bach KA, Bostrom EA, Choi JH, Long JZ, Kajimura S, Zinga- retti MC, Vind BF, Tu H, Cinti S, Hojlund K, Gygi SP, Spiegel- man BM. A PGC1-α-dependent myokine that drives brown- fat-like development of white fat and thermogenesis. Nature 2012;481:463-8.
5. Elsen M, Raschke S, Eckel J. Browning of white fat: does irisin play a role in humans? J Endocrinol 2014;222:R25-38.
6. Novelle MG, Contreras C, Romero-Pico A, Lopez M, Dieguez C. Irisin, two years later. Int J Endocrinol 2013;2013:746281.
7. Kerstholt N, Ewert R, Nauck M, Spielhagen T, Bollmann T, Stubbe B, Felix SB, Wallaschofski H, Glaser S, Friedrich N. As- sociation of circulating irisin and cardiopulmonary exercise capacity in healthy volunteers: results of the Study of Health in Pomerania. BMC Pulm Med 2015;15:41.
8. Hecksteden A, Wegmann M, Steffen A, Kraushaar J, Morsch A, Ruppenthal S, Kaestner L, Meyer T. Irisin and exercise training in humans: results from a randomized controlled training trial.
BMC Med 2013;11:235.
9. Park KH, Zaichenko L, Brinkoetter M, Thakkar B, Sahin-Efe A, Joung KE, Tsoukas MA, Geladari EV, Huh JY, Dincer F, Davis CR, Crowell JA, Mantzoros CS. Circulating irisin in relation to insulin resistance and the metabolic syndrome. J Clin Endocri- nol Metab 2013;98:4899-907.
10. Crujeiras AB, Zulet MA, Lopez-Legarrea P, de la Iglesia R, Par- do M, Carreira MC, Martinez JA, Casanueva FF. Association between circulating irisin levels and the promotion of insulin resistance during the weight maintenance period after a dietary weight-lowering program in obese patients. Metabolism 2014;
63:520-31.
11. Sesti G, Andreozzi F, Fiorentino TV, Mannino GC, Sciacqua A, Marini MA, Perticone F. High circulating irisin levels are associ- ated with insulin resistance and vascular atherosclerosis in a co- hort of nondiabetic adult subjects. Acta Diabetol 2014;51:705- 13.
12. Ebert T, Focke D, Petroff D, Wurst U, Richter J, Bachmann A, Lossner U, Kralisch S, Kratzsch J, Beige J, Bast I, Anders M, Bluher M, Stumvoll M, Fasshauer M. Serum levels of the myo- kine irisin in relation to metabolic and renal function. Eur J Endocrinol 2014;170:501-6.
13. Fukushima Y, Kurose S, Shinno H, Cao Thi Thu H, Tamanoi A, Tsutsumi H, Hasegawa T, Nakajima T, Kimura Y. Relationships between serum irisin levels and metabolic parameters in Japa- nese patients with obesity. Obes Sci Pract 2016;2:203-9.
14. Kurose S, Tsutsumi H, Yamanaka Y, Shinno H, Miyauchi T, Ta- manoi A, Imai M, Masuda I, Kimura Y. Improvement in endo- thelial function by lifestyle modification focused on exercise training is associated with insulin resistance in obese patients.
Obes Res Clin Pract 2014;8:e106-14.
15. Saito H, Kimura Y, Tashima S, Takao N, Nakagawa A, Baba T, Sato S. Psychological factors that promote behavior modifica- tion by obese patients. Biopsychosoc Med 2009;3:9.
16. Kimura Y. Dietary instruction and cognitive behavioral thera- py. J Clin Sports Med 2009;26:225-230.
17. Fukushima Y, Kurose S, Shinno H, Cao Thu H, Takao N, Tsut- sumi H, Kimura Y. Importance of lean muscle maintenance to improve insulin resistance by body weight reduction in female patients with obesity. Diabetes Metab J 2016;40:147-53.
18. Beaver WL, Wasserman K, Whipp BJ. A new method for de- tecting anaerobic threshold by gas exchange. J Appl Physiol (1985) 1986;60:2020-7.
19. Matthews DR, Hosker JP, Rudenski AS, Naylor BA, Treacher DF, Turner RC. Homeostasis model assessment: insulin resis- tance and beta-cell function from fasting plasma glucose and insulin concentrations in man. Diabetologia 1985;28:412-9.
20. Aydin S, Aydin S, Kuloglu T, Yilmaz M, Kalayci M, Sahin I, Cicek D. Alterations of irisin concentrations in saliva and se- rum of obese and normal-weight subjects, before and after 45 min of a Turkish bath or running. Peptides 2013;50:13-8.
21. Pekkala S, Wiklund PK, Hulmi JJ, Ahtiainen JP, Horttanainen M, Pollanen E, Makela KA, Kainulainen H, Hakkinen K, Ny- man K, Alen M, Herzig KH, Cheng S. Are skeletal muscle FNDC5 gene expression and irisin release regulated by exercise and related to health? J Physiol 2013;591:5393-400.
22. Huh JY, Panagiotou G, Mougios V, Brinkoetter M, Vamvini MT, Schneider BE, Mantzoros CS. FNDC5 and irisin in hu- mans. I. Predictors of circulating concentrations in serum and plasma and II. mRNA expression and circulating concentra- tions in response to weight loss and exercise. Metabolism 2012;
61:1725-38.
23. Besse-Patin A, Montastier E, Vinel C, Castan-Laurell I, Louche K, Dray C, Daviaud D, Mir L, Marques MA, Thalamas C, Valet P, Langin D, Moro C, Viguerie N. Effect of endurance training on skeletal muscle myokine expression in obese men: identifica- tion of apelin as a novel myokine. Int J Obes (Lond) 2014;38:
707-13.
24. Norheim F, Langleite TM, Hjorth M, Holen T, Kielland A, Stadheim HK, Gulseth HL, Birkeland KI, Jensen J, Drevon CA.
The effects of acute and chronic exercise on PGC-1α, irisin and
browning of subcutaneous adipose tissue in humans. FEBS J 2014;281:739-49.
25. Kurdiova T, Balaz M, Vician M, Maderova D, Vlcek M, Valkov- ic L, Srbecky M, Imrich R, Kyselovicova O, Belan V, Jelok I, Wolfrum C, Klimes I, Krssak M, Zemkova E, Gasperikova D, Ukropec J, Ukropcova B. Effects of obesity, diabetes and exer- cise on Fndc5 gene expression and irisin release in human skel- etal muscle and adipose tissue: in vivo and in vitro studies. J Physiol 2014;592:1091-107.
26. Huerta AE, Prieto-Hontoria PL, Fernandez-Galilea M, Sainz N, Cuervo M, Martinez JA, Moreno-Aliaga MJ. Circulating iri- sin and glucose metabolism in overweight/obese women: ef- fects of α-lipoic acid and eicosapentaenoic acid. J Physiol Bio- chem 2015;71:547-58.
27. de la Iglesia R, Lopez-Legarrea P, Crujeiras AB, Pardo M, Casa- nueva FF, Zulet MA, Martinez JA. Plasma irisin depletion un- der energy restriction is associated with improvements in lipid profile in metabolic syndrome patients. Clin Endocrinol (Oxf) 2014;81:306-11.
28. Moreno-Navarrete JM, Ortega F, Serrano M, Guerra E, Pardo G, Tinahones F, Ricart W, Fernandez-Real JM. Irisin is ex- pressed and produced by human muscle and adipose tissue in association with obesity and insulin resistance. J Clin Endocri- nol Metab 2013;98:E769-78.
29. Stengel A, Hofmann T, Goebel-Stengel M, Elbelt U, Kobelt P, Klapp BF. Circulating levels of irisin in patients with anorexia nervosa and different stages of obesity: correlation with body mass index. Peptides 2013;39:125-30.
30. Pardo M, Crujeiras AB, Amil M, Aguera Z, Jimenez-Murcia S, Banos R, Botella C, de la Torre R, Estivill X, Fagundo AB, Fer- nandez-Real JM, Fernandez-Garcia JC, Fruhbeck G, Gomez- Ambrosi J, Rodriguez R, Tinahones FJ, Fernandez-Aranda F, Casanueva FF. Association of irisin with fat mass, resting ener- gy expenditure, and daily activity in conditions of extreme body mass index. Int J Endocrinol 2014;2014:857270.
31. Peter PR, Park KH, Huh JY, Wedick NM, Mantzoros CS. Cir- culating irisin levels are not affected by coffee intake: a ran- domized controlled trial. PLoS One 2014;9:e94463.
32. Moreno M, Moreno-Navarrete JM, Serrano M, Ortega F, Del- gado E, Sanchez-Ragnarsson C, Valdes S, Botas P, Ricart W, Fernandez-Real JM. Circulating irisin levels are positively as- sociated with metabolic risk factors in sedentary subjects. PLoS One 2015;10:e0124100.
33. Huth C, Dubois MJ, Marette A, Tremblay A, Weisnagel SJ, Lacaille M, Mauriege P, Joanisse DR. Irisin is more strongly
predicted by muscle oxidative potential than adiposity in non- diabetic men. J Physiol Biochem 2015;71:559-68.
34. Choi YK, Kim MK, Bae KH, Seo HA, Jeong JY, Lee WK, Kim JG, Lee IK, Park KG. Serum irisin levels in new-onset type 2 diabetes. Diabetes Res Clin Pract 2013;100:96-101.
35. Polyzos SA, Kountouras J, Anastasilakis AD, Geladari EV, Mantzoros CS. Irisin in patients with nonalcoholic fatty liver disease. Metabolism 2014;63:207-17.
36. Yan B, Shi X, Zhang H, Pan L, Ma Z, Liu S, Liu Y, Li X, Yang S, Li Z. Association of serum irisin with metabolic syndrome in obese Chinese adults. PLoS One 2014;9:e94235.
37. Liu JJ, Wong MD, Toy WC, Tan CS, Liu S, Ng XW, Tavintharan S, Sum CF, Lim SC. Lower circulating irisin is associated with type 2 diabetes mellitus. J Diabetes Complications 2013;27:365- 9.
38. Al-Daghri NM, Alkharfy KM, Rahman S, Amer OE, Vinodson B, Sabico S, Piya MK, Harte AL, McTernan PG, Alokail MS, Chrousos GP. Irisin as a predictor of glucose metabolism in children: sexually dimorphic effects. Eur J Clin Invest 2014;44:
119-24.
39. Gouni-Berthold I, Berthold HK, Huh JY, Berman R, Spenrath N, Krone W, Mantzoros CS. Effects of lipid-lowering drugs on irisin in human subjects in vivo and in human skeletal muscle cells ex vivo. PLoS One 2013;8:e72858.
40. Staiger H, Bohm A, Scheler M, Berti L, Machann J, Schick F, Machicao F, Fritsche A, Stefan N, Weigert C, Krook A, Haring HU, de Angelis MH. Common genetic variation in the human FNDC5 locus, encoding the novel muscle-derived ‘browning’
factor irisin, determines insulin sensitivity. PLoS One 2013;8:
e61903.
41. Roca-Rivada A, Castelao C, Senin LL, Landrove MO, Baltar J, Belen Crujeiras A, Seoane LM, Casanueva FF, Pardo M. FNDC5/
irisin is not only a myokine but also an adipokine. PLoS One 2013;8:e60563.
42. Chen JQ, Huang YY, Gusdon AM, Qu S. Irisin: a new molecu- lar marker and target in metabolic disorder. Lipids Health Dis 2015;14:2.
43. Reinehr T, Elfers C, Lass N, Roth CL. Irisin and its relation to insulin resistance and puberty in obese children: a longitudinal analysis. J Clin Endocrinol Metab 2015;100:2123-30.
44. Sanchis-Gomar F, Alis R, Pareja-Galeano H, Sola E, Victor VM, Rocha M, Hernandez-Mijares A, Romagnoli M. Circulat- ing irisin levels are not correlated with BMI, age, and other bio- logical parameters in obese and diabetic patients. Endocrine 2014;46:674-7.
45. Tang S, Zhang R, Jiang F, Wang J, Chen M, Peng D, Yan J, Bao Y, Hu C, Jia W. An interaction between a FNDC5 variant and obesity modulates glucose metabolism in a Chinese Han pop- ulation. PLoS One 2014;9:e109957.
46. Tanisawa K, Taniguchi H, Sun X, Ito T, Cao ZB, Sakamoto S, Higuchi M. Common single nucleotide polymorphisms in the FNDC5 gene are associated with glucose metabolism but do not affect serum irisin levels in Japanese men with low fitness levels. Metabolism 2014;63:574-83.
47. Kerstholt N, Ewert R, Nauck M, Spielhagen T, Bollmann T, Stubbe B, Felix SB, Wallaschofski H, Glaser S, Friedrich N. As- sociation of circulating irisin and cardiopulmonary exercise capacity in healthy volunteers: results of the Study of Health in Pomerania. BMC Pulm Med 2015;15:41.