Effect of Si on Corrosion of Fe-Cr and Fe-Cr-Ni Alloys in wet CO
2Gas
T. D. Nguyen, J. Zhang, and D. J. Young†
School of Materials Science and Engineering, University of New South Wales, Sydney, Australia (Received June 12, 2015; Revised June 26, 2015; Accepted June 29, 2015)
Model alloys Fe-9Cr, Fe-20Cr and Fe-20Cr-20Ni (wt. %) with 0.1 and 0.2 % Si were exposed to Ar-20CO2-20H2O gas at 818 oC. The undoped alloys formed a thick iron-rich oxide scale. The additions of Si reduced scaling rates of Fe-9Cr to some extent but significantly suppressed the formation of iron oxide scales on Fe-20Cr and Fe-20Cr-20Ni. Carburisation also occurred in all undoped alloys, but not in Si-containing Fe-20Cr and Fe-20Cr-20Ni. Protection against carburisation was a result of the formation of an inner scale layer of silica.
Keywords : steel, silicon, high temperature corrosion
†Corresponding author: d.young@unsw.edu.au
1. Introduction
Conventional power plants generate electricity by burning coal in ambient air, producing a flue gas rich in CO2, H2O, N2 and other minor gases. Oxy-fuel com- bustion is a new and promising approach to reduce greenhouse gas emission from power plants. In this proc- ess, coal is combusted in pure oxygen which is separated from air. As a result, the flue gas consists mainly of CO2 and H2O, offering a simplified way to separate, store and reuse CO2 easily. However, this gas mixture is high- ly corrosive to steels used in heat exchangers.
Silicon is usually present as a minor alloying ele- ment, and increases the oxidation resistance of high temperature steels because it forms a slow growing and dense silica layer. The aim of this paper was to study the benefits of Si additions for the corrosion resistance of Fe-(9, 20)Cr and Fe-20Cr-20Ni alloys at 818 oC in Ar-20CO2-20H2O.
2. Experimental Procedure
Nine model alloys with and without Si, Fe-(9, 20)Cr-(0.1, 0.2)Si and Fe-20Cr-20Ni-(0.1, 0.2)Si (weight
%), were prepared by arc melting pure metals such as Fe (99.97 %), Cr (99.995 %), Ni (99.95 %) and Si (98.5 %) in a flowing gas mixture of Ar-5 %H2. The arc-melted but- tons were annealed at 1150 oC in Ar-5%H2 gas for homogenization. Rectangular alloy samples were surface
ground to a 1200-grit finish and ultrasonically cleaned in alcohol prior to oxidation. XRD analysis confirmed that Fe-(9, 20)Cr-(Si) alloys were ferritic and Fe-20Cr-20Ni-(Si) alloys were austenitic.
All samples were reacted for up to 240 h at 818 oC in a flowing Ar-20%CO2-20%H2O mixture with a linear flow rate of 2 cm/s at a total pressure of 1 atm. Weight changes of reacted samples were measured using an ana- lytical balance with an accuracy of 0.1 mg. In weight change curves, each point corresponds to a separate sample. Reacted samples were characterized by X-ray diffractometry (XRD), scanning electron microscopy (SEM), transmission electron microscopy (TEM) and en- ergy dispersive analysis (EDX). Etchants used to reveal carbides and martensite in reacted samples were Murakami’s solution (2 g K3Fe(CN)6 + 2 g KOH + 20 ml H2O) at 100 oC for Fe-9Cr-(Si) alloys, and a modified glyceregia solution (10 ml glycerine + 6 ml HCl + 3 ml HNO3) at room temperature for Fe-20Cr-(20Ni) alloys.
3. Results and Discussion
3.1 Corrosion of Fe-9Cr-(0.1, 0.2)Si alloys
Weight gain kinetics of Fe-9Cr-(0.1, 0.2)Si alloys are shown in Fig. 1. The weight gains of all alloys were large and increased approximately parabolically with time. However, the weight gain of Si-containing alloys was smaller than that of the undoped Fe-9Cr alloy. No scale spallation was observed for any alloy during cooling.
Fig. 1. Weight gain kinetics of Fe-9Cr alloys, showing silicon effect.
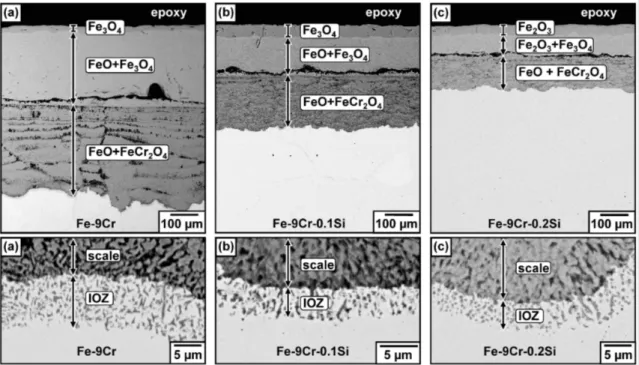
Fig. 2. BSE-SEM images of oxide scales and internal oxidation zones after reaction for 70 h of (a) Fe-9Cr, (b) Fe-9Cr-0.1Si, and (c) Fe-9Cr-0.2Si.
Fig. 3. Optical microscope cross-sections (etched) of carburization products in (a) Fe-9Cr (70h), (b) Fe-9Cr-0.1Si (70 h), and (c) Fe-9Cr-0.2Si (120 h).
After reaction for 70 h, Fe-9Cr-(Si) alloys formed iron-rich oxide scales (Fig. 2). The scales on Fe-9Cr and Fe-9Cr-0.1Si consisted of an outer Fe3O4 layer, an inter- mediate (FeO+Fe3O4) layer and an inner (FeO+FeCr2O4) layer. The Fe-9Cr-0.2Si alloy formed a scale with an outer Fe2O3 layer, an intermediate (Fe2O3+Fe3O4) layer and an inner (FeO+FeCr2O4) layer. Scale thicknesses were 608 µm (Fe-9Cr), 384 µm (Fe-9Cr-0.1Si), and 228 µm (Fe-9Cr-0.2Si), showing that Fe-9Cr-0.2Si had the thinnest scale. These alloys also formed an internal oxi- dation zone (IOZ) containing chromium rich oxide pre-
Fig. 4. Weight gain kinetics of Fe-20Cr alloys, showing silicon effect.
Fig. 5. BSE-SEM cross-sections of Fe-20Cr after reaction for 40 h showing (a) thin Cr2O3 scale and (b) thick iron-rich oxide scale.
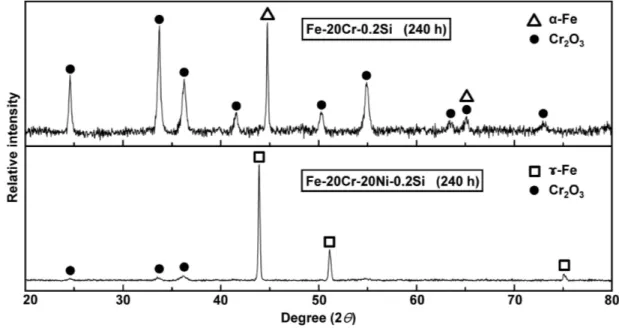
Fig. 6. XRD patterns of Fe-20Cr-0.2Si and Fe-20Cr-20Ni-0.2Si after reaction for 240 h.
cipitates beneath the scale-alloy interface.
Reaction in CO2 gas also resulted in carburisation products in Fe-9Cr-(Si) alloys as seen in Fig. 3. The Fe-9Cr alloy formed scattered martensite grains and
Cr-rich carbides on cooling. Carbide precipitates also were observed in Fe-9Cr-0.1Si and Fe-9Cr-0.2Si.
3.2 Corrosion of Fe-20Cr-(0.1, 0.2)Si alloys
Weight gain kinetics of Fe-20Cr-(0.1, 0.2)Si alloys are shown in Fig. 4. The weight gains of Fe-20Cr-(0.1, 0.2)Si were very small whereas that of Fe-20Cr was large and increased continuously with time. No scale spalla- tion was observed for any alloy during cooling.
Cross-sections of Fe-20Cr after reaction for 40 h are shown in Fig. 5. The alloy formed a thin Cr2O3 scale on a small part of its surface (Fig. 5a) and an iron-rich oxide scale on the rest (Fig. 5b). The thick iron oxide scale consisted of an outer Fe2O3 layer, an intermediate (Fe3O4+FeCr2O4) layer, and an inner Cr2O3 layer.
Carbide precipitates were also observed in this alloy after reaction (Fig. 5b).
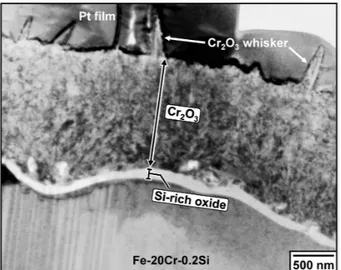
Fig. 7. Bright field TEM image of Fe-20Cr-0.2Si after reaction for 240 h.
Fig. 8. Weight gain kinetics of Fe-20Cr-20Ni alloys, showing silicon effect.
Fig. 9. BSE-SEM cross-section of Fe-20Cr-20Ni after reaction for 120 h.
XRD patterns from the surfaces of 0.2Si-bearing Fe-20Cr and Fe-20Cr-20Ni alloys reacted for 240 h are shown in Fig. 6. Only Cr2O3 peaks were observed for both alloys. Despite the long reaction time, no peaks
of other oxides were detected.
A bright-field TEM image of the oxide scale on Fe-20Cr-0.2Si reacted for 240 h is shown in Fig. 7. The thin and dense scale consisted of an outer Cr2O3 layer and an inner Si-rich oxide layer. No carbide was ob- served in any Si-containing Fe-20Cr alloys after reaction.
3.3 Corrosion of Fe-20Cr-20Ni-(0.1, 0.2)Si alloys Weight gain kinetics of Fe-20Cr-20Ni-(0.1, 0.2)Si alloys are shown in Fig. 8. The weight gain of Fe-20Cr-20Ni was large and increased progressively with time while those of the Si-containing alloys re- mained very small. Scale spallation happened occasion- ally for Fe-20Cr-20Ni-(Si) alloy after cooling.
A cross-section of Fe-20Cr-20Ni after reaction for 120 h is shown in Fig 9. This alloy formed a uniform Fe2O3
scale and an IOZ of (FeNi3+FeCr2O4).
A bright-field TEM image of Fe-20Cr-20Ni-0.2Si af- ter reaction for 240 h is shown in Fig. 10. The scale was thin and consisted of an outer Cr2O3 layer and an inner Si-rich oxide layer. After reaction in CO2 gas, in- tergranular carbide precipitates were observed in the un- doped Fe-20Cr-20Ni (Fig. 11) but not in Si-containing Fe-20Cr-20Ni alloys.
For oxidation and carburisation, oxygen and carbon are transported from the reaction gas to the alloy surface by the reactions:
CO2 = CO + (1/2)O2 (1)
2CO = CO2 + C (2)
H2O = H2 + (1/2)O2 (3)
Fig. 10. Bright field TEM image of Fe-20Cr-20Ni-0.2Si after reaction for 240 h.
Fig. 11. Carbide in Fe-20Cr-20Ni (etched) after reaction for 70 h.
Internal carburisation was observed beneath the iron rich oxide scale (Fig. 3, 5b, 11), showing that this scale was not an effective diffusion barrier against carbon pen- etration and therefore carbon activity at the scale-alloy interface was high enough for carburisation of the alloys.
Carburisation of Fe-9Cr resulted in austenite, ferrite and carbide at the reaction temperature. During cooling, aus- tenite transformed to martensite because the cooling rate of Fe-9Cr was fast enough1). Details of the carburisation of Fe-9Cr have been discussed elsewhere1). The for- mation of internal carbide precipitates is undesirable be- cause it reduces the amount of Cr available in the under- lying alloy to form and maintain a protective chromia
scale.
It has been proved that carbon diffusion through a Cr2O3 scale is mainly via oxide grain boundaries2), result- ing in internal carbides in Fe-20Cr. An additional Si-rich oxide layer beneath the Cr2O3 layer on Si-containing Fe-20Cr and Fe-20Cr-20Ni alloys effectively blocks car- bon penetration.
The addition of Si to Fe-9Cr reduced the oxygen up- take to some extent (Fig. 1). Although Si-bearing Fe-9Cr alloys still formed an iron-rich oxide scale, these scales were thinner than that on the undoped Fe-9Cr alloy (Fig.
2). In contrast, the additions of Si to Fe-20Cr and Fe-20Cr-20Ni markedly improved the oxidation resist- ance by forming a Si-rich oxide layer beneath the Cr2O3
layer (Fig. 7 and 10). Both oxides grow very slowly, leading to very low weight gains, as seen in Fig. 4 and Fig. 8.
4. Conclusions
In all undoped Fe-(9, 20)Cr and Fe-20Cr-20Ni al- loys, a non-protective iron rich oxide scale formed and then carburisation products formed beneath this scale. The addition of Si to Fe-9Cr improved the oxidation resistance to some extent but carburisation still occurred.
The addition of Si to Fe-20Cr and Fe-20Cr-20Ni alloys dramatically improved both the oxidation and carbur- isation resistance by forming a slow growing scale of (Cr2O3+Si-rich oxide).
Acknowledgments
Financial support from the Australian Research Council’s Discovery program is gratefully acknowledged.
References
1. T. D. Nguyen, J. Zhang, D. J. Young, Scr. Mater., 69, 9 (2013).
2. D. J. Young, T. D. Nguyen, P. Felfer, J. Zhang, J. M.
Cairney, Scr. Mater., 77, 29 (2014).