© 2011 Korean Breast Cancer Society http://ejbc.kr | pISSN 1738-6756
INTRODUCTION
The relationship between breast cancer and obesity has been recognized for many years [1,2]. The postulated mechanisms for the increased risk of breast cancer in obese women are ele- vated estrogen levels and insulin resistance and the influence of insulin-like growth factor (IGF) in the pathogenesis of breast cancer [3,4]. Multiple studies have indicated that some adipose tissue-derived hormones called adipocytokines, such as leptin and adiponectin, may significantly influence the growth and proliferation of tumors [5-7].
Leptin, a product of the obese (Ob) gene, is produced predom- inantly in adipose tissue and expressed in normal mammary epithelial cells and malignant breast tissues [8-10]. Some inves-
tigators have reported that expression of leptin and leptin recep- tor (ObR) is significantly higher in breast carcinoma compared to normal mammary tissue [11,12]. Leptin is involved in a var- iety of functions including appetite regulation, bone forma- tion, reproduction, and angiogenesis [13]. Several studies have investigated the effects of leptin on breast cancer, and suggest that leptin may affect processes related to cancer initiation and progression, resulting in metastatic development [9,11,14,15].
Leptin acts through its receptor (ObR), which is encoded by the Ob gene. In human tissues, four different ObR variants have been described but only the long ObR isoform (ObR1) has full signaling potential [16]. Binding of leptin to ObR acti- vates the Janus kinase/signal transducer and activator of tran- scription (JAK/STAT) signaling pathway, and induction of JAK stimulates phosphoinositol-3-kinase (PI3Kinase). Activation of PI3Kinase can increase cell migration and invasion via the Rac/Rho pathways, and stimulate the major growth and sur- vival Akt pathway [7].
Adiponectin is another adipocytokine predominantly secret- ed by adipocytes [6]. In contrast to other adipocytokines, adi- ponectin levels are inversely correlated with central fat accu-
Expression of Leptin, Leptin Receptor, Adiponectin, and Adiponectin Receptor in Ductal Carcinoma In Situ and Invasive Breast Cancer
Young-Ju Jeong, Jin-Gu Bong, Sung-Hwan Park, Jung-Hye Choi1, Hoon-Kyu Oh2
Department of Surgery, Catholic University of Daegu School of Medicine, Daegu; 1Department of Molecular Biology, Kyung Hee University College of Pharmacy, Seoul; 2Department of Pathology, Catholic University of Daegu School of Medicine, Daegu, Korea
ORIGINAL ARTICLE
Purpose: Adipocytokines, such as leptin, resistin, and adiponec- tin, are associated with obesity and breast cancer. Several studies have indicated that adipocytokines may influence tumor growth or differentiation. The aims of this study were to determine the expression of leptin, leptin receptor (ObR), adiponectin and adi- ponectin receptor (AdipoR) in human breast cancer, to evaluate their prognostic significance in the breast cancer. Methods: Speci- mens from 198 patients with primary breast cancer were enrolled, and representative paraffin tumor blocks were selected for con- structing tissue microarrarys (TMA). Immunohistochemical stain- ing for leptin, ObR, adiponectin, and AdipoR was performed us- ing TMA, and the clinicopathologic characteristics were evaluated from the patient’s medical records. Results: Stage 0 breast can- cer accounted for 41 cases, and 157 cases were invasive can- cer. Positive rates of leptin and ObR expression in the ductal car-
cinoma in situ (DCIS) group were significantly higher than those of the invasive cancer group (97.4% vs. 34.0%, p<0.001; 74.4%
vs. 29.8%, p<0.001). However, positive rates of adiponectin and AdipoR expression in the invasive cancer group were significantly higher than those in the DCIS group (53.7% vs. 33.3%, p=0.024;
59.9% vs. 26.3%, p<0.001). High leptin expression was signifi- cantly associated with high Ki-67 expression (p=0.016). High adi- ponectin expression was significantly correlated with smaller tu- mor size (p=0.001). Conclusion: We suggest that losses of leptin and ObR expression could be associated with invasive cancer, whereas high adiponectin and AdipoR expression may be asso- ciated with breast cancer invasiveness.
Key Words: Adipocytokine, Adiponectin, Breast neoplasms, Leptin
Correspondence: Hoon-Kyu Oh
Department of Pathology, Catholic University of Daegu School of Medicine, 3056-6 Daemyeong 4-dong, Nam-gu, Daegu 705-718, Korea
Tel: +82-53-650-4156, Fax: +82-53-650-3050 E-mail: [email protected]
This work was supported by Research Fund of Daegu Catholic Medical Center.
Received: September 18, 2010 Accepted: April 5, 2011
Cancer
mulation [17], and an inverse correlation was found between plasma adiponectin levels and the histological grade of breast cancer [18,19]. However, the precise effects of adiponectin in breast cancer are still unclear.
Two types of adiponectin receptors (AdipoR1 and R2) have been described, and adiponectin acts via those receptors. Adi- poR1 acts mainly through adenosine monophosphate-activat- ed protein kinase (AMPK) pathways, whereas AdipoR2 is more closely linked to the activation of the peroxisome proliferator- activated receptor alpha pathway. The growth inhibitory effect of adiponectin is influenced mainly through AMPK activation, while anti-cancer effects of adiponectin are mainly achieved by activation of AdipoR1 [20,21].
Leptin stimulates the invasion of breast cancer cells [11,14, 22]. However, the relationship between leptin, ObR, adiponec- tin, AdipoR, and breast cancer invasiveness has not been in- vestigated in human tissue. In the present study, we monitored the expression of leptin, ObR, adiponectin and AdipoR in breast cancer specimens using immunohistochemistry and analyzed how changes in expression correspond to clinicopathological parameters including breast cancer invasiveness.
METHODS
Patients and materials
A total of 198 patients with primary breast cancer who un- derwent surgery between January 2003 and April 2008 at Dae- gu Catholic University Medical Center were included. All re- sected specimens were stained with hematoxylin and eosin (H&E) and histologically examined. According to the pathol- ogic diagnosis, 41 patients had ductal carcinoma in situ (DCIS), and 157 patients had invasive breast cancer.
The clinicopathological characteristics such as menopausal state, body mass index (BMI), and tumor invasiveness were evaluated based on pathological reports and medical records.
Prognostic factors including tumor size, nodal status, distant metastasis, histological grade, lymphovascular invasion, and estrogen receptor (ER), progesterone receptor (PR), human epi- dermal growth factor receptor-2 (HER2), Bcl-2, Ki67, and p53 expression were evaluated in invasive breast cancer. Lesion stag- ing was assessed according to the sixth edition of the Ameri- can Joint Committee on Cancer (AJCC) staging manual for breast cancer.
Construction of tissue microarrays (TMA)
Representative paraffin tumor blocks were selected accord- ing to the primary evaluation of H&E-stained slides before they were prepared for TMA. Two tumor tissue cores (1 mm in di- ameter) were taken from each of the donor breast cancer tissue
blocks with a manual punch arrayer (Quick-RayTM; Uni-Tech Science, Seoul, Korea). The cores were placed in a new recipi- ent paraffin block that ultimately contained 72-96 tissue cores.
Each array block contained both tumor and control tissue sam- ples. Multiple sections (5-μm in thickness) were cut from the TMA blocks and then mounted onto microscope slides. The TMA H&E-stained sections were reviewed under light micros- copy to confirm the presence of representative tumor areas.
Immunohistochemical staining
Immunohistochemistry was conducted on 5 μm-thick TMA tissue sections using the Bond Polymer Intense Detection Sys- tem (Leica Microsystems, Victoria, Australia) according to the Table 1. General patient characteristics (n=198)
Variables No. (%)
Age (yr)* 50.87 (25-81)
Sex Female
Male 197 (99.5)
1 (0.5) Menopausal state
Premenopausal
Postmenopausal 103 (52.3)
94 (47.7) BMI (kg/m2)
≥25
<25 69 (36.7)
119 (63.3) Pathologic diagnosis
DCIS
Invasive cancer 41 (20.7)
157 (79.3) AJCC staging
0 I II III IV
41 (20.7) 57 (28.8) 71 (35.9) 26 (13.1) 3 (1.5) Axillary lymph node metastasis
Negative Positive
123 (64.1) 69 (35.9) Distant metastasis
Negative Positive
195 (98.5) 3 (1.5) Histologic grade
1 2 3
41 (20.7) 67 (33.8) 34 (17.2) ER
Negative
Positive 67 (34.9)
125 (65.1) PR
Negative
Positive 47 (24.5)
145 (75.5) HER2 expression
No overexpression
Overexpression 123 (64.4)
68 (35.6)
BMI=body mass index; DCIS=ductal carcinoma in situ; AJCC=American Joint Committee on Cancer; ER=estrogen receptor; PR=progesterone receptor.
*Mean (range).
manufacturer’s instruction with minor modifications. Briefly, the 5 μm-thick sections of formalin-fixed and paraffin-embed- ded TMA tissues were deparaffinized with Bond Dewax Solu- tion (Leica Microsystems), and an antigen retrieval procedure was performed using Bond ER Solution (Leica Microsystems) for 30 minutes at 100°C. The endogenous peroxidase was quen- ched by a 5-minute incubation with hydrogen peroxide. Sec- tions were incubated for 15 minutes at ambient temperature with a rabbit polyclonal anti-leptin antibody (ab16227, 1:150;
Abcam, Cambridge, UK), a rabbit polyclonal anti-leptin recep- tor antibody (ab60042, 1:150; Abcam), a mouse monoclonal anti-adiponectin antibody (ab22554, 1:150; Abcam) and a goat polyclonal anti-adiponectin receptor antibody (ab77611, 1:200;
Abcam) using a biotin-free polymeric horseradish peroxidase- linker antibody conjugate system in a Bond-Max automatic slide stainer (Leica Microsystems). Human adipocytes (leptin and adiponectin), heptocellular carcinoma (leptin receptor) and normal liver (adiponectin receptor) tissues were used as positive controls.
Interpretation of immunohistochemical stain
Leptin, ObR, adiponectin, and AdipoR expression levels were graded on a scale of 0 to 2 based on staining intensity and pro- portion of positive tumor cells by an expert pathologist who was blinded to the patient’s clinical records. The staining was scored as 0 if no cancer cells were reactive, 1 if staining was weakly posi-
tive in <2/3 of cancer cells, or strongly positive in <1/3 of can- cer cells, and 2 if staining was weakly positive in >2/3 of can- cer cells, or strongly positive in >1/3 of cancer cells. Immuno- histochemical staining in breast cancer tissue was classified as negative (score 0) or positive (score 1 and 2).
A cutoff value of 10% for the stained nuclei was used to de- fine ER and PR positivity. Cytoplasmic staining with any inten- sity in >10% of the tumor cells was scored as positive for Bcl-2.
Membranous staining for HER2 with strong complete stain- ing in 10% of the tumor cells was regarded as HER2 overex- pression. The p53 staining was scored positive if >10% of the cells were stained with strong intensity. The Ki-67 labeling in- dex was expressed as a percentage and was graded as “high” if the number of positive cells was ≥10%.
Statistical analysis
The statistical analysis was performed using SPSS version 15.0 (SPSS Inc., Chicago, USA). The relationship between leptin, ObR, adiponectin, AdipoR expression and clinicopathological features was assessed by the chi-square test. A p-value of less than 0.05 was considered statistically significant.
RESULTS
Clinicopathologic characteristics of the patients
The average age of the 198 patients with breast cancer was
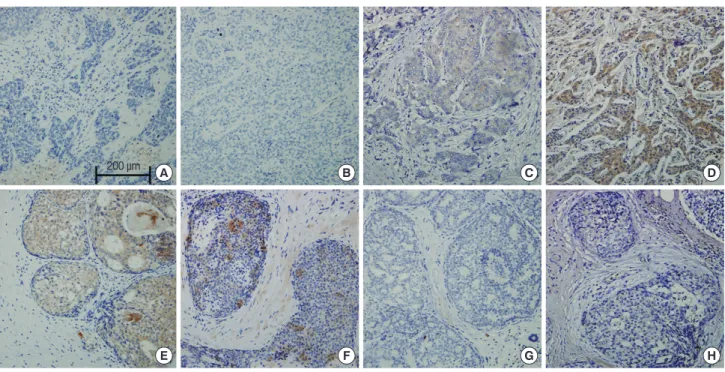
A B C D
E F G H
200 μm
Figure 1. Representative examples of immunohistochemical expression of leptin (A, E), leptin receptor (B, F), adiponectin (C, G), and adiponectin re- ceptor (D, H) in invasive ductal carcinoma (upper row) and ductal carcinoma in situ (lower row). Staining for leptin, leptin receptor, adiponectin, and adiponectin receptor appears in the cytoplasm of tumor cells. We interpreted the results semi-quantitatively based on the number of stained cells and signal intensity (immunohistochemical staining, ×200). Scale bar means 200 micrometer.
50.87±11.10 years (range, 25-81 years). Among 197 female pa- tients, 95 (47.3%) were postmenopausal and 106 (52.7%) were premenopausal. The mean BMI was 24.1±3.4 kg/m2. Accord- ing to criteria of the World Health Organization, a BMI ≥25 kg/m2 is defined as overweight, a BMI between 18.5 kg/m2 and 24.9 kg/m2 is normal, and a BMI <18.5 kg/m2 is considered underweight. A total of 69 patients (36.7%) were overweight, and 119 patients (63.3%) were normal or underweight (Table 1). TNM staging was as follows: 41 patients (20.7%) had stage 0, 57 patients (28.8%) had stage I, 71 patients (35.9%) had stage II, 26 patients (13.1%) had stage III, and three (1.5%) patients had stage IV. The histological types of DCIS were comedo (n=
16), solid (n=10), papillary (n=11), and cribriform (n=4), and those of invasive cancers were ductal carcinoma not oth- erwise specified (n=154), lobular carcinoma (n=1), medul- lary carcinoma (n=1), and metaplastic carcinoma (n=1).
Immunohistochemical findings of leptin, ObR, adiponectin, and AdipoR
We constructed two DCIS TMAs and four invasive breast cancer TMAs, which included specimens from 41 DCIS and 157 invasive breast cancer cases. Some of the tissue specimens that were partly lost during TMA construction or were unavail- able were excluded. Figure 1 shows representative micro- photograph of immunohistochemical expression of the adipo- cytokines and their receptors. Positive expression rates for leptin, ObR, adiponectin, and AdipoR were 47.1% (89/189),
38.9% (74/190), 49.5% (93/188), and 53.2% (101/190), respec- tively.
Relationship between leptin, ObR, adiponectin, AdipoR expression and clinicopathological features in DCIS
As shown in Figure 2, positive rates of leptin and ObR expres- sion in the DCIS group were significantly higher than those of
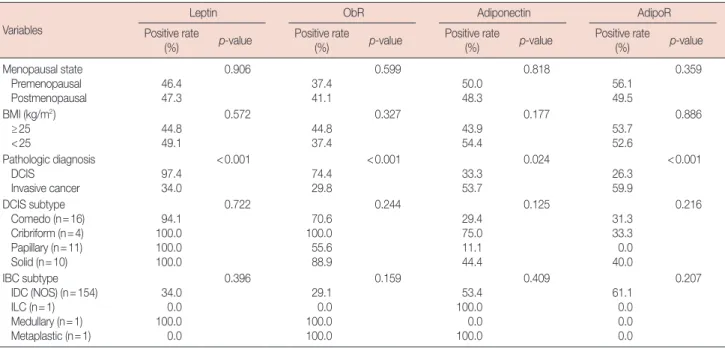
Table 2. Clinicopathologic characteristics related to adipocytokines and their receptor expression in breast cancer tissues Variables
Leptin ObR Adiponectin AdipoR
Positive rate
(%) p-value Positive rate
(%) p-value Positive rate
(%) p-value Positive rate
(%) p-value
Menopausal state Premenopausal
Postmenopausal 46.4
47.3
0.906
37.4 41.1
0.599
50.0 48.3
0.818
56.1 49.5
0.359
BMI (kg/m2) ≥25
<25 44.8
49.1
0.572
44.8 37.4
0.327
43.9 54.4
0.177
53.7 52.6
0.886
Pathologic diagnosis DCIS
Invasive cancer 97.4
34.0
<0.001
74.4 29.8
<0.001
33.3 53.7
0.024
26.3 59.9
<0.001
DCIS subtype Comedo (n=16) Cribriform (n=4) Papillary (n=11) Solid (n=10)
94.1 100.0 100.0 100.0
0.722
70.6 100.0 55.6 88.9
0.244
29.4 75.0 11.1 44.4
0.125
31.3 33.3 0.0 40.0
0.216
IBC subtype IDC (NOS) (n=154) ILC (n=1) Medullary (n=1) Metaplastic (n=1)
34.0 0.0 100.0 0.0
0.396
29.1 0.0 100.0 100.0
0.159
53.4 100.0 0.0 100.0
0.409
61.1 0.0 0.0 0.0
0.207
ObR=leptin receptor; AdipoR=adiponectin receptor; BMI=body mass index; DCIS=ductal carcinoma in situ; IBC=invasive breast cancer; IDC=invasive ductal carcinoma; NOS=not otherwise specified; ILC=invasive lobular cancer.
Positive rate (%)
A B C D
120 100 80 60 40 20 0
p<0.001
p<0.001
p=0.024 p<0.001
DCIS
Invasive carcinoma
Figure 2. Comparison of leptin (A), leptin receptor (obR) (B), adiponectin (C), and adiponectin receptor (AdipoR) (D) expression levels between patients with ductal carcinoma in situ (DCIS) and invasive breast cancer.
Expression of leptin and ObR were significantly higher in the DCIS group than in the invasive cancer group, and adiponectin and AdipoR expres- sion was significantly higher in the invasive cancer group than the DCIS group.
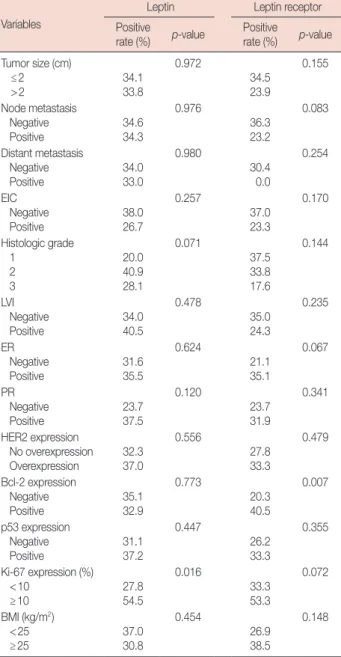
Table 3. Correlation between the expression of leptin, leptin receptor and prognostic factors in invasive breast cancer tissues
Variables
Leptin Leptin receptor
Positive
rate (%) p-value Positive
rate (%) p-value Tumor size (cm)
≤2
>2 34.1
33.8
0.972
34.5 23.9
0.155
Node metastasis Negative
Positive 34.6
34.3
0.976
36.3 23.2
0.083
Distant metastasis Negative
Positive 34.0
33.0
0.980
30.4 0.0
0.254
EIC Negative
Positive 38.0
26.7
0.257
37.0 23.3
0.170
Histologic grade 1
2 3
20.0 40.9 28.1
0.071
37.5 33.8 17.6
0.144
LVI Negative Positive
34.0 40.5
0.478
35.0 24.3
0.235
ER Negative Positive
31.6 35.5
0.624
21.1 35.1
0.067
PR Negative Positive
23.7 37.5
0.120
23.7 31.9
0.341
HER2 expression No overexpression Overexpression
32.3 37.0
0.556
27.8 33.3
0.479
Bcl-2 expression Negative
Positive 35.1
32.9
0.773
20.3 40.5
0.007
p53 expression Negative
Positive 31.1
37.2
0.447
26.2 33.3
0.355
Ki-67 expression (%) <10
≥10 27.8
54.5
0.016
33.3 53.3
0.072
BMI (kg/m2) <25
≥25 37.0
30.8
0.454
26.9 38.5
0.148
EIC=extensive intraductal component; LVI=lymphovascular invasion;
ER=estrogen receptor; PR=progesterone receptor; BMI=body mass index.
Table 4. Correlation between the expression of adiponectin, adiponec- tin receptor and prognostic factors in invasive breast cancer tissues
Variables
Adiponectin Adiponectin receptor Positive
rate (%) p-value Positive
rate (%) p-value Tumor size (cm)
≤2
>2 65.5
38.5
0.001
64.0 54.5
0.241
Node metastasis Negative
Positive 56.3
50.7
0.505
59.8 60.9
0.889
Distant metastasis Negative
Positive 53.4
66.7
0.649
60.0 50.0
0.774
EIC Negative
Positive 59.3
48.3
0.295
63.4 60.0
0.735
Histologic grade 1
2 3
59.0 59.1 40.6
0.186
65.0 60.6 55.9
0.726
LVI Negative Positive
54.5 52.8
0.855
64.0 60.5
0.706
ER Negative Positive
51.8 54.8
0.717
58.6 60.6
0.805
PR Negative Positive
52.6 54.1
0.879
53.8 61.9
0.374
HER2 expression No overexpression Overexpression
49.0 62.3
0.119
60.2 59.3
0.909
Bcl-2 expression Negative
Positive 52.1
56.2
0.618
61.3 58.7
0.739
p53 expression Negative
Positive 48.3
59.3
0.190
60.3 58.6
0.835
Ki-67 expression (%) <10
≥10 63.9
63.6
0.981
34.7 65.3
0.029
BMI (kg/m2) <25
≥25 58.7
47.1
0.181
58.1 61.5
0.683
EIC=extensive intraductal component; LVI=lymphovascular invasion;
ER=estrogen receptor; PR=progesterone receptor; BMI=body mass index.
the invasive cancer group (97.4% vs. 34.0%, p<0.001; 74.4% vs.
29.8%, p<0.001), and positive rates of adiponectin and Adi- poR expression in the invasive cancer group were significantly higher than those of the DCIS group (53.7% vs. 33.3%, p=0.024;
59.9% vs. 26.3%, p<0.001).
Comparing the expression of leptin, ObR, adiponectin, and AdipoR with menopausal status and BMI, no significant cor- relation was observed and a comparison according to the his- tological subtypes of DCIS and invasive breast cancer showed
no significant differences in the expression levels of each of the adipocytokines and their receptors (Table 2).
Correlation between the expression of leptin, ObR, adiponectin, and AdipoR and prognostic factors in invasive breast cancer tissues
We analyzed the correlation between leptin, ObR, adiponec- tin, AdipoR expression and prognostic factors in invasive breast cancer. The results showed that leptin expression was signifi-
cantly associated with high Ki-67 expression (p=0.016), and ObR expression was significantly associated with negative Bcl-2 expression (p=0.007). However, neither leptin expression nor ObR expression was significantly correlated with menopausal state, BMI, distant metastases, histological grade, HER2 expres- sion, or p53 expression (Table 3).
Adiponectin expression was significantly associated with lower T-stage (p=0.028) in invasive breast cancer, but not with menopausal state, BMI, N stage, distant metastases, histologi- cal grade, lymphovascular invasion, hormonal receptor status, HER2 expression, or the other immunohistochemical parame- ters. AdipoR expression was significantly associated with high Ki-67 expression (p=0.029) in invasive breast cancer (Table 4).
Correlation between leptin and ObR expression and adiponectin and AdipoR expression
Leptin expression was significantly associated with ObR ex- pression (p<0.001), and adiponectin expression was signifi- cantly associated with AdipoR expression (p<0.001). How- ever, leptin and adiponectin expression were not significantly correlated (p=0.463), and neither was ObR or AdipoR (p=
0.175).
DISCUSSION
We observed that leptin, ObR, adiponectin, and AdipoR were significantly related to invasiveness of breast cancers. Positive rates of leptin and leptin receptor expression observed in the DCIS group were higher than those of the invasive cancer group, but positive rates of adiponectin and AdipoR expression were higher in the invasive cancer group. These results suggest that losses of leptin and ObR expression could be associated with breast cancer invasion. We assume that leptin and ObR expres- sion is related to an early stage of carcinogenesis such as cancer development, while adiponectin and AdipoR may be associat- ed with invasiveness of breast cancer. Our results also showed that leptin expression was significantly associated with a high Ki-67 labeling index, suggesting that leptin is associated with the proliferation of breast cancer cells, which is supported by recent studies [5-7,14].
Although some in vitro studies have demonstrated that leptin promotes invasiveness of human breast cancer cells, epidemi- ological studies showing a relation between leptin expression and invasiveness of breast cancer have not been reported. Sax- ena et al. [14] showed that bidirectional crosstalk between leptin and IGF-1 signaling promotes invasion and migration of breast cancer cells via transactivation of epidermal growth factor re- ceptors. McMurtry et al. [22] showed that leptin increases the invasiveness and matrix metallopeptidase 2 activity of breast
cancer cells, which are mediated by Jun N-terminal kinases activation. In contrast, our results revealed that leptin and ObR expression was inversely correlated with breast cancer invasive- ness. Additionally, leptin and ObR expression was not associ- ated with distant metastasis, histological grade, lymphovascu- lar invasion, or the other immunohistochemical parameters.
From these results, we suggest that leptin and ObR are related to tumorigenesis of breast cancer, but not invasiveness.
A number of studies were initiated to understand the mech- anisms associated with leptin and mammary tumor develop- ment [23,24]. Adipocytokines circulating in the blood exert their biological actions on target cells not only by classical en- docrine mechanisms but also through paracrine or autocrine pathways [23-25]. Expression of leptin in breast cancer tissue is not representative of serum leptin concentrations, and is con- sidered to be a product of the paracrine pathway [23]. Leptin mediates the estrogenic stimulation of tumor cells through a paracrine mechanism, and increases other factors that con- tribute to cell proliferation and angiogenesis during mamma- ry tumor growth [24]. Furthermore, the autoregulation of leptin augments its signal by stimulating expression of itself and its receptor which supports an autocrine function [25]. Our results showed that leptin expression was significantly associated with ObR expression, and that adiponectin expression was signifi- cantly associated with AdipoR expression. Furthermore, leptin and adiponectin appear to have antagonistic effects in breast cancer invasion, although they were not significantly correlat- ed. We suppose that leptin and adiponectin autoregulate their receptor through an autocrine pathway, and that leptin and adi- ponectin affect each other through a paracrine pathway.
The precise effects of adiponectin on breast cancer risk are still unclear. Epidemiological studies have reported a signifi- cant inverse association between adiponectin and breast can- cer risk [17,19], and several in vitro studies have demonstrated a growth inhibitory action of adiponectin on breast cancer cells [26,27]. In contrast, Karaduman et al. [28] reported that tissue adiponectin levels in patients with breast cancer were signifi- cantly higher than healthy individuals, and that high tissue adi- ponectin levels were associated with a significantly increased risk for breast cancer compared with those with low tissue adi- ponectin levels.
The relationship between adiponectin expression and breast cancer invasiveness is still unknown. Pfeiler et al. [29] report- ed a positive correlation between lymphovascular and vascu- lar invasion and AdipoR2 but not AdipoR1 expression. Jardé et al. [10] showed that adiponectin expression is higher in nor- mal adjacent tissue than in neoplastic tissue, and that adiponec- tin expression in invasive ductal carcinoma is higher than that of in situ ductal carcinoma. In our study, we found that adipo-
nectin and AdipoR expression in invasive breast cancer was significantly higher than that of DCIS, suggesting that adipo- nectin and AdipoR are related to breast cancer invasiveness. In this way, adiponectin may be associated with the progression and invasiveness of tumors and involved in later stages of breast cancer development.
As obesity is a key factor associated with circulating adipo- cytokine levels, obesity indices such as BMI may be related to adipocytokines and their receptor levels in tissues. However, in our immunostaining analysis, we did not find any associa- tion between adipocytokine expression and BMI. This finding was consistent with the idea that peritumoral adipose tissues are a key contributor to circulating leptin levels and tumor leptin production and act as a minor source of blood adipocytokine [23]. Because BMI is the best proxy for body fat percentage among ratios of weight and height and is generally used as a vague means of estimating adiposity, BMI could be related to adipocytokine levels in blood but not in tissues. This assump- tion is supported by the observation of Hancke et al. [30] who found a strong positive association between leptin levels and BMI.
Our present study has several limitations. First, we could not evaluate adipocytokine expression in peritumoral normal breast tissue, because TMA was used. So, our results were limited to tumor tissues and a comparative study of the adipocytokine expression in breast cancer with a control group, including nor- mal or benign breast tissue between cancer tissue, may be nec- essary to understand adipocytokine effects. Second, we could not evaluate adipocytokine expression in breast cancer tissue and blood samples simultaneously. Although we assumed that the level of serum adipocytokine is not correlated with tissue adipocytokine expression based on multiple studies [17,19,23, 28], analysis of serum adipocytokine may be necessary to form a solid conclusion. Third, the adipocytokine action mechanism in breast tissue was not studied, which can be further clarified through in vitro experiments. Despite these limitations, we be- lieve that this study is meaningful because, it provided evidence that leptin is inversely related to cancer invasion, and that adi- ponectin is significantly related to breast cancer invasion.
REFERENCES
1. Reinier KS, Vacek PM, Geller BM. Risk factors for breast carcinoma in situ versus invasive breast cancer in a prospective study of pre- and post- menopausal women. Breast Cancer Res Treat 2007;103:343-8.
2. Stephenson GD, Rose DP. Breast cancer and obesity: an update. Nutr Cancer 2003;45:1-16.
3. Key TJ, Appleby PN, Reeves GK, Roddam A, Dorgan JF, Longcope C, et al. Body mass index, serum sex hormones, and breast cancer risk in postmenopausal women. J Natl Cancer Inst 2003;95:1218-26.
4. Renehan AG, Zwahlen M, Minder C, O’Dwyer ST, Shalet SM, Egger M.
Insulin-like growth factor (IGF)-I, IGF binding protein-3, and cancer risk: systematic review and meta-regression analysis. Lancet 2004;363:
1346-53.
5. Vona-Davis L, Rose DP. Angiogenesis, adipokines and breast cancer.
Cytokine Growth Factor Rev 2009;20:193-201.
6. Housa D, Housová J, Vernerová Z, Haluzík M. Adipocytokines and can- cer. Physiol Res 2006;55:233-44.
7. Garofalo C, Surmacz E. Leptin and cancer. J Cell Physiol 2006;207:12-22.
8. Zhang Y, Proenca R, Maffei M, Barone M, Leopold L, Friedman JM.
Positional cloning of the mouse obese gene and its human homologue.
Nature 1994;372:425-32.
9. Hu X, Juneja SC, Maihle NJ, Cleary MP. Leptin--a growth factor in nor- mal and malignant breast cells and for normal mammary gland devel- opment. J Natl Cancer Inst 2002;94:1704-11.
10. Jardé T, Caldefie-Chézet F, Damez M, Mishellany F, Perrone D, Penault- Llorca F, et al. Adiponectin and leptin expression in primary ductal breast cancer and in adjacent healthy epithelial and myoepithelial tissue. His- topathology 2008;53:484-7.
11. Ishikawa M, Kitayama J, Nagawa H. Enhanced expression of leptin and leptin receptor (OB-R) in human breast cancer. Clin Cancer Res 2004;
10:4325-31.
12. Tessitore L, Vizio B, Jenkins O, De Stefano I, Ritossa C, Argiles JM, et al.
Leptin expression in colorectal and breast cancer patients. Int J Mol Med 2000;5:421-6.
13. Huang L, Li C. Leptin: a multifunctional hormone. Cell Res 2000;10:81-92.
14. Saxena NK, Taliaferro-Smith L, Knight BB, Merlin D, Anania FA, O’Regan RM, et al. Bidirectional crosstalk between leptin and insulin-like growth factor-I signaling promotes invasion and migration of breast cancer cells via transactivation of epidermal growth factor receptor. Cancer Res 2008;68:9712-22.
15. Garofalo C, Koda M, Cascio S, Sulkowska M, Kanczuga-Koda L, Go- laszewska J, et al. Increased expression of leptin and the leptin receptor as a marker of breast cancer progression: possible role of obesity-related stimuli. Clin Cancer Res 2006;12:1447-53.
16. Tartaglia LA, Dembski M, Weng X, Deng N, Culpepper J, Devos R, et al. Identification and expression cloning of a leptin receptor, OB-R. Cell 1995;83:1263-71.
17. Arita Y, Kihara S, Ouchi N, Takahashi M, Maeda K, Miyagawa J, et al.
Paradoxical decrease of an adipose-specific protein, adiponectin, in obe- sity. Biochem Biophys Res Commun 1999;257:79-83.
18. Miyoshi Y, Funahashi T, Kihara S, Taguchi T, Tamaki Y, Matsuzawa Y, et al. Association of serum adiponectin levels with breast cancer risk. Clin Cancer Res 2003;9:5699-704.
19. Mantzoros C, Petridou E, Dessypris N, Chavelas C, Dalamaga M, Alexe DM, et al. Adiponectin and breast cancer risk. J Clin Endocrinol Metab 2004;89:1102-7.
20. Yamauchi T, Nio Y, Maki T, Kobayashi M, Takazawa T, Iwabu M, et al.
Targeted disruption of AdipoR1 and AdipoR2 causes abrogation of adi- ponectin binding and metabolic actions. Nat Med 2007;13:332-9.
21. Taliaferro-Smith L, Nagalingam A, Zhong D, Zhou W, Saxena NK, Shar- ma D. LKB1 is required for adiponectin-mediated modulation of AMPK- S6K axis and inhibition of migration and invasion of breast cancer cells.
Oncogene 2009;28:2621-33.
22. McMurtry V, Simeone AM, Nieves-Alicea R, Tari AM. Leptin utilizes
Jun N-terminal kinases to stimulate the invasion of MCF-7 breast can- cer cells. Clin Exp Metastasis 2009;26:197-204.
23. Vona-Davis L, Rose DP. Adipokines as endocrine, paracrine, and auto- crine factors in breast cancer risk and progression. Endocr Relat Cancer 2007;14:189-206.
24. Gonzalez RR, Cherfils S, Escobar M, Yoo JH, Carino C, Styer AK, et al.
Leptin signaling promotes the growth of mammary tumors and increas- es the expression of vascular endothelial growth factor (VEGF) and its receptor type two (VEGF-R2). J Biol Chem 2006;281:26320-8.
25. Chen C, Chang YC, Liu CL, Chang KJ, Guo IC. Leptin-induced growth of human ZR-75-1 breast cancer cells is associated with up-regulation of cyclin D1 and c-Myc and down-regulation of tumor suppressor p53 and p21WAF1/CIP1. Breast Cancer Res Treat 2006;98:121-32.
26. Dos Santos E, Benaitreau D, Dieudonne MN, Leneveu MC, Serazin V,
Giudicelli Y, et al. Adiponectin mediates an antiproliferative response in human MDA-MB 231 breast cancer cells. Oncol Rep 2008;20:971-7.
27. Arditi JD, Venihaki M, Karalis KP, Chrousos GP. Antiproliferative effect of adiponectin on MCF7 breast cancer cells: a potential hormonal link between obesity and cancer. Horm Metab Res 2007;39:9-13.
28. Karaduman M, Bilici A, Ozet A, Sengul A, Musabak U, Alomeroglu M.
Tissue levels of adiponectin in breast cancer patients. Med Oncol 2007;
24:361-6.
29. Pfeiler G, Treeck O, Wenzel G, Goerse R, Hartmann A, Schmitz G, et al.
Influence of insulin resistance on adiponectin receptor expression in breast cancer. Maturitas 2009;63:253-6.
30. Hancke K, Grubeck D, Hauser N, Kreienberg R, Weiss JM. Adipocyte fatty acid-binding protein as a novel prognostic factor in obese breast cancer patients. Breast Cancer Res Treat 2010;119:367-77.