Corresponding author:
Mohammad Reza Namavar
Histomorphometry and Stereology Research Center, Shiraz University of Medical Sciences, P.O. Box 71345-1945, Shiraz, Iran
Tel: +98-7112304372, Fax: +98-7112304372, E-mail: namavarreza@yahoo.
com
Copyright © 2012. Anatomy & Cell Biology
Effects of high-fat diet on the numerical density and number of neuronal cells and the volume of the mouse hypothalamus: a stereological study
Mohammad Reza Namavar
1,2, Samira Raminfard
2, Zahra Vojdani Jahromi
2, Hassan Azari
21Histomorphometry and Stereology Research Center, Shiraz University of Medical Sciences, 2Department of Anatomical Sciences, School of Medicine, Shiraz University of Medical Sciences, Shiraz, Iran
Abstract: It has been demonstrated that the type of diet affects the brain structure and function. Consumption of fat-rich food is one of the most important factors that lead to increase in the prevalence of cardiovascular and neurological diseases.
High-fat diet may change the volume and neuronal number or density in the hypothalamus, which is the center of energy control. Therefore, this study was designed to study the effect of high-fat diet on the density and number of neurons, and also the volume of hypothalamus in adult male mice. Forty male mice were divided into the control and experimental groups. The control group were fed with standard and the experimental groups, with high-fat diet for 4 (short-term) or 8 (long-term) weeks.
The animals were perfused and brains were immediately removed, post-fixed and cut coronally and serially using cryostat at 30-µm thickness. Every 6th sections were stained by cresyl violet. The numerical density and number of neuron and the volume of hypothalamus were estimated by using unbiased stereological methods. Data analysis showed that both short and long time consumption of high-fat diet decreased the neuronal cell density of the hypothalamus. Interestingly, despite a decrease in the neuronal cell density, long time consumption of high-fat diet could significantly increase the volume of hypothalamus (P<0.05).
High fat diet decreased the neuronal cell density and increased the volume of the hypothalamus, but it did not significantly change its total neurons. These changes might be due to an increase in the extracellular space through inflammation or gliosis in the hypothalamus.
Key words: High-fat diet, Hypothalamus, Obesity, Stereology
Received April 9, 2012; 1st Revised June 20, 2012, 2nd Revised August 5, 2012; Accepted August 9, 2012
mass index (BMI) greater than 30 kg/m2 [2] that results from an imbalance between caloric intake and energy expenditure [3]. The prevalence of obesity in the majority of countries has increased in the last ten years [4]. This indicates that primary cause of obesity is related to the environmental, social and beha vioral changes, although genetic factors may also be involved [2, 5]. Consumption of dietary fats is amongst the most important environmental factors leading to obesity [4].
High-fat diets in rodents are generally considered to produce obesity, similar to that seen in humans. High-fat diets in the literatures are labeled such when fat composition is anywhere
Introduction
Obesity is a chronic disease consisting of the increase in body fat stores [1]. Obesity in humans is defined as a body
from 20-60% [2, 6].
Although the exact physiologic mechanisms, whereby obesity adversely affects the brain are poorly understood, both experimental and human studies have revealed that brain function is sensitive to inflammatory pathways and mediators [7]. More specifically, obesity is closely associated with a pat- tern of chronic inflammation, characterized by abnormal cytokine production, increased acute-phase reactants and other mediators, and activation of a network of inflammatory signaling pathways. Indeed, inflammatory markers correlate tightly with the degree of obesity and insulin resistance.
Inflammatory and innate immune responses are also activated by the increased levels of serum lipids, such as cholesterol and saturated long-chain fatty acids [3, 7-9].
Because, the hypothalamus is one of the most important centers that regulate the body weight, appetite and energy balance [10], many studies have been done regarding nutrition and hypothalamus. It is known that high-fat diet (HFD) can cause overweight by resulting from a leptin resistance of the hypothalamic cells [11]. A deficiency of leptin, or a resistance of the hypothalamus to the actions of leptin, results in obesity in rodents and humans [5, 12]. It has been established that the lesion of the ventromedial hypothalamus causes hyperphagia and obesity, and lesion of the lateral hypothalamus causes aphagia and even death by starvation [11].
Most of the studies concerning the effects of HFDs have been on molecular basis. As the hypothalamic nuclei are involved in the regulation of food intake, appetite control and energy balance [10, 13] and HFD may affect some or all of these nuclei, therefore, we decided to evaluate whether the consumption of high amounts of dietary fat can change the numerical density and neuron number, as well as the volume of hypothalamus.
Materials and Methods
This study was conducted to assess the differential effects of either short-term (4 weeks, experiment I) or long-term (8 weeks, experiment II) exposure of mice to a standard diet (control groups) or HFD (experimental groups). Male Bulb-C mice (30±3 g) were obtained from the Laboratory Animal House of Shiraz University of Medical Sciences (SUMS) at 6 weeks of age. Mice were housed in groups of two or three to acclimatize for two weeks prior to the study under 12-hour light/dark cycle, and were fed food and water ad libitum.
All procedures in this study were conducted based on the
guidelines of the Ethical Committee of SUMS.
Experimental design
All 8-week animals remained on the same diet throughout the study. The control diet, regular rodent chow, consisted mainly of protein, 15% of energy (kcal), fat (9%) and carbohydrates (76%). The HFD consisted primarily of protein (20%), fat (45%), and carbohydrates (35%) (D12451, Research Diets, New Brunswick, NJ, USA).
Twenty animals were used in experiment I and were placed in either the control or HFD groups for a period of 4 weeks.
Also, twenty animals were used in experiment II, which were maintained on either the control or HFD groups for a period of 8 weeks. Body weights and BMI were determined in the beginning and the end of the experiments.
Histological and stereological studies
After sampling of blood, mice were anesthetized and perfused transcardially with cold 0.09% saline, followed by 10% buffered formalin. Brains were immediately removed and post-fixed in the same fixative overnight at 4oC, transferred to 30% sucrose (Sigma, St. Louis, MO, USA) in a phosphate buffered saline for 48 hours; then frozen and stored at -20°C until further process.
The brains were sectioned serially and coronally, using a cryostat (SLEE, Frankfurt, Germany) at a thickness of 30 μm throughout the hypothalamus, and were immersed into a 12- well plate containing cryoprotectant solution and kept in a -20°C freezer, until needed.
Every 6th section (at interval of 180 μm) was a slide moun- ted and stained with cresyl violet.
The volume of the hypothalamus was unbiasedly esti- mated by the means of point counting method, using the Cavalieri’s principle [14, 15]. Briefly, a grid of points was laid over the image of section on the monitor of a computer and the points falling on the hypothalamus were counted. The final magnification was 4.5× for calculation. Volume of the hypothalamus (Vref) was determined by applying the following formula: Vref=d×t×a(p)×ΣP, where, d=0.18 mm; equal to the average distance from one section to the next. t=0.030 mm; section thickness, a(p)=0.10513 mm2; equal to the area associated with one point in the grid, ΣP=number of points hitting the section of the hypothalamus [16]. The precision of the estimates was expressed by the coefficient of error (CE).
We calculated the CE of our measurement, using the method by Gundersen et al. [17]. An average of 9 (±1) sections was
counted per brain. A total of approximately 132 (±7) points per brain were counted on all areas providing the mean CE on the estimates of total volume of 5.3%.
The numerical density and number of neurons were estimated in the hypothalamus, using the optical disector technique [14, 15]. Briefly, the optical disector setting consists of an Eclipse microscope (E200, Nikon, Tokyo, Japan) with a high-numerical-aperture (NA=1.25)×60 oil-immersion objective, connected to a video camera, which transmits the microscopic image to a monitor, and an electronic microcator with digital readout (MT12, Heidnehain, Traunreut, Ger- many) for measuring the movements in the Z-direction with 0.5-μm precision. A computer-generated counting frame is superimposed on the screen, using a stereology software system (Stereolite, SUMS, Shiraz, Iran). The neuronal density was defined, as follows: NV=∑Q/[∑P×a(f)×h], where ∑Q is the number of neurons counted within the sampling volume,
∑P is number of disector, a(f)=0.001369 mm2, is the area of the sampling frame, and h=0.015 mm, is the height of the disector. To estimate the total number of (N) neurons in the hypothalamus, the numerical density (NV) is multiplied by the volume of the hypothalamus or the reference volume (Vref) [15-17]. Neuronal nuclei were counted in approximately 9 (±1) sections, 77 (± 5) optical disectors and 475 (±40) neurons per hypothalamus in each animal providing the mean CE on the estimates of total number of 8%.
Cells were identified as neurons if they had a nucleolus, dendritic processes, euchromatin material within the nucleus, and nuclei surrounded by cytoplasm [18, 19]. This study is based on a systematic, uniform, random sampling that allows unbiased and efficient estimates of all parameters under study to be obtained.
Statistical analysis
Statistical significance was determined by a one-way ANOVA to compare the normal vs. HFD with respect to each other and to time. Data are expressed as the mean value
± standard error of the mean (SEM). Statistical analysis was performed using SPSS ver. 15.0 (SPSS Inc., Chicago, IL, USA).
A probability of less than 0.05 was considered to indicate a significant difference between the groups’ means.
Results
The animals were kept on the HFD or control diets for 4 (short-term) or 8 (long-term) weeks. Statistical analysis
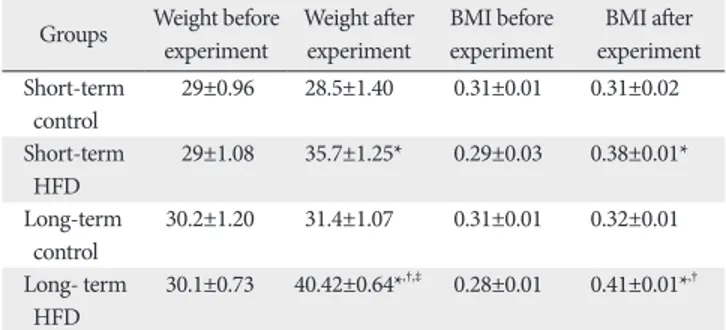
showed that short-term and long-term exposure to HFD significantly increased the weight and BMI in comparison with the control group (P<0.05). Also the long-term HFD group showed significant increase in the weight and BMI, when compared to the short-term HFD group (P<0.05) (Table 1).
At the end of the experiment, the long-term HFD group exhibited a significant elevated serum cholesterol level, when compared to the short-term (P=0.006) and the long-term (P=0.003) controls. In addition, low-density lipoprotein levels in the long-term HFD group were significantly elevated, in comparison to the control groups (P<0.05) (Table 2).
Although triglyceride decreased in both HFD groups, com- paring to the control groups, this decrease was not statistically significant (Table 2).
There was no significant difference between the volume of the right and left sides of the hypothalamus in all the control and experimental groups. In the short-term consumption of HFD, the volume of hypothalamus decreased in the right and left side, and total hypothalamus, although this decrease was not statistically significant (Table 3, Fig. 1). After long-lasting consumption of HFD, the volume significantly increased in all parts of the hypothalamus when compared to the long-term control (P=0.028) and the short-term HFD (P=0.023) groups (Fig. 1).
Table 3 and Fig. 2 shows that living for more 4 weeks in the control groups increased the numerical density of the neurons in the hypothalamus, but using HFD for more than 4 weeks decreased that parameter, although these changes were not significant. In addition, short-term HFD decreased the numerical density in both sides of the hypothalamus, although this decrease was not significant when compared with its control group (Table 3). After 8 weeks HFD, nume- rical density of the neurons significantly decreased when compared to the short-term (P<0.005) and the long-term (P<0.001) controls (Table 3, Fig. 2).
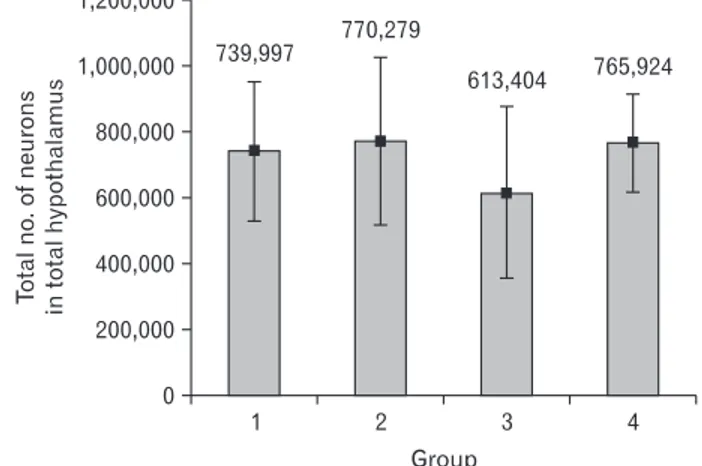
The total number of neurons decreased in short-term exposure to HFD, when compared with the control group, although this decrease was not statistically significant. De- crease in the number of neuron in long-term HFD was unre- markable. Living for more than 4 weeks in the control and HFD groups increased the total number of neurons, without significance (Table 3, Fig. 3).
Consumption of HFD showed an increase in the extracel- lular space (Fig. 4E-H) when it is compared to that of normal diet (Fig. 4A-D) [20], although from a statistical point of view,
it was not calculated.
Discussion
This is the first study, to our knowledge, evaluating the effects of HFD on the neuron density and number in the hypothalamus by using unbiased stereological techniques. We showed that long-term (i.e., 8 weeks) but not short-term (i.e., 4 weeks) exposure of adult male mice to HFD (containing 45 kcal% fat) increases the volume and decreases the numerical density of neurons in the hypothalamus.
Obesity has grown as one of the most important epide- miological problems in modern societies [5, 21]. Chronic con sumption of a HFD is a contributing factor to the advent of obesity in humans and in animal models [2].
The hypothalamus plays a major part in the regulation of the food intake, and destruction of distinct hypothalamic regions may induce hyperphagia or reduction in food intake [22]. Most of the previous studies about HFD effects have mainly concentrated on the cellular and molecular changes of the hypothalamus [3, 11, 22]. We designed to study the changes in the neuronal density and number and volume of
the hypothalamus. In this study, short and long-term use of HFD significantly increased the weight and BMI (Table 1).
This is in line with the previous studies [7, 10, 21, 23-26].
We showed that HFD increases the body weight even after 4 weeks. Results of many studies have shown that at least 12 days or longer are required before the body masses of a normal diet and HFD mice and rats diverge, even on a very high fat diet [2].
Blood assays in this study showed significant increase in LDL and cholesterol level (Table 2). It is similar with other studies [25, 27]. But, triglyceride in HFD groups decreased non-significantly in comparison with the control groups (Table 2). Although this is in contrast to the results by some studies [22, 25], Liu et al. [28] reported that after 10 weeks of consumption of HFD, triglyceride level was less than that of low fat diet.
Although volume of brain regions give rather unspecific information about the function of that region, it may indicate that structural changes of functional relevance take place in that specific area, and thus, encourages more detailed studies of selected areas of interest [29]. Volume of hypothalamus after 4 weeks consumption of HFD decreased about 10%, but it increased about 30% after 8 weeks (Table 3, Fig. 1). Few data on volume changes in the hypothalamus are available.
Few studies reported the volume of one or two nuclei in the
Table 1. Mean value±SEM of the weight (g) and body mass index (BMI) (g/cm2) of the mice fed with normal and high-fat diet (HFD) for short and long-term
Groups Weight before experiment
Weight after experiment
BMI before experiment
BMI after experiment Short-term
control
29±0.96 28.5±1.40 0.31±0.01 0.31±0.02
Short-term HFD
29±1.08 35.7±1.25* 0.29±0.03 0.38±0.01*
Long-term
control 30.2±1.20 31.4±1.07 0.31±0.01 0.32±0.01 Long- term
HFD 30.1±0.73 40.42±0.64*,†,‡ 0.28±0.01 0.41±0.01*,†
*Significant difference with short-term control group (P<0.05). †Significant difference with long-term control group (P<0.05). ‡Significant difference with short-term HFD group (P<0.05).
Table 2. Mean value±SEM of blood factors in the control and high-fat diet (HFD) groups in mice were fed with short- and long-term (mg/dl)
Groups Variable
Triglyceride Cholesterol LDL
Short-term control 199.33±21.07 177.67±4.33 63.67±14.90 Short-term HFD 152.75±14.70 162.5±2.60 80±1.70 Long-term control 174.34±10.72 150±12.09 64.67±5.36 Long-term HFD 173.50±23.40 211.75±15.80†,‡ 93.25±7.20*,†
*Significant difference with short-term control group (P<0.05). †Significant difference with long-term control group (P<0.05). ‡Significant difference with short-term HFD group (P<0.05).
Table 3. Mean value±SEM of numerical density and total number of neurons and volume of the right and left sides of hypothalamus in mice were fed with normal and high fat diet (HFD) for short and long-term
Groups Volume (mm3) Numerical density×105 (neuron/mm3) Neuron number×105
Right side Left side Right side Left side Right side Left side
Short-term control 1.18±0.12 1.16±0.12 3.06±0.08 3.23±0.07 3.63±0.39 3.76±0.42
Short-term HFD 1.09±0.13 1.06±0.10 2.80±0.05 2.83±0.17 3.08±0.44 3.03±0.39
Long-term control 1.13±0.12 1.10±0.12 3.37±0.02 3.45±0.04 3.85±0.42 3.84±0.47
Long-term HFD 1.48±0.07†,‡ 1.49±0.09*,†,‡ 2.58±0.15*,‡,§ 2.54±0.16*,§ 3.85±0.33 3.80±0.32
*Significant difference with short-term control group (P<0.05). †Significant difference with long-term control group (P<0.05). ‡Significant difference with short-term HFD group (P<0.05). §Significant difference with long-term control group (P<0.001).
hypothalamus [30]. Some studies indicated that an increase in BMI and obesity may be associated with changing the grey and white matter volume [7]. A few studies have reported that high-fat feeding induces the expression of several pro- inflammatory cytokines and inflammatory responsive proteins in the brain and hypothalamus [3, 7, 8, 31]. HFDs give rise to lower levels of the brain-derived neurotrophic factor in the brain that has direct anti-inflammatory effects in the brain [27]. Deletion of this factor in the hypothalamus
of adult mice also resulted in hyperphagic behavior and obesity [10, 13]. Therefore, increase of the volume in the hypothalamus in this present study may be due to an increase of inflammation by HFD. An increase in the extracellular space is evident in HFD group, in this study (Fig. 4). Short and long-term consumption of HFD decreases numerical density of neuron (about 10% and 20%, respectively), although this decrease was only significant in the long-term group (Table 3, Fig. 2). Similar to the volume, most of the neuronal density changes happened on the left side of the hypothalamus (Table 3, Figs. 1, 2). Reduction in the neuron density is explainable by the fact that neuron density is the number of neuron in a unit of volume and when the volume of hypothalamus has increased (Fig. 1), neuron density decreases, if the total number of neuron has not increased. Despite the reduction of neuron density, results of this study in Table 3 and Fig. 3 show that the total number of neurons in the hypothalamus of the HFD treated mice has not significantly changed. This increase in volume and decrease in neuronal density may indicate that HFD increased intercellular space by induction of inflammation or gliosis [7]. Fig. 4, in this study, also shows an increase in the intercellular space after consumption of HFD (Fig. 4E-H) when compared to that of normal diet (Fig.
4A-D), but inflammation may also be due to gliosis; therefore, specific studies are needed to clarify the inflammation and gliosis after using HFD.
Living for more than 4 weeks in the control and HFD groups increased the total number of neurons, without significance (Table 3, Fig. 3), which may show neurogenesis in adult mice hypothalamus, but it needs more specific Fig. 1. Mean value±SEM of volume of the total hypothalamus in mice
were fed with normal and high fat diet (HFD) for short and longterm (mm3). Group: 1, shortterm control; 2, longterm control; 3, short
term HFD; 4, longterm HFD. *Significant difference with shortterm control group (P<0.05). †Significant difference with longterm control group (P<0.05). ‡Significant difference with shortterm HFD group (P<0.05).
Fig. 3. Mean value±SEM of total number of neurons of the total hypo thalamus in mice were fed with normal and high fat diet (HFD) for short and longterm. Group: 1, shortterm control; 2, longterm control; 3, shortterm HFD; 4, longterm HFD.
Fig. 2. Mean value±SEM of numerical density of neuron (neuron/
mm3) in total hypothalamus of mice were fed with normal and high fat diet (HFD) for short and longterm. Group: 1, shortterm control; 2, longterm control; 3, shortterm HFD; 4, longterm HFD. *Significant difference with shortterm control group (P<0.005). †Significant difference with longterm control group (P<0.001).
experiments to be clarified.
Although HFD increases apoptosis in hypothalamus [3], non-significant reduction of the neuronal cells indicates that the decrease in neuron density is not an absolute result from apoptosis.
In summary, it can be concluded that long-term consump- tion of HFD decreases the numerical density of neurons and increases the volume of the hypothalamus, although the total number of neurons in the hypothalamus does not change significantly. These findings may indicate that the increase of hypothalamus volume maybe due to the inflammation and gliosis caused by HFD, which needs further investigation.
Acknowledgements
We thank Biotechnology Research Center of Shiraz Univer sity for using their cryostat. We also wish to thank Dr Noura Al Menhali from the University of United Arabic Emirates for her kind assistance in this project. The animals were provided and kept by Laboratory Animal House of the University. The research was done in Histomorphometry and Stereology Research Center, SUMS, Shiraz, Iran. The present article was extracted from thesis written by Samira Raminfard and financially supported by Shiraz University of Medical Sciences Grant No. 89-5129.
References
1. Formiguera X, Cantón A. Obesity: epidemiology and clinical aspects. Best Pract Res Clin Gastroenterol 2004;18:1125-46.
2. Townsend KL. Mechanisms of high fat induced-obesity in mice and premigration/prehibernation fattening in rats, in graduate school of arts and sciences. Boston: Boston University; 2008.
p.170-2.
3. Moraes JC, Coope A, Morari J, Cintra DE, Roman EA, Pauli JR, Romanatto T, Carvalheira JB, Oliveira AL, Saad MJ, Velloso LA.
High-fat diet induces apoptosis of hypothalamic neurons. PLoS One 2009;4:e5045.
4. Rada P, Bocarsly ME, Barson JR, Hoebel BG, Leibowitz SF.
Reduced accumbens dopamine in Sprague-Dawley rats prone to overeating a fat-rich diet. Physiol Behav 2010;101:394-400.
5. Cammisotto P, Bendayan M. A review on gastric leptin: the exocrine secretion of a gastric hormone. Anat Cell Biol 2012;45:
1-16.
6. Buettner R, Parhofer KG, Woenckhaus M, Wrede CE, Kunz- Schughart LA, Schölmerich J, Bollheimer LC. Defining high-fat- diet rat models: metabolic and molecular effects of different fat types. J Mol Endocrinol 2006;36:485-501.
7. Pistell PJ, Morrison CD, Gupta S, Knight AG, Keller JN, Ingram DK, Bruce-Keller AJ. Cognitive impairment following high fat diet consumption is associated with brain inflammation. J Neuroimmunol 2010;219:25-32.
8. De Souza CT, Araujo EP, Bordin S, Ashimine R, Zollner RL, Boschero AC, Saad MJ, Velloso LA. Consumption of a fat-rich diet activates a proinflammatory response and induces insulin resistance in the hypothalamus. Endocrinology 2005;146:4192-9.
9. Yi CO, Jeon BT, Shin HJ, Jeong EA, Chang KC, Lee JE, Lee DH, Kim HJ, Kang SS, Cho GJ, Choi WS, Roh GS. Resveratrol activates AMPK and suppresses LPS-induced NF-kappaB- Fig. 4. Cresyl violet staining of hypothalamus in normal (AD) and highfat (EH) diet treated mice. An increase in extracellualr space is evident in the hypothalamus of highfat diet treated mouse (EH, arrows). This figure represents the plate 49 in the mouse brain in stereotaxic coordinates [20].
3v, third ventricle; Arc, arcuate hypothalamic nucleus; dmh, dorsomedial hypothalamic nucleus; fr, fasciculus retroflexus; fx, fornix; me, median eminence; mt, mammillothalamic tract; vmh, ventromedial hypothalamic nucleus. Scale bars=400 μm (A, E), 200 μm (B, F), 100 μm (C, D, G, H).
dependent COX-2 activation in RAW 264.7 macrophage cells.
Anat Cell Biol 2011;44:194-203.
10. Wang C, Godar RJ, Billington CJ, Kotz CM. Chronic admini- stration of brain-derived neurotrophic factor in the hypothalamic paraventricular nucleus reverses obesity induced by high-fat diet. Am J Physiol Regul Integr Comp Physiol 2010;298:R1320- 32.
11. Sahu A. Leptin signaling in the hypothalamus: emphasis on energy homeostasis and leptin resistance. Front Neuroendocrinol 2003;24:225-53.
12. Townsend KL, Lorenzi MM, Widmaier EP. High-fat diet-induced changes in body mass and hypothalamic gene expression in wild-type and leptin-deficient mice. Endocrine 2008;33:176-88.
13. Unger TJ. Examination of deficits in energy balance and affective behavior following central or hypothalamic depletion of brain- derived neurotrophic factor. Boston: Sackler School of Graduate Biomedical Sciences (Tufts University); 2007. p.194.
14. Howard CV, Reed MG. Unbiased stereology: three-dimensional measurement in microscopy. Oxford: Bios Scientific Publisher;
1998.
15. Mouton PR. Principles and practices of unbiased stereology:
an introduction for bioscientists. Baltimore: Johns Hopkins University Press; 2002.
16. Abusaad I, MacKay D, Zhao J, Stanford P, Collier DA, Everall IP.
Stereological estimation of the total number of neurons in the murine hippocampus using the optical disector. J Comp Neurol 1999;408:560-6.
17. Gundersen HJ, Jensen EB, Kiêu K, Nielsen J. The efficiency of systematic sampling in stereology: reconsidered. J Microsc 1999;
193(Pt 3):199-211.
18. Benes FM, Vincent SL, Todtenkopf M. The density of pyramidal and nonpyramidal neurons in anterior cingulate cortex of schizophrenic and bipolar subjects. Biol Psychiatry 2001;50:395- 406.
19. Korbo L, Amrein I, Lipp HP, Wolfer D, Regeur L, Oster S, Pakkenberg B. No evidence for loss of hippocampal neurons in non-Alzheimer dementia patients. Acta Neurol Scand 2004;109:
132-9.
20. Paxinos G, Franklin KB. The mouse brain in stereotaxic coordi- nates. 2nd ed. San Diego: Academic Press; 2001.
21. De Souza CT, Pereira-da-Silva M, Araujo EP, Morari J, Alvarez- Rojas F, Bordin S, Moreira-Filho DC, Carvalheira JB, Saad MJ, Velloso LA. Distinct subsets of hypothalamic genes are modulated by two different thermogenesis-inducing stimuli.
Obesity (Silver Spring) 2008;16:1239-47.
22. Park ES, Yi SJ, Kim JS, Lee HS, Lee IS, Seong JK, Jin HK, Yoon YS. Changes in orexin-A and neuropeptide Y expression in the hypothalamus of the fasted and high-fat diet fed rats. J Vet Sci 2004;5:295-302.
23. Pirnik Z, Bundzikova J, Mikkelsen JD, Zelezna B, Maletinska L, Kiss A. Fos expression in hypocretinergic neurons in C57B1/6 male and female mice after long-term consumption of high fat diet. Endocr Regul 2008;42:137-46.
24. Hsuchou H, He Y, Kastin AJ, Tu H, Markadakis EN, Rogers RC, Fossier PB, Pan W. Obesity induces functional astrocytic leptin receptors in hypothalamus. Brain 2009;132(Pt 4):889-902.
25. Amin KA, Kamel HH, Abd Eltawab MA. The relation of high fat diet, metabolic disturbances and brain oxidative dysfunction:
modulation by hydroxy citric acid. Lipids Health Dis 2011;10:74.
26. Valladolid-Acebes I, Stucchi P, Cano V, Fernández-Alfonso MS, Merino B, Gil-Ortega M, Fole A, Morales L, Ruiz-Gayo M, Del Olmo N. High-fat diets impair spatial learning in the radial-arm maze in mice. Neurobiol Learn Mem 2011;95:80-5.
27. Granholm AC, Bimonte-Nelson HA, Moore AB, Nelson ME, Freeman LR, Sambamurti K. Effects of a saturated fat and high cholesterol diet on memory and hippocampal morphology in the middle-aged rat. J Alzheimers Dis 2008;14:133-45.
28. Liu M, Shen L, Liu Y, Woods SC, Seeley RJ, D'Alessio D, Tso P.
Obesity induced by a high-fat diet downregulates apolipoprotein A-IV gene expression in rat hypothalamus. Am J Physiol Endocrinol Metab 2004;287:E366-70.
29. Regeur L. Increasing loss of brain tissue with increasing demen- tia: a stereological study of post-mortem brains from elderly females. Eur J Neurol 2000;7:47-54.
30. Young JK. A comparison of hypothalami of rats and mice: lack of gross sexual dimorphism in the mouse. Brain Res 1982;239:233- 9.
31. Langdon KD, Clarke J, Corbett D. Long-term exposure to high fat diet is bad for your brain: exacerbation of focal ischemic brain injury. Neuroscience 2011;182:82-7.