J Korean Soc Radiol 2016;74(2):75-81 http://dx.doi.org/10.3348/jksr.2016.74.2.75
INTRODUCTION
Noninvasive measurements of subclinical atherosclerosis in- clude coronary artery calcification (CAC), intima-media thick- ness and plaque of the carotid artery, the ankle brachial index, and aortic pulse wave velocity. Both American and European guidelines recommend CAC as a tool for screening asymptom- atic individuals at intermediate risk for coronary heart disease (CHD) (1).
The Framingham risk score (FRS) is a multivariable statistical model that considers age, sex, smoking history, blood pressure, cholesterol, high-density lipoprotein (HDL) cholesterol, and blood glucose levels or history of diabetes to estimate coronary
event risk among individuals without CHD (2-4). Although coronary risk stratification is universally recommended, the current prediction models, including FRS, based on conven- tional CHD risk factors, have limitations in discriminating be- tween individuals who will or will not experience CHD. The search for new models to discriminate individuals who would benefit most from intensive primary prevention is a clinically important objective.
Studies in the United States have shown that CAC is a strong independent predictor of CHD in both sexes among middle- aged and elderly groups, various ethnic groups, and individuals with and without diabetes (1); in addition, CAC reportedly plays an important role in reclassifying individuals from intermediate
Relationship between Framingham Risk Score and Coronary Artery Calcium Score in Asymptomatic Korean Individuals
심혈관계 질환의 증상이 없는 한국인에서 Framingham Risk Score와 관상동맥석회화 수치의 관계
So Young Heo, MD, Noh-Hyuck Park, MD*, Chan-Sub Park, MD, Su Ok Seong, MD
Department of Radiology, Myongji Hospital, Seonam University College of Medicine, Goyang, Korea
Purpose: We explored the association between Framingham risk score (FRS) and coronary artery calcium score (CACS) in asymptomatic Korean individuals.
Materials and Methods: We retrospectively analyzed 2216 participants who un- derwent routine health screening and CACS using the 64-slice multidetector com- puted tomography between January 2010 and June 2014. Relationship between CACS and FRS, and factors associated with discrepancy between CACS and FRS were analyzed.
Results: CACS and FRS were positively correlated (p < 0.0001). However, in 3.7% of participants with low coronary event risk and high CACS, age, male gender, smoker, hypertension, total cholesterol, diabetes mellitus, and body mass index (BMI; ≥ 35) were associated with the discrepancy. In the diagnostic prediction model for dis- crepancy, the receiver operating characteristic curve including factors associated with FRS, diastolic blood pressure (≥ 75 mm Hg), diabetes mellitus, and BMI (≥ 35) showed that the area under the curve was 0.854 (95% confidence interval, 0.819– 0.890), indicating good sensitivity.
Conclusion: Diabetes mellitus or obesity (BMI ≥ 35) compensate for the weakness of FRS and may be potential indicators for application of CACS in asymptomatic Koreans with low coronary event risk.
Index terms
Coronary Artery Disease Vascular Calcification
Multidetector Computed Tomography
Received May 4, 2015 Revised July 14, 2015 Accepted September 18, 2015
*Corresponding author: Noh-Hyuck Park, MD Department of Radiology, Myongji Hospital, Seonam University College of Medicine, 55 Hwasu-ro 14beon-gil, Deogyang-gu, Goyang 10475, Korea.
Tel. 82-31-810-7164 Fax. 82-31-810-7171 E-mail: [email protected]
This is an Open Access article distributed under the terms of the Creative Commons Attribution Non-Commercial License (http://creativecommons.org/licenses/by-nc/3.0) which permits unrestricted non-commercial use, distri- bution, and reproduction in any medium, provided the original work is properly cited.
to high risk and improves risk prediction over and above FRS.
However, most of the studies and recommendation regarding CAC focuses on Western society. Large-scale studies of CAC in the Asian population have not yet been performed.
The primary objective of this study was to determine the degree to which FRS correlates with coronary artery calcium score (CACS) in asymptomatic Korean individuals. The second ob- jective was to assess the clinical characteristics associated with the discrepancy between FRS and CACS.
MATERIALS AND METHODS
Subjects
Our retrospective study included 2295 asymptomatic partici- pants aged from 30 to 80 years (1387 males and 908 females) who visited the Myongji Hospital (Goyang, Korea) between Jan- uary 2010 and June 2014 for comprehensive health screening.
All participants underwent medical examination and computed tomography (CT) for coronary artery calcium scoring. Partici- pants with a clinical history of angina, cardiovascular disease, and coronary revascularization were excluded by using a ques- tionnaire. After exclusion of 79 participants, 2216 asymptomatic participants (1346 males and 870 females) were included in the analysis.
Conventional Risk Factors
Conventional cardiovascular risk factors including hyperten- sion, diabetes, smoking history, family history of premature heart disease, and lipid profile were obtained.
Hypertension was defined as systolic blood pressure ≥ 140 mm Hg or diastolic blood pressure ≥ 90 mm Hg, or a history of physician-diagnosed hypertension and taking antihypertensive medication. Diabetes was defined as fasting glucose ≥ 126 mg/dL or a history of physician-diagnosed diabetes and taking antidia- betic medication.
Lipid profile, including low-density lipoprotein (LDL) cho- lesterol, HDL cholesterol, total cholesterol, and triglyceride (TG), was obtained.
Coronary Artery Calcium Scoring
CACS was assessed using 64-slice multidetector CT (GE Healthcare, LightSpeed VCT, Milwaukee, WI, USA) with tube
voltage of 120 kVp, 100 mAs, 0.63-mm slide thickness, and 0.4 sec CT gantry rotation time protocol.
CAC was defined as a hyperattenuating lesion above a thresh- old of 130 Hounsfield units with an area of at least 3 adjacent pixels. It was automatically quantified using CT calcium score analysis software using Smartscore, AW version 4.5 (GE Health- care, Milwaukee, WI, USA) according to the Agatston score.
For analysis purposes, we stratified the study population into the following 5 categories using the Agatston score: 0, 0 to < 10, 10 to < 100, 100 to < 400, and ≥ 400.
Framingham Risk Score
We calculated the 10-year absolute coronary risk using the Framingham equation including age, sex, smoking history, sys- tolic blood pressure, history of taking antihypertensive medica- tion, total cholesterol, and HDL cholesterol. Population was stratified into the following 5 categories according to the FRS: 0 to < 5, 5 to < 10, 10 to < 15, 15 to < 20, and ≥ 20.
Consistent Group and Inconsistent Group
We reclassified the participants into consistent and inconsis- tent groups for the data analysis. Participants with low coronary event risk (FRS < 10) and low CACS (CACS < 100) were desig- nated as the consistent group; and participants with low coro- nary event risk (FRS < 10) and high CACS (CACS ≥ 100) were designated as the inconsistent group.
Statistical Analysis
Data were expressed as mean ± standard deviation for con- tinuous variables, and frequencies and percentages for categori- cal variables. Two-sample t-test and one-way analysis of variance were performed to compare continuous variables, and chi-square test was performed to compare categorical variables among dif- ferent groups according to the CACS.
Spearman’s correlation coefficient was used to investigate the relationship between CACS and FRS. Logistic regression was used to determine the factors between the consistent and inconsistent groups. Calibration was assessed by the Hosmer-Lemeshow test and discrimination was assessed using a receiver operating char- acteristic (ROC) curve.
All statistical analyses were performed using SPSS, version 20.0, for Windows (SPSS Inc., Chicago, IL, USA). A p value of
< 0.05 was considered statistically significant.
Ethics Statement
The study protocol was approved by the Institutional Review Board (IRB) of Myongji Hospital (IRB No. 14-084). Informed consent was confirmed by the IRB.
RESULTS
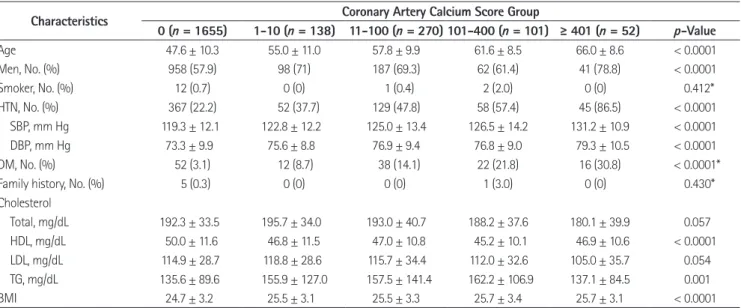
Of the 2295 participants with results of CT scan for CACS, 79 participants had missing risk factor data. Thus, the study in- cluded 2216 participants. Characteristics of these participants stratified by CACS groups were shown in Table 1.
Overall, the mean age (standard deviation) of the participants at the time of the CT scan was 50.3 (11.3) years and the propor- tion of male participants was 60.7%.
Among the risk factors included in the Framingham equa- tion, age, male gender, systolic blood pressure, and HDL cho- lesterol showed a significant correlation with CACS. Among the risk factors not included in the Framingham equation, hy- pertension, diastolic blood pressure, diabetes mellitus, TG, and body mass index (BMI) were significantly correlated with CACS.
A positive correlation was observed between CACS and FRS representing the 10-year absolute risk for a coronary event (Spearman’s correlation coefficient r = 0.464, p < 0.0001) (Fig. 1).
However, comparison between risk stratification by CACS and FRS showed a discrepancy, i.e., many cases had a low coronary event risk profile and a high CACS, and vice versa (Table 2). Of these, we analyzed factors explaining the discrepancy between CACS and FRS in about 3.7% of participants from the inconsis- Table 1. Baseline Characteristics Stratified by Coronary Artery Calcium Score
Characteristics Coronary Artery Calcium Score Group
0 (n = 1655) 1-10 (n = 138) 11-100 (n = 270) 101-400 (n = 101) ≥ 401 (n = 52) p-Value
Age 47.6 ± 10.3 55.0 ± 11.0 57.8 ± 9.9 61.6 ± 8.5 66.0 ± 8.6 < 0.0001
Men, No. (%) 958 (57.9) 98 (71) 187 (69.3) 62 (61.4) 41 (78.8) < 0.0001
Smoker, No. (%) 12 (0.7) 0 (0) 1 (0.4) 2 (2.0) 0 (0) 0.412*
HTN, No. (%) 367 (22.2) 52 (37.7) 129 (47.8) 58 (57.4) 45 (86.5) < 0.0001
SBP, mm Hg 119.3 ± 12.1 122.8 ± 12.2 125.0 ± 13.4 126.5 ± 14.2 131.2 ± 10.9 < 0.0001
DBP, mm Hg 73.3 ± 9.9 75.6 ± 8.8 76.9 ± 9.4 76.8 ± 9.0 79.3 ± 10.5 < 0.0001
DM, No. (%) 52 (3.1) 12 (8.7) 38 (14.1) 22 (21.8) 16 (30.8) < 0.0001*
Family history, No. (%) 5 (0.3) 0 (0) 0 (0) 1 (3.0) 0 (0) 0.430*
Cholesterol
Total, mg/dL 192.3 ± 33.5 195.7 ± 34.0 193.0 ± 40.7 188.2 ± 37.6 180.1 ± 39.9 0.057
HDL, mg/dL 50.0 ± 11.6 46.8 ± 11.5 47.0 ± 10.8 45.2 ± 10.1 46.9 ± 10.6 < 0.0001
LDL, mg/dL 114.9 ± 28.7 118.8 ± 28.6 115.7 ± 34.4 112.0 ± 32.6 105.0 ± 35.7 0.054
TG, mg/dL 135.6 ± 89.6 155.9 ± 127.0 157.5 ± 141.4 162.2 ± 106.9 137.1 ± 84.5 0.001
BMI 24.7 ± 3.2 25.5 ± 3.1 25.5 ± 3.3 25.7 ± 3.4 25.7 ± 3.1 < 0.0001
Plus-minus values are means ± standard deviation.
*The p value was calculated by Fisher’s exact test.
BMI = body mass index, DBP = diastolic blood pressure, DM = diabetes mellitus, HDL = high-density lipoprotein, HTN = hypertension, LDL = low-density lipoprotein, SBP = systolic blood pressure, TG = triglyceride
Fig. 1. Scatter plot shows a positive correlation between the coronary artery calcium score and the Framingham risk score in asymptomatic Korean individuals (Spearman’s correlation coefficient r = 0.464, p <
0.0001).
5000.00
4000.00
3000.00
2000.00
1000.00
0.00
Coronary artery calcium score
Framingham risk score Spearman's correlation coefficient r = 0.464 p < 0.0001
0.00 10.00 20.00 30.00 40.00
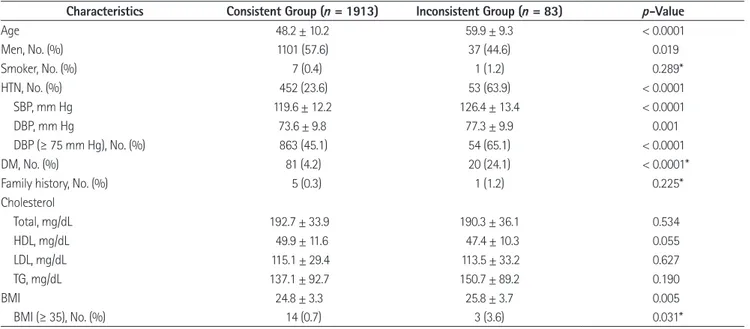
tent group [low coronary event risk (FRS < 10) and high CACS (CACS ≥ 100)], as compared to participants from the consis- tent group [low coronary event risk (FRS < 10) and low CACS (CACS < 100)]. Age, male gender, hypertension, systolic blood
pressure, diastolic blood pressure, diabetes mellitus, and BMI were significantly associated with the discrepancy, respectively (Table 3).
Age, male gender, smoker, presence of hypertension, total Table 2. Comparison between Risk Stratification by CACS and FRS
CACS FRS (10-Year Absolute Risk, %)
0 to 5 5 to 10 10 to 15 15 to 20 ≥ 20 Total
0 1371 213 49 14 8 1655
0 to < 10 77 39 14 5 3 138
10 to < 100 128 85 39 11 7 270
100 to < 400 32 32 23 8 6 101
≥ 400 6 13 19 7 7 52
CACS = coronary artery calcium score, FRS = Framingham risk score
Table 3. Factors Explaining the Discrepancy between the Consistent Group and the Inconsistent Group
Characteristics Consistent Group (n = 1913) Inconsistent Group (n = 83) p-Value
Age 48.2 ± 10.2 59.9 ± 9.3 < 0.0001
Men, No. (%) 1101 (57.6) 37 (44.6) 0.019
Smoker, No. (%) 7 (0.4) 1 (1.2) 0.289*
HTN, No. (%) 452 (23.6) 53 (63.9) < 0.0001
SBP, mm Hg 119.6 ± 12.2 126.4 ± 13.4 < 0.0001
DBP, mm Hg 73.6 ± 9.8 77.3 ± 9.9 0.001
DBP (≥ 75 mm Hg), No. (%) 863 (45.1) 54 (65.1) < 0.0001
DM, No. (%) 81 (4.2) 20 (24.1) < 0.0001*
Family history, No. (%) 5 (0.3) 1 (1.2) 0.225*
Cholesterol
Total, mg/dL 192.7 ± 33.9 190.3 ± 36.1 0.534
HDL, mg/dL 49.9 ± 11.6 47.4 ± 10.3 0.055
LDL, mg/dL 115.1 ± 29.4 113.5 ± 33.2 0.627
TG, mg/dL 137.1 ± 92.7 150.7 ± 89.2 0.190
BMI 24.8 ± 3.3 25.8 ± 3.7 0.005
BMI (≥ 35), No. (%) 14 (0.7) 3 (3.6) 0.031*
*The p value was calculated by Fisher’s exact test.
BMI = body mass index, DBP = diastolic blood pressure, DM = diabetes mellitus, HDL = high-density lipoprotein, HTN = hypertension, LDL = low-density lipoprotein, SBP = systolic blood pressure, TG = triglyceride
Table 4. Logistic Regression Analysis for Predictors of Discrepancy between Framingham Risk Score and Coronary Artery Calcium Score
β (95% CI) OR (95% CI) p-Value
Age 0.116 1.123 (1.087 to 1.160) < 0.0001
Men 0.709 2.032 (1.085 to 3.805) 0.027
Smoker 2.274 9.720 (1.055 to 89.589) 0.045
HTN 0.962 2.617 (1.524 to 4.495) < 0.0001
SBP 0.001 1.001 (0.977 to 1.026) 0.950
DBP (≥ 75 mm Hg) 0.474 1.606 (0.879 to 2.934) 0.124
DM 1.076 2.931 (1.577 to 5.448) 0.001
Total cholesterol 0.007 1.007 (1.000 to 1.015) 0.046
HDL cholesterol -0.016 0.985 (0.961 to 1.009) 0.206
BMI (≥ 35) 1.842 6.311 (1.478 to 26.951) 0.013
BMI = body mass index, CI = confidence interval, DBP = diastolic blood pressure, DM = diabetes mellitus, HDL = high-density lipoprotein, HTN = hypertension, OR = odds ratio, SBP = systolic blood pressure
cholesterol, diabetes mellitus, and BMI (≥ 35) were associated factors in the multivariable model (Table 4). Our final diagnos- tic prediction model for discrepancy between FRS and CACS included factors associated with FRS and additional factors in- cluding diastolic blood pressure (≥ 75 mm Hg), diabetes melli- tus, and BMI (≥ 35). In the ROC analysis, the area under the curve was 0.854 [95% confidence interval (CI), 0.819–0.890], which indicates good sensitivity and slightly improved results, as compared to the prediction model including only FRS-asso- ciated factors (area under the curve = 0.838, 95% CI = 0.801–
0.874) (Fig. 2).
DISCUSSION
The main findings of this study were as follows. 1) A signifi- cant positive correlation was observed between the CACS and the FRS in asymptomatic Korean individuals. 2) In the incon- sistent group, diabetes mellitus or obesity (BMI ≥ 35) were im- portant factors to compensate for the weakness of FRS, accord- ing to the diagnostic prediction model.
Currently, the approach for managing asymptomatic individ- uals who have a risk for CHD is based on traditional clinical
risk assessments such as the FRS or National Cholesterol Edu- cation Program guideline (2-4). However, there are limitations when these traditional risk assessment models are used to guide individual therapy and discriminate between individuals who will or will not experience CHD (5, 6).
CACS represents the total plaque burden; and plaque rupture is more likely to occur when the overall plaque burden is high (1, 7). Also, CACS is a strong predictor of coronary events in- dependent of conventional coronary risk factors or risk-factor scores (8-11). Occasionally, CACS fails to predict CHD events, which may be due to coronary artery spasm or high burden of noncalcified atherosclerotic plaques (12). Nevertheless, CACS has become a useful tool to treat and predict coronary artery disease in clinical practice, despite its questionable reliability due to lack of large population-based standard data, especially in Asia. Some studies have suggested that CAC differs among different ethnic groups (13, 14). Other studies have suggested that there are no racial differences in the prevalence and severi- ty of CAC (15).
In this study, we identified the association between conven- tional cardiovascular risk factors and CAC in asymptomatic Korean individuals. Park et al. (16) reported that male gender, older age, high blood pressure, HbA1C, and obesity are related to the presence of CAC in the asymptomatic Korean popula- tion. In our study, we obtained similar results, which suggested that CACS is also significantly correlated with age, male gender, diabetes mellitus, hypertension, systolic blood pressure, diastol- ic blood pressure, HDL cholesterol, and TG, and BMI. Howev- er, smoking, total cholesterol, LDL cholesterol, and family his- tory of premature heart disease were not correlated with CACS.
Previous studies have determined the degree to which FRS correlates with CACS in Korean individuals. Sung et al. (17) re- ported a significant positive correlation between the CACS and FRS; however, a large discrepancy between CACS and FRS was observed in older individuals (≥ 50 years) and in individuals with metabolic syndrome. Our study also showed a positive correlation between CACS and FRS (Spearman’s correlation coefficient r = 0.464, p < 0.0001). Of these, about 3.7% of par- ticipants showed discrepancy with low coronary event risk and high CACS.
The multivariable model used in our study indicated that fac- tors associated with FRS and additional factors including Fig. 2. Receiver operating characteristic curve for the coronary artery
calcium score prediction model included factors associated with Fram- ingham risk score (FRS) and additional factors including diastolic blood pressure (≥ 75 mm Hg), diabetes mellitus, and BMI (≥ 35). The area un- der the curve (AUC) was 0.854 (95% CI, 0.819–0.890), which indicates improved results, as compared to the prediction model including only FRS-associated factors (AUC = 0.838, 95% CI = 0.801–0.874).
BMI = body mass index, CI = confidence interval 1.0
0.8
0.6
0.4
0.2
0.0
Sensitivity
1-specificity
AUC = 0.854 (95% CI, 0.819–0.890)
0.0 0.2 0.4 0.6 0.8 1.0
diabetes mellitus and BMI (≥ 35) are possible associated factors for discrepancy. Our final diagnostic prediction model and the ROC analysis showed improvement of sensitivity, as compared to the prediction model including only FRS-associated factors.
This result suggested that individuals who have diabetes mellitus or obesity (BMI ≥ 35) might benefit from CACS using multide- tector CT for coronary risk evaluation even if they belong to the low risk group according to FRS.
Our study had some limitations. First, this was a cross-sec- tional study, and thus it does not provide the outcome data or prognosis in the population included. Second, findings of this study may not be applicable to other populations of different ethnicities. Third, although CACS is a strong independent pre- dictor of CHD, it is not a direct measure of atherosclerosis and it may have failed to detect some noncalcified plaques.
In conclusion, CACS and FRS showed a strong positive cor- relation in the asymptomatic Korean study population. Of these, about 3.7% of participants showed discrepancy between CACS and FRS and factors associated with the discrepancy included age, male gender, smoker, presence of hypertension, total cho- lesterol, diabetes mellitus, and BMI (≥ 35). According to our di- agnostic prediction model, diabetes mellitus or obesity (BMI ≥ 35) are potential indicators for application of CACS using mul- tidetector CT to compensate for the weakness of the FRS.
REFERENCES
1. Sekikawa A, Curb JD, Edmundowicz D, Okamura T, Choo J, Fujiyoshi A, et al. Coronary artery calcification by com- puted tomography in epidemiologic research and cardio- vascular disease prevention. J Epidemiol 2012;22:188-198 2. Expert Panel on Detection, Evaluation, and Treatment of
High Blood Cholesterol in Adults. Executive Summary of The Third Report of The National Cholesterol Education Program (NCEP) Expert Panel on Detection, Evaluation, And Treatment of High Blood Cholesterol In Adults (Adult Treatment Panel III). JAMA 2001;285:2486-2497
3. National Cholesterol Education Program (NCEP) Expert Panel on Detection, Evaluation, and Treatment of High Blood Cholesterol in Adults (Adult Treatment Panel III).
Third Report of the National Cholesterol Education Pro- gram (NCEP) Expert Panel on Detection, Evaluation, and
Treatment of High Blood Cholesterol in Adults (Adult Treatment Panel III) final report. Circulation 2002;106:3143- 3421
4. Grundy SM, Cleeman JI, Merz CN, Brewer HB Jr, Clark LT, Hunninghake DB, et al. Implications of recent clinical tri- als for the National Cholesterol Education Program Adult Treatment Panel III Guidelines. J Am Coll Cardiol 2004;44:
720-732
5. Johnson KM, Dowe DA, Brink JA. Traditional clinical risk assessment tools do not accurately predict coronary ath- erosclerotic plaque burden: a CT angiography study. AJR Am J Roentgenol 2009;192:235-243
6. Ha EJ, Kim Y, Cheung JY, Shim SS. Coronary artery disease in asymptomatic young adults: its prevalence according to coronary artery disease risk stratification and the CT char- acteristics. Korean J Radiol 2010;11:425-432
7. Hoshino T, Chow LA, Hsu JJ, Perlowski AA, Abedin M, Tobis J, et al. Mechanical stress analysis of a rigid inclusion in distensible material: a model of atherosclerotic calcification and plaque vulnerability. Am J Physiol Heart Circ Physiol 2009;297:H802-H810
8. Detrano R, Guerci AD, Carr JJ, Bild DE, Burke G, Folsom AR, et al. Coronary calcium as a predictor of coronary events in four racial or ethnic groups. N Engl J Med 2008;358:
1336-1345
9. Shaw LJ, Raggi P, Schisterman E, Berman DS, Callister TQ.
Prognostic value of cardiac risk factors and coronary ar- tery calcium screening for all-cause mortality. Radiology 2003;228:826-833
10. Wong ND, Hsu JC, Detrano RC, Diamond G, Eisenberg H, Gardin JM. Coronary artery calcium evaluation by electron beam computed tomography and its relation to new car- diovascular events. Am J Cardiol 2000;86:495-498
11. LaMonte MJ, FitzGerald SJ, Church TS, Barlow CE, Radford NB, Levine BD, et al. Coronary artery calcium score and coronary heart disease events in a large cohort of asymp- tomatic men and women. Am J Epidemiol 2005;162:421- 429
12. Yamamoto H, Kitagawa T, Ohashi N, Utsunomiya H, Kunita E, Oka T, et al. Noncalcified atherosclerotic lesions with vulnerable characteristics detected by coronary CT angi- ography and future coronary events. J Cardiovasc Comput
Tomogr 2013;7:192-199
13. Bild DE, Detrano R, Peterson D, Guerci A, Liu K, Shahar E, et al. Ethnic differences in coronary calcification: the Multi-Ethnic Study of Atherosclerosis (MESA). Circulation 2005;111:1313-1320
14. McClelland RL, Chung H, Detrano R, Post W, Kronmal RA.
Distribution of coronary artery calcium by race, gender, and age: results from the Multi-Ethnic Study of Athero- sclerosis (MESA). Circulation 2006;113:30-37
15. Bild DE, Folsom AR, Lowe LP, Sidney S, Kiefe C, Westfall AO, et al. Prevalence and correlates of coronary calcifica-
tion in black and white young adults: the Coronary Artery Risk Development in Young Adults (CARDIA) Study. Arte- rioscler Thromb Vasc Biol 2001;21:852-857
16. Park HE, Kim MK, Choi SY, Lee W, Shin CS, Cho SH, et al.
The prevalence and distribution of coronary artery calcium in asymptomatic Korean population. Int J Cardiovasc Im- aging 2012;28:1227-1235
17. Sung J, Lim SJ, Choe Y, Choi YH, Lee MK, Lee SH, et al.
Comparison of the coronary calcium score with the esti- mated coronary risk. Coron Artery Dis 2008;19:475-479
심혈관계 질환의 증상이 없는 한국인에서 Framingham Risk Score와 관상동맥석회화 수치의 관계
허소영 · 박노혁* · 박찬섭 · 성수옥
목적: 무증상 한국인을 대상으로 Framingham risk score (이하 FRS)와 관상동맥석회화 수치의 관계를 알아보았다.
대상과 방법: 2010년 1월부터 2014년 6월, 건강검진과 64채널 다중검출기 전산화단층촬영을 이용한 관상동맥석회화 검 사를 받은 2216명의 수진자를 대상으로 후향적 연구를 하였다. 관상동맥석회화 수치와 FRS의 관계 및 관상동맥석회화 수치와 FRS 간의 불일치와 관련된 인자들을 분석하였다.
결과: 관상동맥석회화 수치는 FRS와 양의 상관관계를 보였다(p < 0.0001). 심혈관계 질환 저위험군이지만 100 이상의 높은 관상동맥석회화 수치를 보인 3.7%의 수진자는 나이, 남성, 흡연, 고혈압, 총 콜레스테롤, 당뇨, 신체 비만 지수(body mass index; 이하 BMI; ≥ 35)와 연관성을 보였다. 불일치에 대한 진단예측모델의 수신기작동특성곡선(receiver operating characteristic curve)에서 FRS 관련 인자들과 이완기혈압(≥ 75 mm Hg), 당뇨, BMI (≥ 35)를 고려시 곡선하 면적(area under the curve) 값이 0.854(95% 신뢰구간, 0.819~0.890)로 높은 민감도를 보였다.
결론: 당뇨, 비만(BMI ≥ 35)은 FRS의 약점을 보완하는 인자로, 심혈관계 질환 저위험군인 무증상 한국인에서 관상동맥 석회화 검사의 잠재적인 적응증으로 기대한다.
서남대학교 의과대학 명지병원 영상의학과