Return-to-Work According to Impairment Type Among Occupationally Injured Workers in Korea
This study examined the association between return-to-work and impairment type.
Database of the Korea Workers’ Compensation and Welfare Service was used to identify disabled persons; and return-to-work information was obtained from the Korea Employment Information Services database. The study participants were 79,328 persons who received Workers’ compensation and who were confirmed as disabled during 2009- 2011. Logistic regression was used to analyze the association between return-to-work and impairment type, adjusted by age, sex, impairment severity, pre-injury businesses size, and pre-injury occupational category. Compared to injuries of the upper limbs, the odds ratio of return-to-work was 0.63 (95% CI, 0.60-0.65) for injuries involving the lower limbs, 0.62 (95% CI, 0.59-0.66) for the spine, 0.75 (95% CI, 0.66-0.86) for the eyes, 0.98 (95%
CI, 0.77-1.25) for the oral cavity, 0.44 (95% CI, 0.37-0.53) for the ears, 1.02 (95% CI, 0.83-1.25) for the figure, 0.75 (95% CI, 0.72-0.79) for pain, and 0.36 (95% CI, 0.32- 0.41) for neuropsychiatric impairment. These findings indicate that impairment type influences return-to-work rates.
Key Words: Return to Work; Disabled Persons; Occupational Injuries; Workers’
Compensation, Disability Jeongbae Rhie,1 Inchul Jeong,2
and Jong Uk Won2,3
1Department of Occupational and Environmental Medicine, Dankook University Medical Center, Cheonan; 2Institute for Occupational Health, and
3Department of Preventive Medicine, Yonsei University College of Medicine, Seoul, Korea Received: 29 July 2013
Accepted: 5 September 2013 Address for Correspondence:
Jong Uk Won, MD
Department of Preventive Medicine, Yonsei University College of Medicine, 50 Yonsei-ro, Seodaemun-gu, Seoul 120-752, Korea Tel: +82.2-2228-1872, Fax: +82.2-392-8622
E-mail: juwon@yuhs.ac
http://dx.doi.org/10.3346/jkms.2013.28.11.1581 • J Korean Med Sci 2013; 28: 1581-1586 Occupation & Environmental Medicine
INTRODUCTION
Korea provides cash compensation to occupationally injured workers as a part of worker’s compensation insurance. Interest in the return-to-work of occupationally injured workers has ris- en since 2001, and policy to promote their return-to-work has been in full scale since 2005 (1). Supported by various business- es led by the Korea Workers’ Compensation & Welfare Service, the return-to-work rate of occupationally injured workers in Korea showed marked increases to 49.9% in 2007 and 70.4% in 2011 (2). Although this rate increased rapidly within a short pe- riod, related studies, have been limited, focusing on demogra- phic characteristics, occupational injury-related characteristics, vocational rehabilitation, and correlation with business owners that influence return-to-work (1, 3-6).
Research in other countries has mostly focused on individual factors, such as the worker’s age, educational level, vocational characteristics, and psychosocial factors, or examined return- to-work programs or business owner factors. Most studies in- vestigated impairment severity as a factor influencing return- to-work (7-13).
However, impairment includes not only simple anatomical or functional problems but also limitations of activities or par- ticipation (14). The World Health Organization considers im- pairment to be a comprehensive notion including body func-
tion and structure, limitations of an individual’s participation in society or in an occupation, and environmental factors (15).
That is, impairment means that it limits social activities and in- fluences occupations.
The perspectives of different countries regarding impairment vary, and people accept even the same impairment differently;
thus, each country considers different limitations to occupa- tions and activities according to impairment (16). Reville et al.
(17) analyzed impairment assessment and income reduction in California and found that income reduction of the same im- pairment grade differed according to impairment type. Accord- ingly, California established standards to differently assess the disability rate according to impairment type. Korea took these standards as a benchmark for assessing the disability rate ac- cording to occupation and impairment type (18, 19).
Therefore, because impairment type influences occupation and future income, it is believed to influence return-to-work.
This article examines the effect of impairment type among oc- cupationally injured workers on their return-to-work.
MATERIALS AND METHODS Study participants
This study was conducted with 109,746 participants with im- pairment grades who received medical treatment due to occu-
pational injury during the 3 yr from January 1, 2009 to Decem- ber 31, 2011. The data on the subjects were acquired from the administrative data of the Korea Workers’ Compensation &
Welfare Service (KCOMWEL). Rehabilitation counselors in 55 KCOMWEL branches confirmed the status of return-to-work through the employment information acquired from the Korea Employment Information Services (KEIS) every December and from telephone interviews. This study analyzed the data.
We excluded from the study 20,655 persons who did not have clearly locatable injuries, 4,898 persons whose return-to-work could not be determined, and 4,072 persons without company information before injuries. We also excluded 140 persons with pneumoconiosis, 87 with oral function impairment, 118 with nasal function impairment, and 82 with bony deformity. Fur- thermore, 365 with multiple organ injury were excluded. Thus, ultimately, 79,328 persons participated in this study.
Variables
Return-to-work was classified for investigation into four types:
“return to former work”, “work at a new firm”, “self-employment”, and “unemployment”. The first three categories were defined as completion of return-to-work, and “unemployment” as incom- pletion of return-to-work. The impairment grades and impair- ment types were decided by a physician according to the Kore- an Workers’ Compensation Act guidelines. The impairment classification has 14 grades, with the severest impairment as grade 1, and the slightest as grade 14. This article reclassified impairment severity into 4 groups: severe (grades 1-3), moder- ately severe (grades 4-7), moderate (grades 8-10), and mild (gra- des 11-14).
The Korean Workers’ Compensation Act guidelines classify 26 types of impairment according to affected body parts and physiologic functions; however, this article reclassified the im- pairment types into 9 groups. Upper limbs, lower limbs, and spine disabilities were included as anatomical and functional disabilities. Arm and finger disabilities were included with up- per limb impairments; and leg and foot disabilities were includ- ed with lower limb impairments. Eyes and ears disabilities in- cluded only visual and hearing impairments, respectively. Eye- lid, auricle, and outside nose disabilities and scars were reclas- sified as figure impairments. Pain disorders, which most often are neuropsychiatric impairments, were classified separately.
Oral cavity disorder included tooth disorders. We excluded masticatory disorder, speaking disorder, nasal function disor- der, body deformity, pneumoconiosis, and thoracoabdominal disorder because they were difficult to combine with other dis- orders, and because they have low frequency.
The pre-injury business size was classified into businesses with fewer than 30 workers, between 30 and 49, between 50 and 99, and over 100. The pre-injury occupational category was lar- gely classified into white collar, blue collar, and service workers.
Data analysis
We performed chi-square tests to examine the factors that in- fluence return-to-work, return-to-work according to impair- ment type, and characteristics that distinguish impairment grades. To investigate the characteristics of return-to-work ac- cording to impairment type, we performed logistic regression adjusted by age, sex, impairment grade, pre-injury business size, and pre-injury occupational category. Logistic regression was used to analyze the association between the level of return- to-work, “return to former work”, “work at a new firm”, and “self- employment”, and impairment type, adjusted by age, sex, im- pairment severity, pre-injury businesses size, and pre-injury occupational category. We chose a confidence level of 95% and a statistical significance level of 0.05. Examining for multicolin- earity of independent variables, we found the variance inflation factor (VIF) to be less than 10, indicating that there was no mul- ticolinearity. Statistical analyses were performed with SAS soft- ware (20).
Ethics statement
This study was approved by the institutional review board of human research of Yonsei University (Approval No. 4-2013-0365).
Informed consent was waived by the board.
RESULTS
The sample consisted of 67,182 males (84.7%) and 12,146 fe- males (15.3%), and the average age was 47.6 yr (SD, 11.4 yr).
The mild impairment group was the largest with 60,128 partici- pants, and the most common impairment type was upper limbs impairment, which affected 31,292 participants (39.5%). In case of the pre-injury business size, businesses with fewer than 30 workers were the most as 54,363 (68.5%). The most participants were blue collar workers as 63,583 (80.2%). The number of par- ticipants who returned to work was 55,154 (69.5%); and those who did not were 24,174 (30.5%).
With respect to the rate of return-to-work by age, workers in their 30s and 40s had the highest return-to-work rate (79.3%) and those in their 60s or older had the lowest (52.0%). In gener- al, the rate of return-to-work decreased with age (P < 0.001).
The rate of return-to-work in male was 71.2%, which was higher than the rate in female (60.5%) (P < 0.001). For the rate of re- turn-to-work according to impairment type, figure impairments showed the highest rate of 78.0%, and neuropsychiatric impair- ments showed the lowest at 30.3% (P < 0.001). For the rate of return-to-work according to impairment grade, the mild group (grades 11-14) had the highest rate at 72.4%; and the severe group (grades 1-3) had the lowest at 16.8% (P < 0.001). As a whole, return-to-work decreased with severity of impairment.
Pre-injury business size of over 100 workers had 72.8% of re- turn-to-work, while those with less than 30 workers showed
68.2% (P < 0.001). Regarding pre-injury occupational category, white collar workers showed the highest rate of return-to-work at 80.1%, and service workers showed the lowest at 64.0% (Table 1; P < 0.001).
For impairments of the upper and lower limbs and eyes, the mild group (grades 11-14) showed the highest rate of return-to- work; and the severe group (grades 1-3) showed the lowest (P <
0.001). For spine injuries, the moderately severe group (grades 4-7) showed the highest rate of return-to-work at 72.2%, but the sample size was small. Therefore, except for the group, the mild group showed the highest rate of return-to-work. For injuries of the oral cavity, ears, and figure, there were no statistically signif- icant differences in return-to-work rates between the impair- ment grades. For neuropsychiatric impairment, the moderate group (grades 8-10) showed the highest rate of return-to-work at 46.4%, and the severe group (grades 1-3) was the lowest at 16.9% (P < 0.001). For upper and lower limb, eyes, and neuro- psychiatric impairments, the rate of return-to-work decreased with the severity grade. For injuries to the oral cavity, ears, and figure, there were no statistically significant differences in return-
to-work rates between the impairment severity grades (Table 2).
Logistic regression was used to analyze the association be- tween return to work and impairment type, adjusted by age, sex, impairment severity, pre-injury businesses size, and pre- injury occupational category. Compared to injuries of the up- per limbs, the odds ratio of return to work was 0.63 (95% CI, 0.60- 0.65) for injuries involving the lower limbs, 0.62 (95% CI, 0.59- 0.66) for the spine, 0.75 (95% CI, 0.66-0.86) for the eyes, 0.44 (95%
CI, 0.37-0.53) for the ears, 0.75 (95% CI, 0.72-0.79) for pain, and 0.36 (95% CI, 0.32-0.41) for neuropsychiatric impairment which were statistically significant (Table 3).
Logistic regression was used to analyze the association be- tween the level of return-to-work, “return to former work”, “work at a new firm”, and “self-employment”, and impairment type, adjusted by age, sex, impairment severity, pre-injury business- es size, and pre-injury occupational category. In case of return to former work, compared to injuries of the upper limbs, the odds ratio was 0.65 (95% CI, 0.62-0.68) for injuries involving the lower limbs, 0.64 (95% CI, 0.61-0.67) for the spine, 0.67 (95% CI, 0.59-0.76) for the eyes, 0.67 (95% CI, 0.54-0.83) for the oral cavi- ty, 0.29 (95% CI, 0.23-0.36) for the ears, 0.76 (95% CI, 0.64-0.91) for the figure, 0.62 (95% CI, 0.60-0.65) for pain, and 0.38 (95%
CI, 0.33-0.43) for neuropsychiatric impairment which were sta- tistically significant.
In case of work at a new firm, compared to injuries of the up- per limbs, the odds ratio was 0.77 (95% CI, 0.65-0.91) for involv- ing neuropsychiatric impairment, 1.49 (95% CI, 1.20-1.84) for the oral cavity, 1.51 (95% CI, 1.24-1.85) for the ears, 1.28 (95%
CI, 1.06-1.54) for the figure, and 1.26 (95% CI, 1.21-1.32) for pain which were statistically significant. However, lower limbs, spine, and eyes impairment had no statistical significance.
In case of self-employment, compared to injuries of the up- per limbs, the odds ratio was 1.23 (95% CI, 1.11-1.35) for inju- ries involving the lower limbs, 1.38 (95% CI, 1.23-1.54) for the spine, 1.40 (95% CI, 1.07-1.82) for the eyes, and 1.17 (95% CI, 1.06-1.29) for pain which were statistically significant. Oral cav- ity, ears, figure, and neuropsychiatric impairment had no statis- tical significance (Table 4).
DISCUSSION
Various factors are related to the return-to-work of occupation- ally injured workers. Among them, physical impairment is very important factors. Prior studies on impairment and return-to- work have emphasized impairment in specific parts as well as severity of impairment (7, 21-24). He et al. (23) found that not only severity of impairment but also the locations and causes of impairment had important effects on return-to-work. However, Chang et al. (25) reported that, even if impairment severity are the same in upper limbs, they showed differences in return-to- work according to impairment types. Therefore, it was found Table 1. General characteristics of study participants by return-to-work status
Parameters Return-to-work
P value*
Yes (%) No (%)
Age (yr)
< 30 30-40 40-50 50-60
≥ 60
4,055 11,085 17,279 16,510 6,225
(73.2) (79.3) (74.0) (67.4) (52.0)
1,483 2,889 6,068 7,997 5,737
(26.8) (20.7) (26.0) (32.6) (48.0)
< 0.001
Sex Male Female
47,807 7,347
(71.2) (60.5)
19,375 4,799
(28.8) (39.5)
< 0.001 Impairment type
Upper limbs Lower limbs Spine Eyes Oral cavity Ears Figure Pain
Neuropsychiatric
23,378 10,420 6,071 774 298 267 437 12,718 791
(74.7) (65.9) (65.3) (67.2) (77.0) (54.1) (78.0) (71.7) (30.3)
7,914 5,386 3,223 378 89 227 123 5,010 1,824
(25.3) (34.1) (34.7) (32.8) (23.0) (45.9) (22.0) (28.3) (69.7)
< 0.001
Impairment severity Grades 1-3 4-7 8-10 11-14
233 868 10,524 43,529
(16.8) (48.6) (65.7) (72.4)
1,151 918 5,506 16,599
(83.2) (51.4) (34.3) (27.6)
< 0.001
Size of business
< 30 workers 30-49 50-99 100 ≤
37,087 4,189 3,990 9,888
(68.2) (72.4) (71.2) (72.8)
17,276 1,596 1,615 3,687
(31.8) (27.6) (28.8) (27.2)
< 0.001
Work type
White collar workers Blue collar workers Service workers
9,169 43,235 2,750
(80.1) (68.0) (64.0)
2,277 20,348 1,549
(19.9) (32.0) (36.0)
< 0.001
*Analyses were done by using chi-square tests.
Table 2. Relationship between return-to-work status and impairment severity by impairment types Impairment/
Return to work status
Impairment severity
P value*
Severe (%) Moderately severe (%) Moderate (%) Mild (%)
Upper limbs Yes
No 4
5(44.4)
(55.6) 479
283(62.6)
(37.4) 6,154
2,387(72.1)
(27.9) 16,747
5,239(76.2)
(23.8) < 0.001 Lower limbs
Yes
No 44
237(15.7)
(84.3) 70
72(49.3)
(50.7) 2,701
1,793(60.1)
(39.9) 7,605
3,284(69.8)
(30.2) < 0.001 Spine
Yes
No 0
0(0.0)
(0.0) 13
5(72.2)
(27.8) 720
584(55.2)
(44.8) 5,338
2,634(67.0)
(33.0) < 0.001 Eyes
Yes
No 2
10(16.7)
(83.3) 10
9(52.6)
(47.4) 477
262(64.6)
(35.4) 285
97(74.6)
(25.4) < 0.001 Oral cavity
Yes
No 0
0(0.0)
(0.0) 0
0(0.0)
(0.0) 15
5(71.4)
(28.6) 283
83(77.3)
(22.7) 0.594†
Ears Yes
No 0
0(0.0)
(0.0) 18
12(60.0)
(40.0) 93
75(55.4)
(44.6) 156
140(52.7)
(47.3) 0.684
Figure Yes
No 0
0(0.0)
(0.0) 15
3(83.3)
(16.7) 25
8(75.8)
(24.2) 397
112(78.0)
(22.0) 0.821
Pain Yes
No 0
0(0.0)
(0.0) 0
0(0.0)
(0.0) 0
0(0.0)
(0.0) 12,718
5,010(71.7) (28.3) Neuropsychiatric
Yes No
183 899
(16.9) (83.1)
269 534
(33.5) (66.5)
339 391
(46.4) (53.6)
0 0
(0.0) (0.0)
< 0.001
*Analyses were done by using chi-square tests; †Fisher’s exact test.
Table 3. Adjusted odds ratio from logistic regression model relating impairment types and return-to-work
Impaired organ OR* 95% CI
Upper limbs (reference) 1
Lower limbs 0.63 0.60-0.65
Spine 0.62 0.59-0.66
Eyes 0.75 0.66-0.86
Oral cavity 0.98 0.77-1.25
Ears 0.44 0.37-0.53
Figure 1.02 0.83-1.25
Pain 0.75 0.72-0.79
Neuropsychiatric 0.36 0.32-0.41
*Adjusted by age, sex, impairment severity, pre-injury businesses size, and pre-injury occupational category.
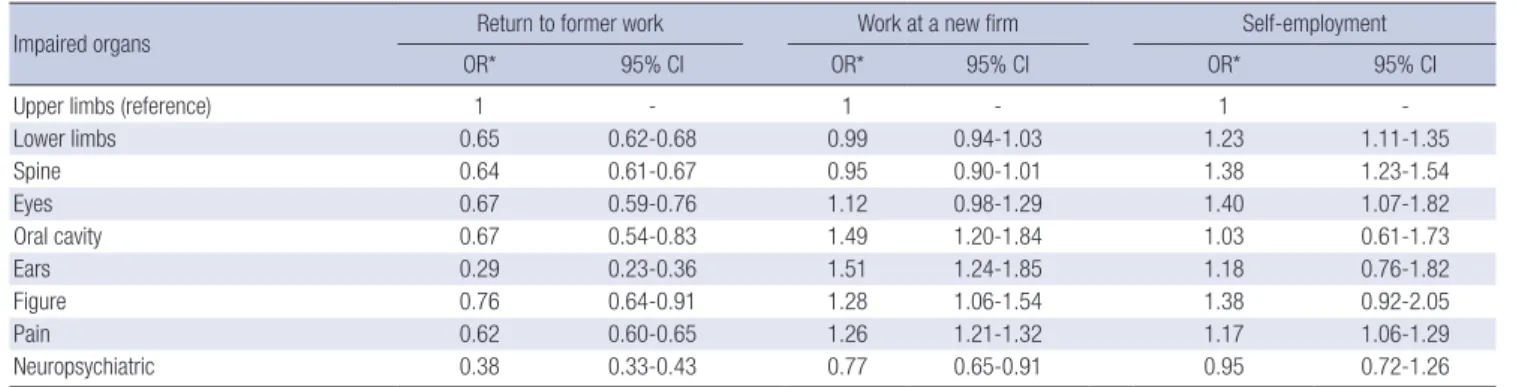
Table 4. Adjusted odds ratio from logistic regression model relating impairment types and return-to-work subgroups
Impaired organs Return to former work Work at a new firm Self-employment
OR* 95% CI OR* 95% CI OR* 95% CI
Upper limbs (reference) 1 - 1 - 1 -
Lower limbs 0.65 0.62-0.68 0.99 0.94-1.03 1.23 1.11-1.35
Spine 0.64 0.61-0.67 0.95 0.90-1.01 1.38 1.23-1.54
Eyes 0.67 0.59-0.76 1.12 0.98-1.29 1.40 1.07-1.82
Oral cavity 0.67 0.54-0.83 1.49 1.20-1.84 1.03 0.61-1.73
Ears 0.29 0.23-0.36 1.51 1.24-1.85 1.18 0.76-1.82
Figure 0.76 0.64-0.91 1.28 1.06-1.54 1.38 0.92-2.05
Pain 0.62 0.60-0.65 1.26 1.21-1.32 1.17 1.06-1.29
Neuropsychiatric 0.38 0.33-0.43 0.77 0.65-0.91 0.95 0.72-1.26
*Adjusted by age, sex, impairment severity, pre-injury businesses size, and pre-injury occupational category.
that not only severity of impairment but also impairment type play important roles in return-to-work.
The study results showed statistical significance relative to upper limb impairment, of the lower ORs for involving the spine, eyes, ears, pain, and neuropsychiatric impairment on return- to-work. On the other hand, results for oral cavity and figure impairments had no statistical significance.
It is believed that general opinions in Korea about impairment are reflected in the results. Differing from expert opinion, people in the general public tend to think that upper limb impairment is less serious than lower limb impairment, and that impair- ments of the eyes, ears, mental ability, intellect, or spine are
more serious (26). Experts in impairment evaluation consider arm function to be 60% and leg function to be 40% of the whole body functioning (14, 27). However, Korean people commonly believe that leg function equally or more important than arm function (26). In Korea, because social conditions such as trans- portation, road conditions, and building structures are unfavor- able for the disabled, impairment related to walking and move- ment is regarded to be most important. Therefore, we suggest that impairments involving the lower limbs, spine, or eyes lead to the greatest difficulties in finding jobs and returning to work because they are commonly considered to be more serious.
When return-to-work is classified into return to the former work, work at a new firm, and self-employment to examine the return-to-work ORs according to impairment types, we found that impairments of the lower limbs, spine, and eyes had a low- er rate of return to the former work (OR 0.64-0.67), but a higher rate of self-employment (OR 1.23-1.40), compared to upper limbs impairment. We believe that this difference shows that the difficulty arises in finding a job in compliance with an indi- vidual’s personal situation rather than from a problem with re- turn-to-work due to objective functional impairment.
In Korea, pain disorder had only one impairment grade, mild.
The number in this group of injured workers was next highest after the group with upper limb impairment. The return-to-work OR for impairment due to pain was lower than that of upper limb impairment, which we believe is not because pain disor- der restrict physical function but because of avoidance of return to the original work, based on the worker’s subjective judgment.
That is, pain disorder, compared to upper limb impairment, showed undesirable to return to the former work (OR 0.62) but desirable to work at a new firm (OR 1.26) and to have self-em- ployment (OR 1.17). Therefore, it appears that pain disorder of- ten activates a subjective avoidance of the former work. In fact, pain disorder is viewed not as clear impairment but as feigned illness (28).
In this study, neuropsychiatric impairment had lower OR for the return-to-work compared to upper limb impairment. Spe- cifically, we found that return to the former work (OR, 0.38) and work at a new firm (OR, 0.77) were lower, and self-employment (OR, 0.95) was similar, to that of upper limb impairment. In the study cases of neuropsychiatric impairment, impairment grades ranged from severe to moderate, and return-to-work rate for each grade is low. Thus, it is assumed that the reason for not re- turning to work is health restrictions. In fact, health was the rea- son given for unemployment by 87.1% of participants with neu- rological disorder who did not return-to-work.
For impairments of the ears, compared to upper limbs im- pairment, the return-to-work OR was low. Specifically, return to the former work was lower (OR, 0.29), work at a new firm was higher (OR, 1.51), and self-employment (OR, 1.18) was similar to that of upper limb impairment. Ears impairment differed
from other disabilities in that the exposure period of the harm- ful factor (noise) increased impairment levels with increasing age. It appears that the work environment of the former work influenced the severity of the impairment. This suggests that these participants preferred to work in another place with less noise exposure.
Results showed that participants with impairments of the lower limbs, spine, and eyes and related to moving the body were more likely to become self-employed; workers with im- pairments of the oral cavity and figure were most likely to work at a new firm; those with pain disorder tended to return-to-work at a new firm or to become self-employed; those with serious neuropsychiatric impairment mainly found self-employment;
and those with ears impairment usually returned to work at a new firm.
It is significant that return-to-work ORs according to these impairment types were statistically significant even after adjust- ing pre-injury occupational categories. Because the return-to- work rates of blue collar and service workers, who do manual labor, were lower than for white collar workers.
These findings indicate that impairment type influences re- turn-to-work rates. The different views of experts versus the ge- neral public about impairment, impairment severity, and im- pairment type are likely to affect return-to-work.
This study minimized the effects of selection bias that may have been created by utilizing the national institution’s data through overall inspections of the return-to-work of occupa- tionally injured workers. In addition, because this study was not based on a questionnaire about impairment types and levels but was instead based on evaluations by doctors, these have high accuracy. However, because this study concentrated on people who were recognized as occupationally injured workers and given impairment grades, it has the limitation that it did not include the disabled who were not recognized as occupa- tionally injured workers.
In conclusion, the study findings indicate that, in addition to individual characteristics and socioeconomic factors, the im- pairment severity, type, and patterns should be seriously con- sidered in the planning by businesses and others to help injured workers return-to-work, such as via vocational rehabilitation.
ACKNOWLEDGMENTS
The authors would like to thank Korean Workers’ Compensa- tion & Welfare Service, especially Workers’ Compensation Re- habilitation Bureau for data collection and approving use of those data.
DISCLOSURE
The authors have no conflicts of interest to disclose.
REFERENCES
1. Park SK. Associations of demographic and injury-related factors with re- turn to work among job-injured workers with disabilities in South Ko- rea. J Rehabil Med 2012; 44: 473-6.
2. Ministry of Employment and Labor. 2011 Worker’s Compensation In- surance business performance. Gwacheon: Ministry of Employment and Labor, 2012.
3. Park SK, Ahn CM. Predictors of job retention among workers’ compen- sation clients in South Korea. Soc Welf Policy 2006; 26: 177-94.
4. Lee SY. A study on labor mobility among injured workers. Seoul: Korea Labor Institute, 2005.
5. Lee SW, Kim JK, Kim TY. A study on return to work among job injured workers with rehabilities. Seoul: Korea Workers’ Compensation & Wel- fare Service Research Center, 2008.
6. Lee SW. A study on employer related factors affecting return to prejob among occupational injured workers. Seoul: Korea Workers’ Compensa- tion & Welfare Services Research Center, 2008.
7. Tate DG. Workers’ disability and return to work. Am J Phys Med Rehabil 1992; 71: 92-6.
8. Shrey DE. Worksite disability management model for effective return-to- work planning. Occup Med 2000; 15: 789-801.
9. Shaw W, Hong QN, Pransky G, Loisel P. A literature review describing the role of return-to-work coordinators in trial programs and interven- tions designed to prevent workplace disability. J Occup Rehabil 2008; 18:
2-15.
10. Schultz IZ, Crook J, Berkowitz J, Milner R, Meloche GR. Predicting re- turn to work after low back injury using the Psychosocial Risk for Occu- pational Disability Instrument: a validation study. J Occup Rehabil 2005;
15: 365-76.
11. Krause N, Dasinger LK, Deegan LJ, Rudolph L, Brand RJ. Psychosocial job factors and return-to-work after compensated low back injury: a dis- ability phase-specific analysis. Am J Ind Med 2001; 40: 374-92.
12. Berecki-Gisolf J, Clay FJ, Collie A, McClure RJ. The impact of aging on work disability and return to work: insights from workers’ compensa- tion claim records. J Occup Environ Med 2012; 54: 318-27.
13. Seyedmehdi M, Attarchi M, Ghaffari M, Mohammadi S, Darnahal M, Sadeghi Z. Prognostic factors for return to work after low-back disc her- niation surgery. Asia Pac J Public Health 2013. doi: 10.1177/1010539512 471072.
14. Rondinelli RD, Genovese E, Katz R, Mayer T, Mueller K, Ranavaya M, Brigham CR. Guides to the evaluation of permanent impairment. 6th ed. Chicago: American Medical Association, 2008.
15. World Health Organization. Intetnational classification of functioning, disability and health. Geneva: World Health Organization, 2001.
16. Patel B, Buschbacher R, Crawford J. National variability in permanent partial impairment ratings. Am J Phys Med Rehabil 2003; 82: 302-6.
17. Reville RT, Seabury SA, Neuhauser FW, Burton JF Jr, Greenberg MD.
An Evaluation of California’s Permanent Disability Rating System. San- ta Monica: RAND Corporation, 2005.
18. Schedule for rating permanent disabilities under provisions of the la- bor code of the state of california. Available at http://www.dir.ca.gov/
dwc/PDR.pdf [accessed on 26 June 2013].
19. Won JU, Yu JY, Kwon YJ, Kim Y, Rhie JB, Jeong IC. A new disability rat- ing method according to the job using the Korean Academy of Medical Science disability guideline. J Korean Med Sci 2012; 27: 1453-9.
20. SAS Institute. The SAS system for Windows: release 9.2. Cary: SAS Insti- tute, 2008.
21. Seland K, Cherry N, Beach J. A study of factors influencing return to work after wrist or ankle fractures. Am J Ind Med 2006; 49: 197-203.
22. Lee YY, Chang JH, Shieh SJ, Lee YC, Kuo LC, Lee YL. Association be- tween the initial anatomical severity and opportunity of return to work in occupational hand injured patients. J Trauma 2010; 69: E88-93.
23. He Y, Hu J, Yu IT, Gu W, Liang Y. Determinants of return to work after occupational injury. J Occup Rehabil 2010; 20: 378-86.
24. Gillen M. Injuries from construction falls: functional limitations and re- turn to work. AAOHN J 1999; 47: 65-73.
25. Chang JH, Wu M, Lee CL, Guo YL, Chiu HY. Correlation of return to work outcomes and hand impairment measures among workers with traumatic hand injury. J Occup Rehabil 2011; 21: 9-16.
26. Lee KS, Won JU, Kim SY, Sohn MS, Youm YS, Lee YS, Kim DJ, Cho SH, Lee MJ, Choi JS. Development of the Korean Academy of Medical Sci- ences Guideline for rating physical impairment. J Korean Med Sci 2009;
24: S221-6.
27. Sohn MS, Lee KS, Park DS, Won JU, Chung YG. Guides to the evaluation of permanent impairment: commentary and case study. 1st ed. Seoul:
Korean Academy of Medical Science, 2011.
28. Robinson KM, Monsivais JJ. Malingering? no evidence in a predomi- nantly Hispanic workers’ compensation population with chronic pain.
Pain Manag Nurs 2011; 12: 33-40.